Legacy Wi-Fi Adaptor Benchmarking Methodology
Tom's Hardware shows you how we test USB-attached 802.11ac wireless networking adapters.
Quantitative Testing
Throughput is one of a Wi-Fi adapter's key specifications. Since these are all AC1200-capable models, you might not expect much variation between them.
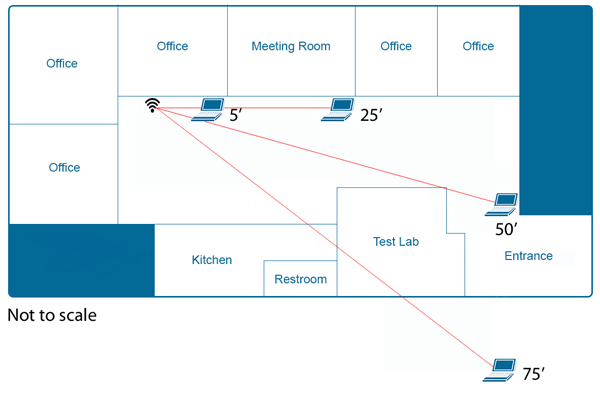
The router and the overall network topography remained constant throughout testing. Throughput was measured at five, 25, 50 and 75 feet. The distances were determined with a measuring tape. Fifty-foot testing included two intervening walls that were in the way due to the physical setup of the test lab. Line of sight was slightly lost at 50' as we turned a corner to get far enough away from the router. Tests reaching 75 feet go out into an open atrium just outside the suite's entrance. The setup is in the first floor of a commercial building, and the walls are constructed of plaster.
Above is a figure of the office test setup that shows the various distances, and the intervening wall structures at 50 and 75 feet. If 75-foot testing is done, the procedure puts the tested adapter outside of the office. The diagram is not to scale.
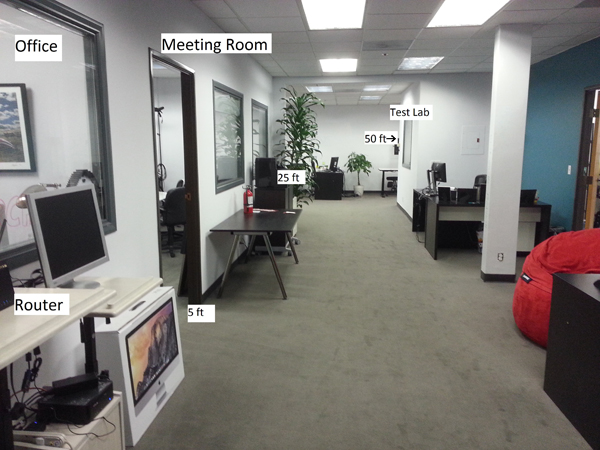
A labeled image shows the physical setup of the testing location. Note that the router on the left-hand side is standing at an upright angle.
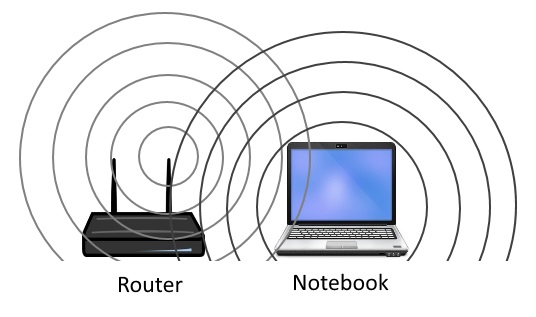
When a router and adapter are too close together, the Wi-Fi signals can cause interference (as represented in the image above). This is why a router and an access point (AP) should not be set up in close proximity, and not on the same Wi-Fi channel.
In most cases, the speeds close to the router at the five-foot distance were slower than at 25 or 50 feet. This phenomenon can happen when the signals are too strong between the router and the adapter, creating interference as a result of being too close to each other. Simply put, this is one of those cases when a wired connection is preferred over wireless.
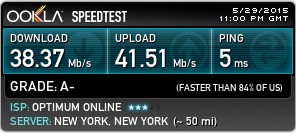
A screenshot of the type of data that the popular Web-based Speedtest (www.speedtest.net) generates. While it will provide an indication of the download and upload speed, it measures the Internet connection and not the wireless network speeds.
Get Tom's Hardware's best news and in-depth reviews, straight to your inbox.
Measuring the speed of a network connection is a vital part of each adapter's quantitative evaluation. Simply running an Internet speed metric, such as Speedtest.net, will give you the speed of the online network connection, but it's not the right test to use to compare Wi-Fi speeds. Unless you have a gigabit connection (such as Google Fiber), the throughput of a home's internal network will be faster than the Internet, invalidating the use of a Web-based tool for these tests.
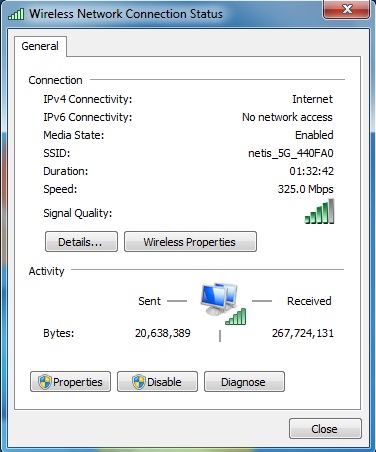
A screen capture from Windows 7 showing the network speed estimate over a 5GHz Wi-Fi network; in this case it was 325.0 Mb/s.
There are better ways to approximate wireless network speed. The first is Windows' Network Center, which can provide a rough estimate of the network adapter's connection. It's not an indicator of actual performance though, so it is not the best number to use since it does not get measured directly.
For home users with multiple devices on their network, by transferring a file between two computers within a Windows Home Group, knowing the size of the file and timing the transfer time, speed can be measured and Mb/s derived. One of the devices should be wireless and the other one wired, preferably on a 10/100/1000 Mb/s Ethernet port, to best measure the wireless connection's speed. The limitation of this method is that the transfer is manually timed, introducing an element of inaccuracy (the last time I did this I was using a stopwatch app for my smartphone, practicing starting the transfer and the stopwatch simultaneously, which is difficult to perfect).
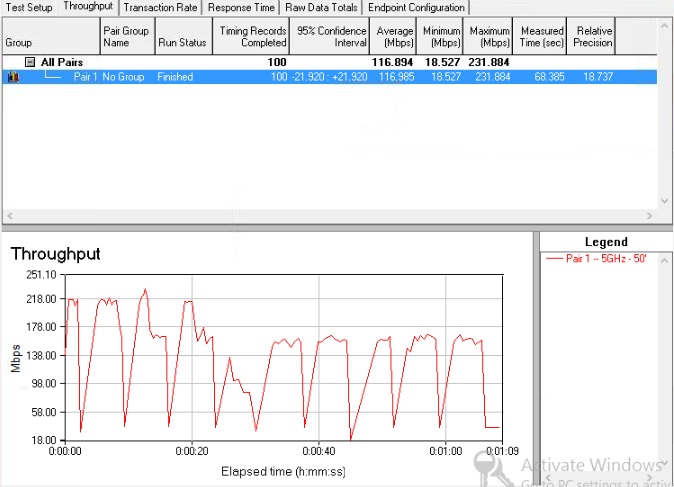
This is the raw data that IxChariot generates. Note the throughput at the 50-foot distance on the 5GHz band fluctuated significantly from a minimum of 18.5 to a maximum of 231.8 Mb/s, which, while it averaged out to 116.8 Mb/s, hardly tells the whole story!
Given the limitations of the previously mentioned techniques, a dedicated software solution was chosen: IxChariot.
This software can measure network performance in a reliable and consistent fashion, including TCP throughput. It'll report minimum and maximum speeds, as well as calculate the average. TightVNCViewer, a remote desktop software solution, is used to remotely access our ASRock server in order to log into a desktop session and retrieve the IP address. Then, TightVNCViewer is terminated. When working with IxChariot, we designate the server's IP address as Endpoint 1 and the laptop's IP address as Endpoint 2. We use the High Performance Throughput test to determine speeds that are reported in Mb/s. Throughput tests are run to completion, which means, specifically, the test is run until 100 timing records are finished and the results recorded with screenshots.
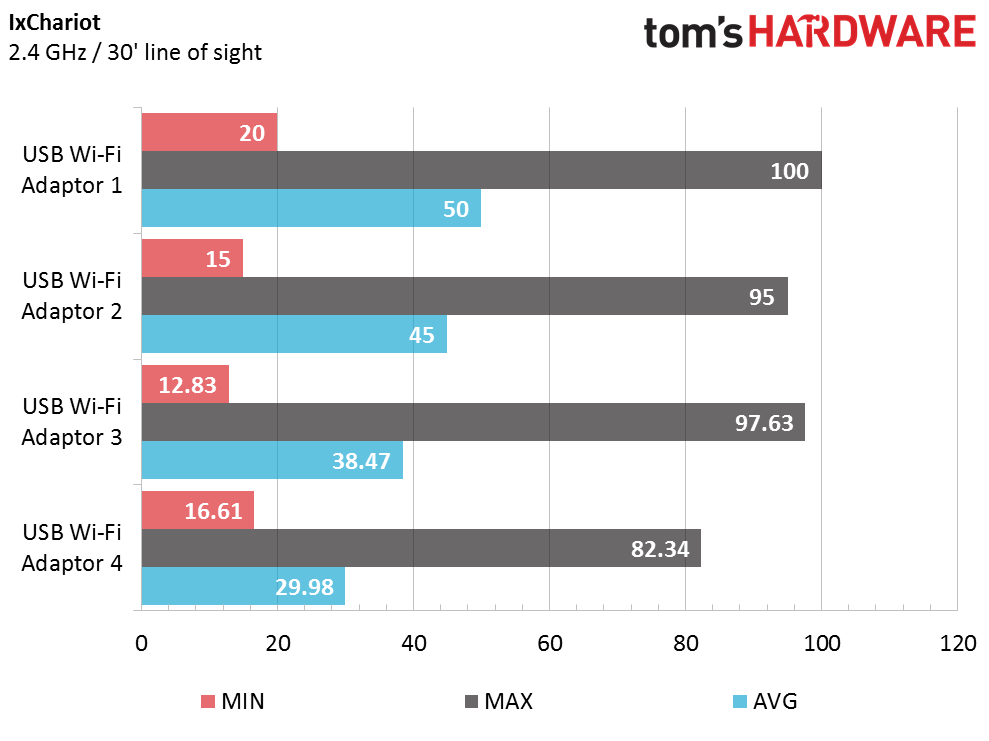
A hypothetical bar graph of the speeds obtained (x-axis, expressed in Mb/s) from four wireless AC USB adapters (y-axis). Note that the maximum speeds are in black, the minimum speeds in red and the average speeds in blue. While one product may have lower minimum values, it may not necessarily have lower averages. This same observation also applies to peaks values.
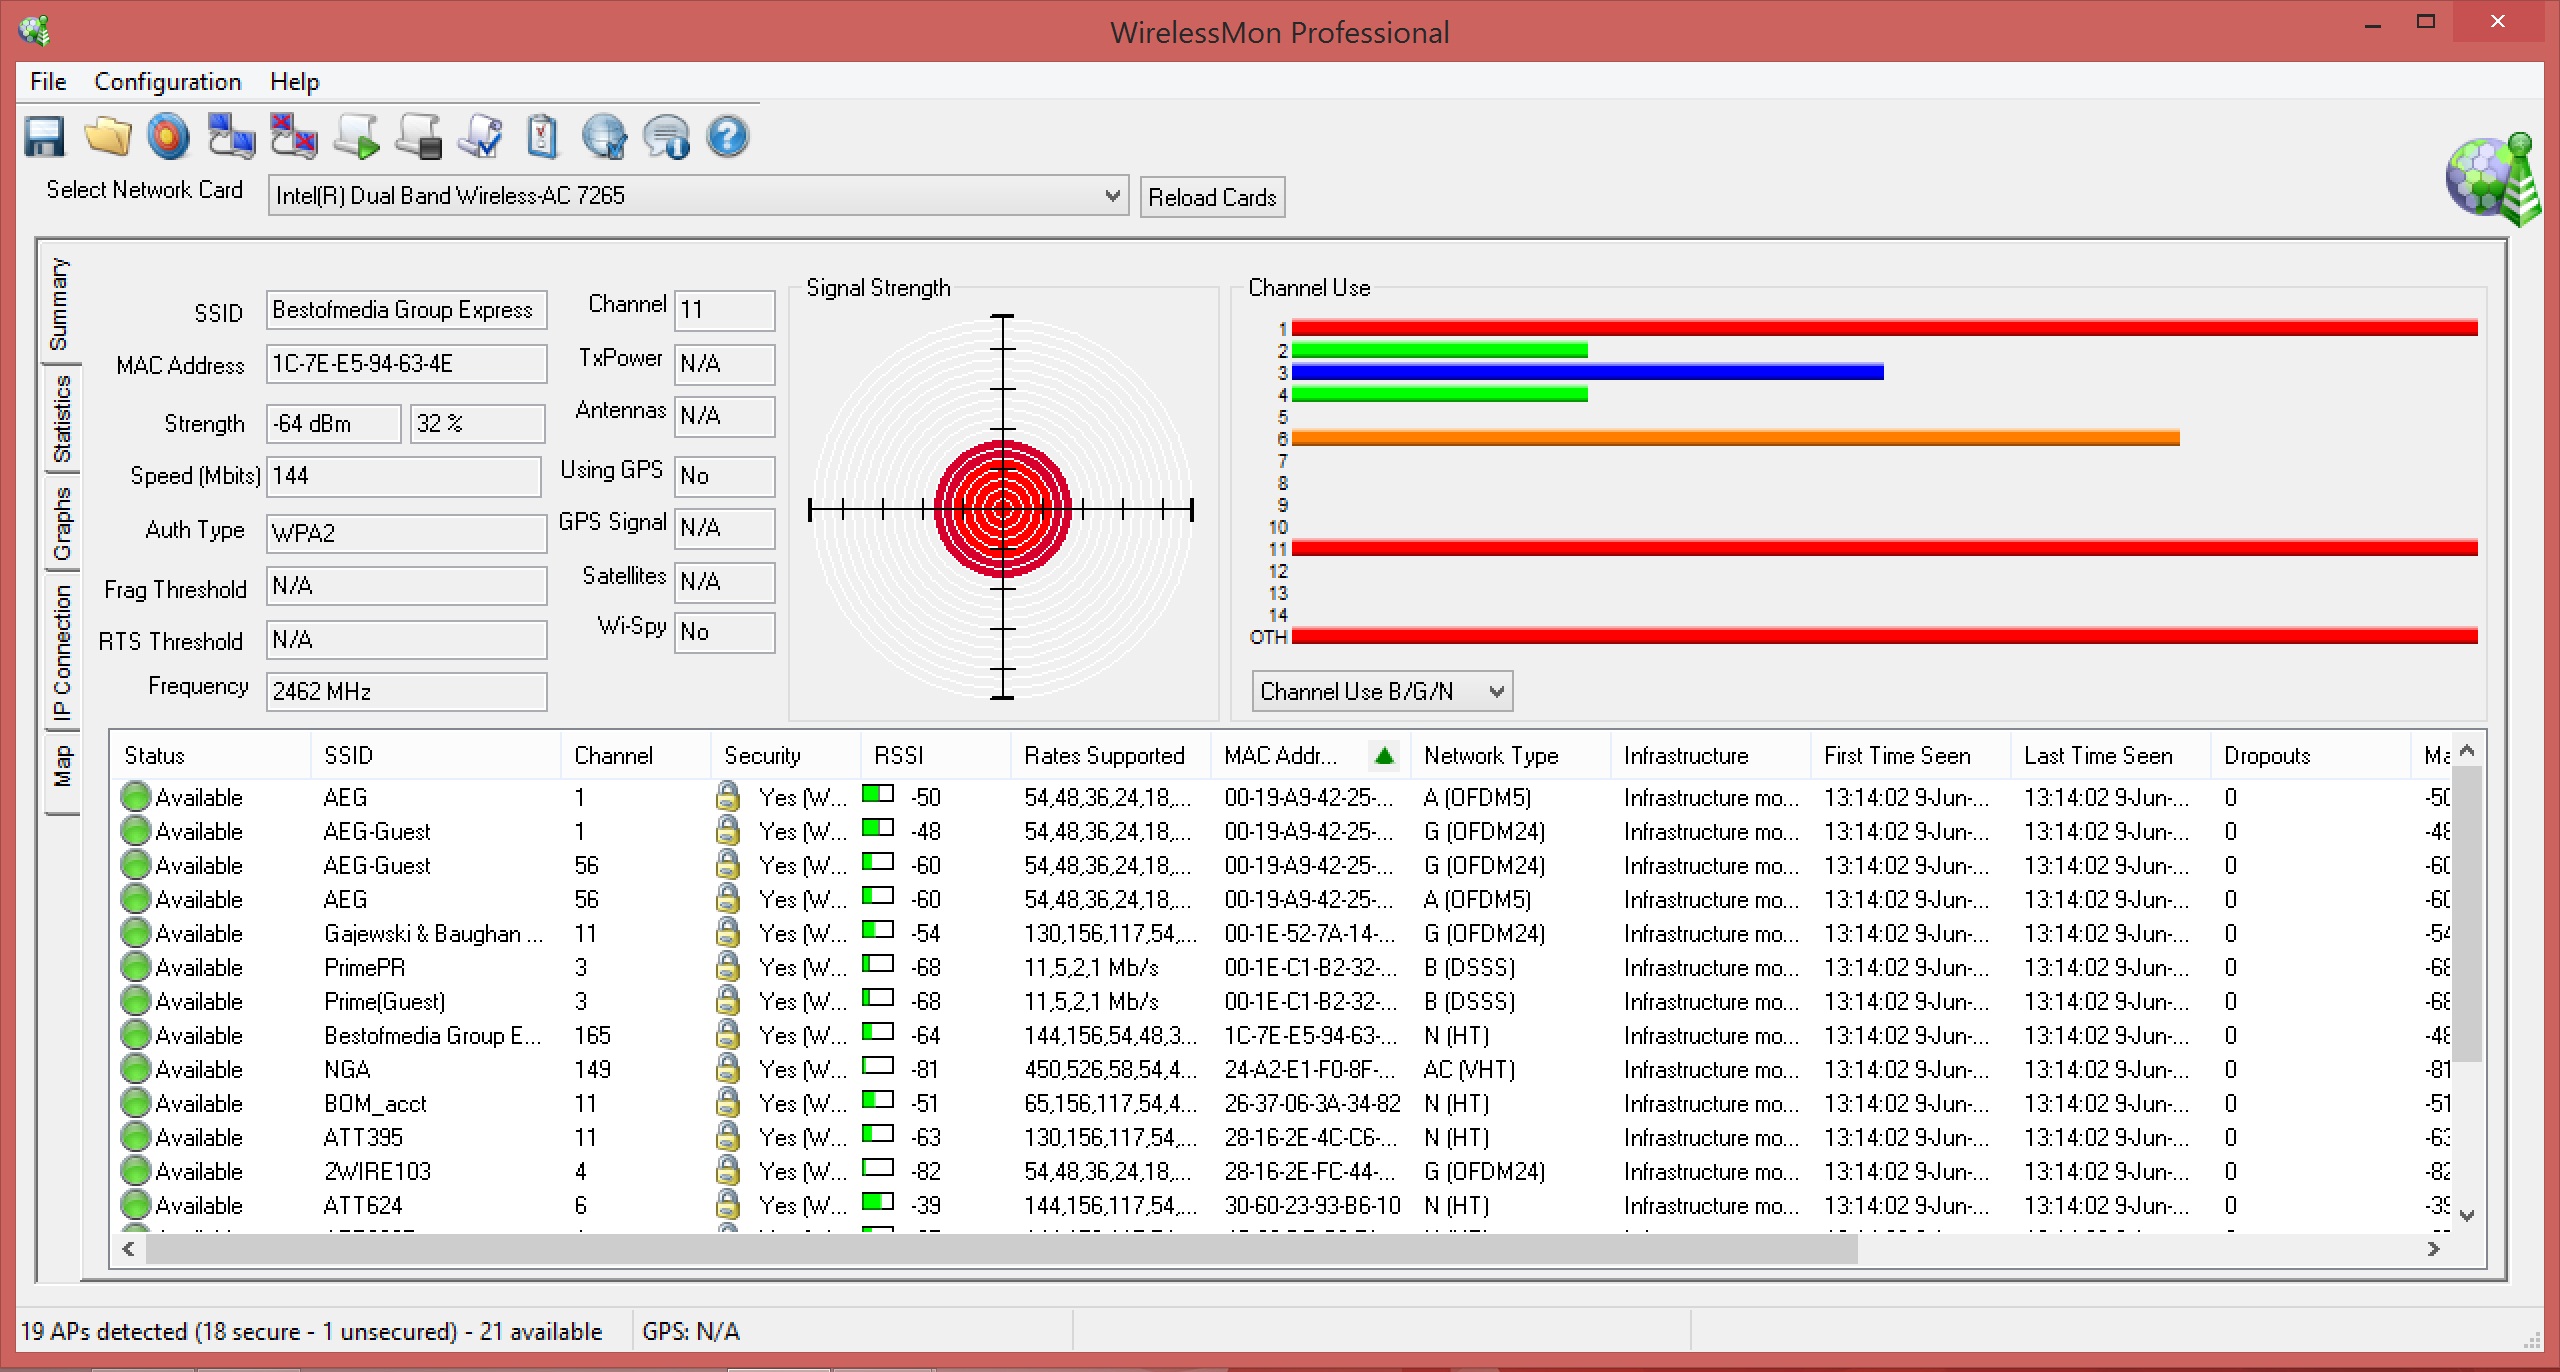
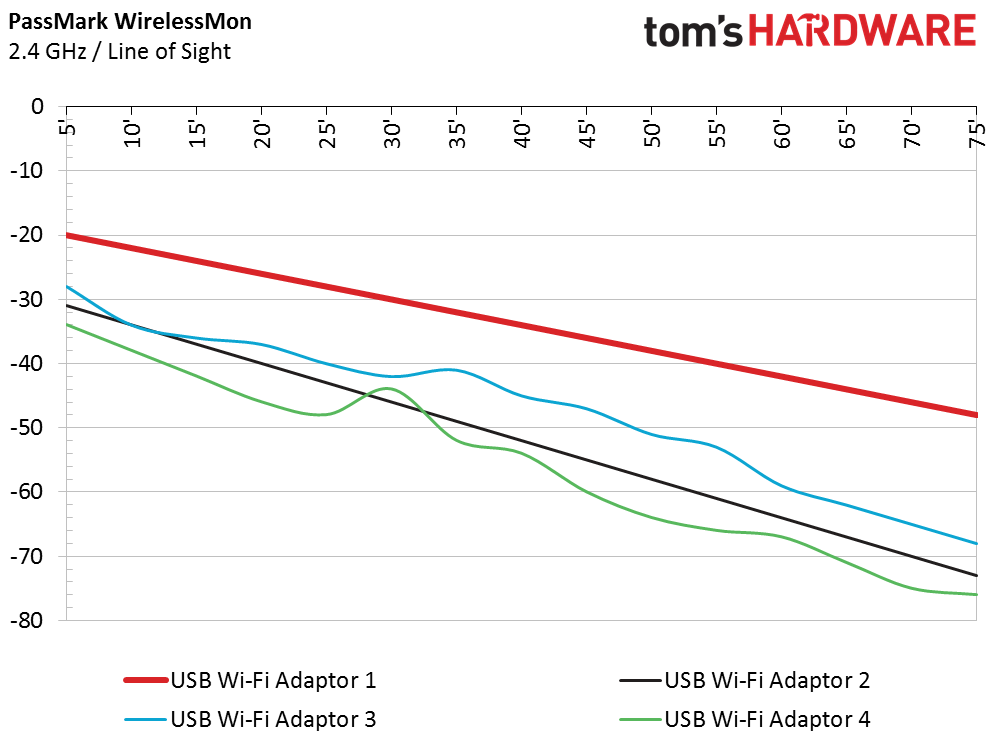
PassMark's WirelessMon is a software package we use to measure signal strength in five-foot increments on the 2.4 and 5GHz bands. The WirelessMon software provides a signal strength reading between the device under test and the router for a given distance. The notebook is held in each spot for 20 to 30 seconds to get this reading. This data set looks at how good the antenna is on the adapter, or if a manufacturer's implementation of beamforming (a Wi-Fi technology designed for directional signal transmission) is working or not, as the distance increases compared to the competition. All of this data gets put into an Excel spreadsheet with relevant notations on how the test went specifically for that USB AC1200 Wi-Fi adapter. With the data collected on each product, all data points are put into a separate Excel spreadsheet for comparative analysis.
A screenshot of the software PassMark's WirelessMon.
A hypothetical plot of four wireless AC USB adapters with the distance from the router expressed in feet (x-axis), and the signal strength in decibels (dB, y-axis). While the red and black lines follow a linear progression, the blue and green plots illustrate how nonlinear signal strength may be.

Jonas P. DeMuro is a freelance reviewer covering wireless networking hardware.
-
blackmagnum I am waiting for Apple to update their cheaper Airport Express base station to AC bandwidth. The current one gave me no proplem at all for various types and brands of wifi adaptors.Reply -
marraco I have a linksys router and a huawei. I also have some laptops with internal WiFi plaques, some USB WiFi dongles, and many phones and tablets..Reply
The huawei dongle works well with the huawei router, and so does SOME internal WIFi plaques.
On the lynksys router, MOST internal WiFi plaques work better, but not all, and not all the USB devices.
Worse, everything changes when many devices are added to the network, like a large number of laptops, phones, tablets which the family, friends and neighbors overlap, accessing my network or other networks I don't use.
At this moment IssiDer shows 2 dozen devices at reach of my PC, and I don't have any control over them.
So, I never trust Tomshardware reviews. They don't test WiFi equipment against a variety of different devices, and they don't check for interference from other networks, and under different channels.
The focus tends to be over performance in isolated and controlled state, but that says little or nothing about real world behavior.
When the air gets filled with other networks, and many different devices are connected to the router, robustness is far more valuable than pure speed.
Also, it does not matter if a specific router performs best with the non disclosed device inside the laptop used by tomshardware for benchmarking, because I may have a different WiFi plaque, and different WiFi USB dongles. -
Foxlife Please keep in mind and add to test methodology the fact that those usb dongles eat up cpu usage, in some case quite significantly vs integrated (within the laptops themselves) solutions.Reply -
tsnor Foxlife said "Please keep in mind and add to test methodology the fact that those usb dongles eat up cpu usage, in some case quite significantly vs integrated (within the laptops themselves) solutions."Reply
I'm surprised by this, given the internal wifi solutions are typically simply mini pci cards. Do you have any references ?
---
I'm looking forward to the actual test results! The test procedures look good. -
dthx Nice article. I do appreciate the transparency on your testing methods.Reply
It is just one way of testing and my experience with some brands that I'll avoid to buy at all cost often differs from your test results. For example, I always had bad luck with anything d-link makes.
But nothing's perfect in this world, especially when playing with radio waves, So although your methodology will never be 100% accurate due to possible interference from the neighbourhood and maybe the microwave oven of your kitchen, I'd rather choose your methodology (close to the real life usage) over any tests done in specialized labs with all tests executed inside a Faraday cage. -
getochkn Why does your picture not show the 2 end antenna's at 45 degree angles like you said you did?Reply -
willy481 I think most people would rather not have to buy an external WiFi dongle for their laptop or NUC - double whamy as as pay twice to lose 1 port, so are you able to test the most popular mPCIe WiFi-AC cards that laptop makers typically include, in particular the Intel Dual Band Wireless-AC 7260 and its recent replacement the 7265 ?. I realise this not as simple as testing external dongle due the fact laptops dont all use identical antenna designs - so just test in a laptop that uses a typical antenna design -better than nothing; perhaps also test the popular D54250 NUC which uses the above 7260 - think all Intel NUCs use similar box & dual internal antennaReply -
EdJulio ReplyWhy does your picture not show the 2 end antenna's at 45 degree angles like you said you did?
The cart is designed to be mobile so it got shifted around during testing. Plus we're constantly switching routers around. The pic caught the cart on an off-day. I swapped out the old pic with a new one. Thanks for the note!!!
