Crucial's m4 SSD Tested At 64, 128, 256, And 512 GB
PCMark 7: Storage Suite
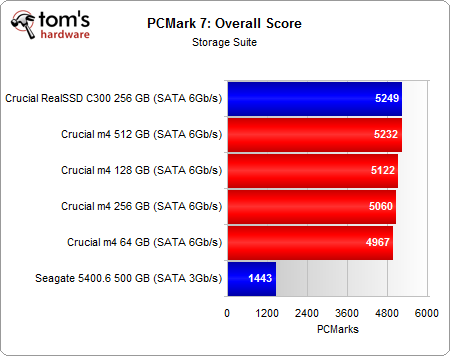
PCMark 7 is the latest synthetic from Futuremark. The older Vantage test gives a moderate approximation of storage performance, but there are situations where the scores vary too much from one run to another to make it a great tool for evaluating SSDs. Both metrics use the same underlying trace-based technology from Intel's IPEAK. However, Futuremark's programmers made a few changes in the latest version that it claims improve its accuracy, though it's still hard to make sense of this benchmark's results. Fortunately, at least the variability is gone.
The m4s all rank in the order you'd expect, with the exception of the 256 GB drive. Surprisingly, the RealSSD C300 holds a lead here over the 512 GB m4. The overall storage score is based on a geometric mean of all the sub-tests, though. So, we'll take a deeper look at the individual metrics.
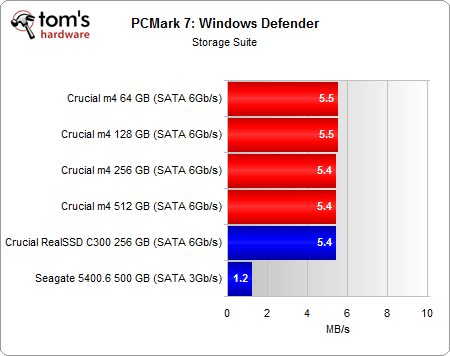
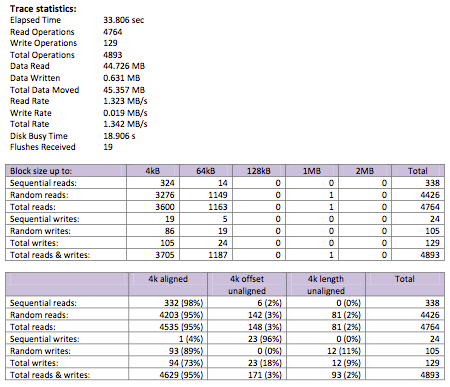
The Windows Defender test is based on a trace of Windows' Defender utility performing a Quick Scan of the system. This is a very read-heavy scenario comprised of lots of random access. In fact, read operations make up 97.9% of the trace. And of the read operations, 93% are random accesses. Naturally, anti-virus scanning and file searches are the two most applicable real-world scenarios for a test like this.
Overall, there's no performance difference between SSDs of different capacities. The 64 GB m4 performs just as well as the 512 GB m4. However, compared to a notebook hard drive, all SSDs offer about 4x the performance.
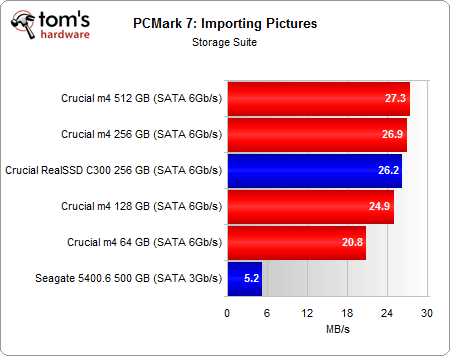
The second test in PCMark 7's storage suite is a trace based on importing 68 images (434 MB total) from a USB thumb drive into Windows Live Photo Gallery. This doesn't actually include copying the image files. The trace only includes the I/O activity pertaining to indexing. This type of scenario involves writing more data than you read, and most of the writes are random.
The capacities line up in the order you'd expect from a write-heavy workload. Higher-capacity SSDs perform better than lower-capacity SSDs. However, notice that we're only taking about a 25% difference between the 64 GB and 512 GB m4s. There's still a magnitude of difference between all of the SSDs and the hard drive reference point, and that gap only widens when the queue depth increases.
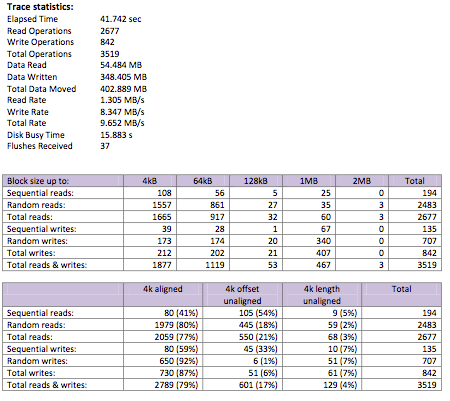
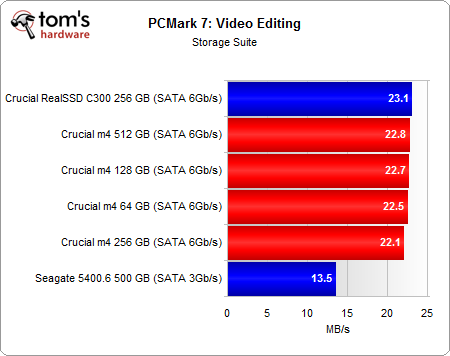
The Video Editing test is based on the I/O activity of publishing a 1080p video in Windows Live Movie Maker. We're dealing specifically with a scenario where multiple high-def sources are combined and written to a single output file. Overall, the split is 30/70 between random and sequential reads, and reads are more prevalent than writes. In fact, the ratio is about 1:9 in favor of reads.
Get Tom's Hardware's best news and in-depth reviews, straight to your inbox.
This helps explain why the m4s line up similarly here as they did in our Iometer-based 4 KB random read test.
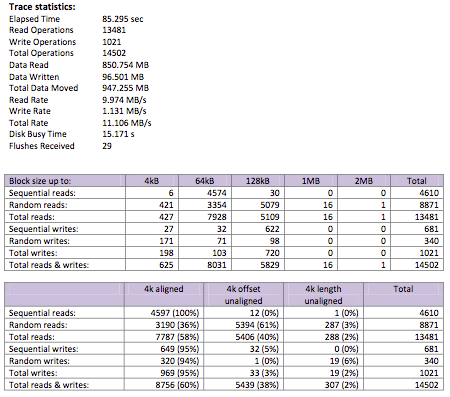
The Windows Media Center test is a based on a trace of an HTPC recording two simultaneous TV shows in Windows Media Center, while playing a separate prerecorded show. We're basically reading one file and writing two others.
This type of scenario involves a lot of random writes (94%), because Windows Media Center incrementally adds data to the video file as the TV show progresses. Reads are another story, as they're almost all sequential (84%). Playing a video file is different than recording one; when you play a video file, you're loading it up and playing it back as a continuous stream.
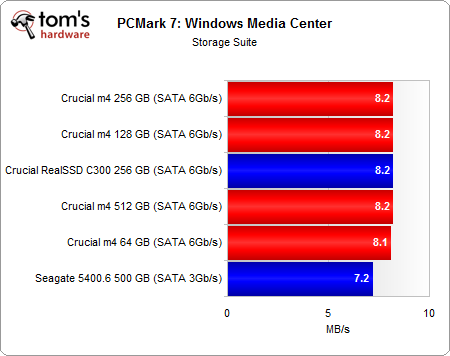
Though the 64 GB drive scores 0.1 MB/s slower than the rest, there's barely any difference between the m4s. Interestingly, this is a scenario where Seagate's 500 GB Momentus 5400.6 performs well.
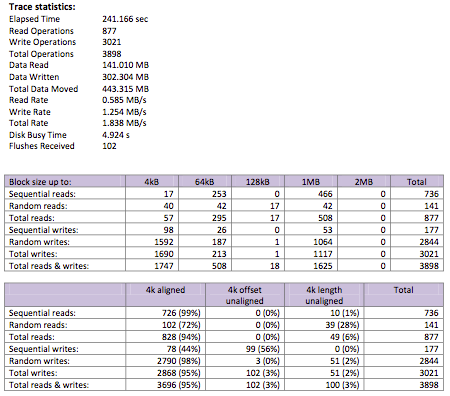
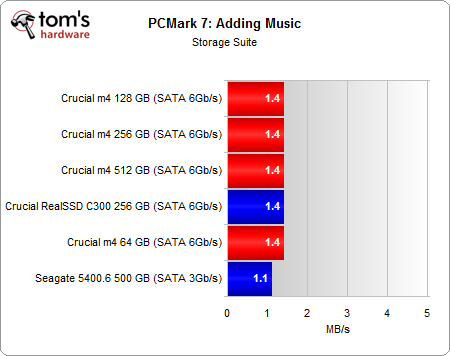
The Adding Music test in PCMark 7 is a not exactly what it sounds like. Futuremark hooked a drive filled with 68 GiB of music files (lossless WMA) to a computer and recorded the I/O activity while Windows Media Player added the audio tracks to the music library. The important point is that this doesn't actually involve copying files to the disk. Rather, it's all about scanning and indexing music files. You'd think that means more random reads and almost no writes, but indexing involves adding to a database of information. That's why we're dealing with more sequential writes (75% of all writes) and a situation where reads are outnumbered by writes 2:1.
In this benchmark, we're presumably restricted by the low bus speed of the external disk with all the music files. This would explain there's very little difference between the various SSD capacities (and even the hard drive).
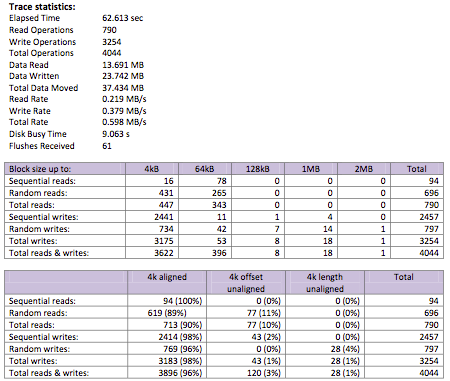
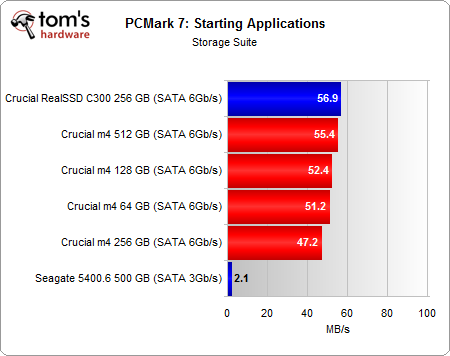
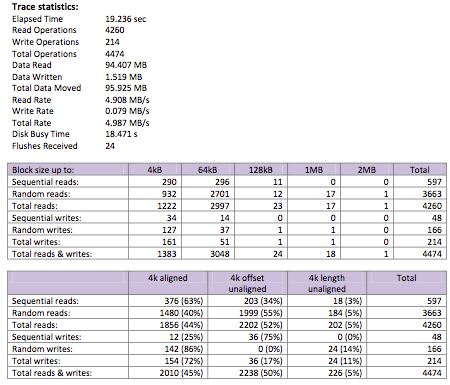
The Starting Application trace is extremely brief in that it's only made up of loading the PCMark 7 Whitepaper v1.0 PDF and opening Internet Explorer from the taskbar (19.236 seconds). That adds up to reading a 717 KB PDF file and loading executables, along with related file dependencies from the system drive. The amount of data read outnumbers the amount written 63:1, and most of the read accesses are random in nature (86%).
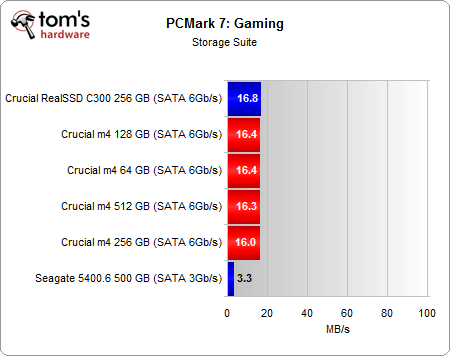
With the exception of the 256 GB m4 and RealSSD C300, there's a trend toward better performance with greater capacity.
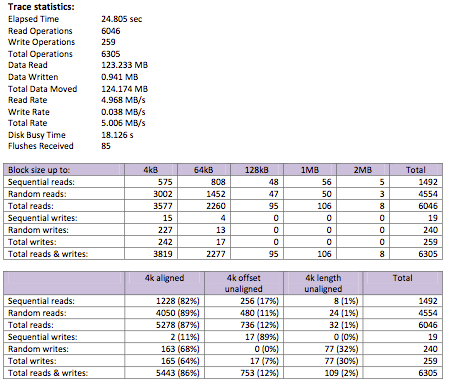
The Gaming test involves starting and loading World of Warcaft, which is why we're dealing almost exclusively with reads. Most of the read operations are random in nature, but in terms of the total amount of data read, there's a fairly even split between sequential and random accesses. Even though there are 3002 random reads and 575 sequential reads with block sizes up to 4 KB, this cumulatively only accounts for less than 14 MB of the total 123 MB read. At block sizes between 1 and 2 MB, there are more sequential reads than there are random reads.
The margin of difference is much smaller than the Starting Applications test, so it's difficult to make any comment on performance. Of course, there's still a clear line in the sand between SSD and hard drive speed.
Current page: PCMark 7: Storage Suite
Prev Page Sequential Performance Vs. Transfer Size Next Page Power Consumption-
wintermint I've been recommending the Crucial m4 128gb to people, and after seeing this.. I'm glad I did :]Reply -
sceen311 it'd be nice if they threw a 7200 rpm hardrive on the bench... We don't all have laptops ya know.Reply -
compton I'm glad this was done. It's rare that you get the chance to stack all the capacity points up (as in never). I bought an Intel 510 120GB and a M4 64GB and my own testing showed that you'd never know the difference besides the capacity (in day to day use, besides lower max write MB/S). I kinda like keeping my system drive to a bare minimum -- just Win7 no swap or hibernate, Office, a few other apps, and then I keep my Steam folder on a separate drive. Simple. I will say that if you are building a new system, cut whatever you have to in order to fit at least a 64GB SSD -- the M4 is excellent at any capacity. I'd rather have to go down to an i3 from a 2500k than from a SSD to a HDD. I get tired of people saying "it's not worth it" and "they're not much faster than a 7200rpm". Those people must be doing it wrong.Reply -
beenthere Now if they could only make these SSDs reliable, we could all enjoy some performance improvement. Intel, Micron, OCZ and Corsair to name a few have all had reliability/compatibility/firmware issues of some sort resulting in loss of data, which for me is simply unacceptable.Reply -
Last month I got a 64GB for my laptop and a 128GB m4 for my desktop. So far no issues, and the speed is great. Glad I got the 128GB and not the 256GB.Reply
-
PCMark 7 Storage tests are just pathetic, they have messed some of them up on purpose it seems just to shrink the difference between systems containing SSD and the ones containing HDD only, useless bench from start to "finish"...Reply
-
mroanhaus I picked up the 64 GB M4 two weeks ago on Newegg for under $90. I am so glad I bought it, the thing makes boot times lightning fast. I have Win7 64-bit, Photoshop, 3DS Max, Google Chrome, and a few little monitoring and Bitcoin mining apps on there and I STILL have 21 GB to spare. Don't buy the 128 GB unless you really need it, throwing Steam and other massive apps will be much better suited on a secondary HDD. SSDs are simply amazing and well worth the money spent, even if you're a cheapass like me they're still affordable. The time saved from having to wait around while booting your computer makes SSDs worth the money imoReply -
burnley14 ReplySee how they all hover pretty close to the same price per gigabyte, while sequential write and random write performance trend upward? Those are the spoils available to folks willing to spend more on higher capacities.
This is true, but in 6 months when the whole lineup is outdated and the next generation of drives blows these ones away, those that spent more are going to have spent the extra money without much purpose. -
cknobman burnley14This is true, but in 6 months when the whole lineup is outdated and the next generation of drives blows these ones away, those that spent more are going to have spent the extra money without much purpose.Reply
Well going by your logic why should anyone ever spend money on anything in technology??? Guess its always a waste huh?
Failed logic.
