Why you can trust Tom's Hardware
For our power, temperature, clock speed, and fan speed testing, we use Powenetics testing hardware and software. We capture in-line GPU power consumption by collecting data while looping Metro Exodus at 1440p ultra as well as while running the FurMark stress test at 1600x900. Our test PC remains the same old Core i9-9900K as we've used previously, to keep results consistent. We tested the MSI card in its default mode and also enabled AMD's Rage mode in the drivers, which applies a potential 10% power limit increase. This is where the MSI card unfortunately fails to impress.
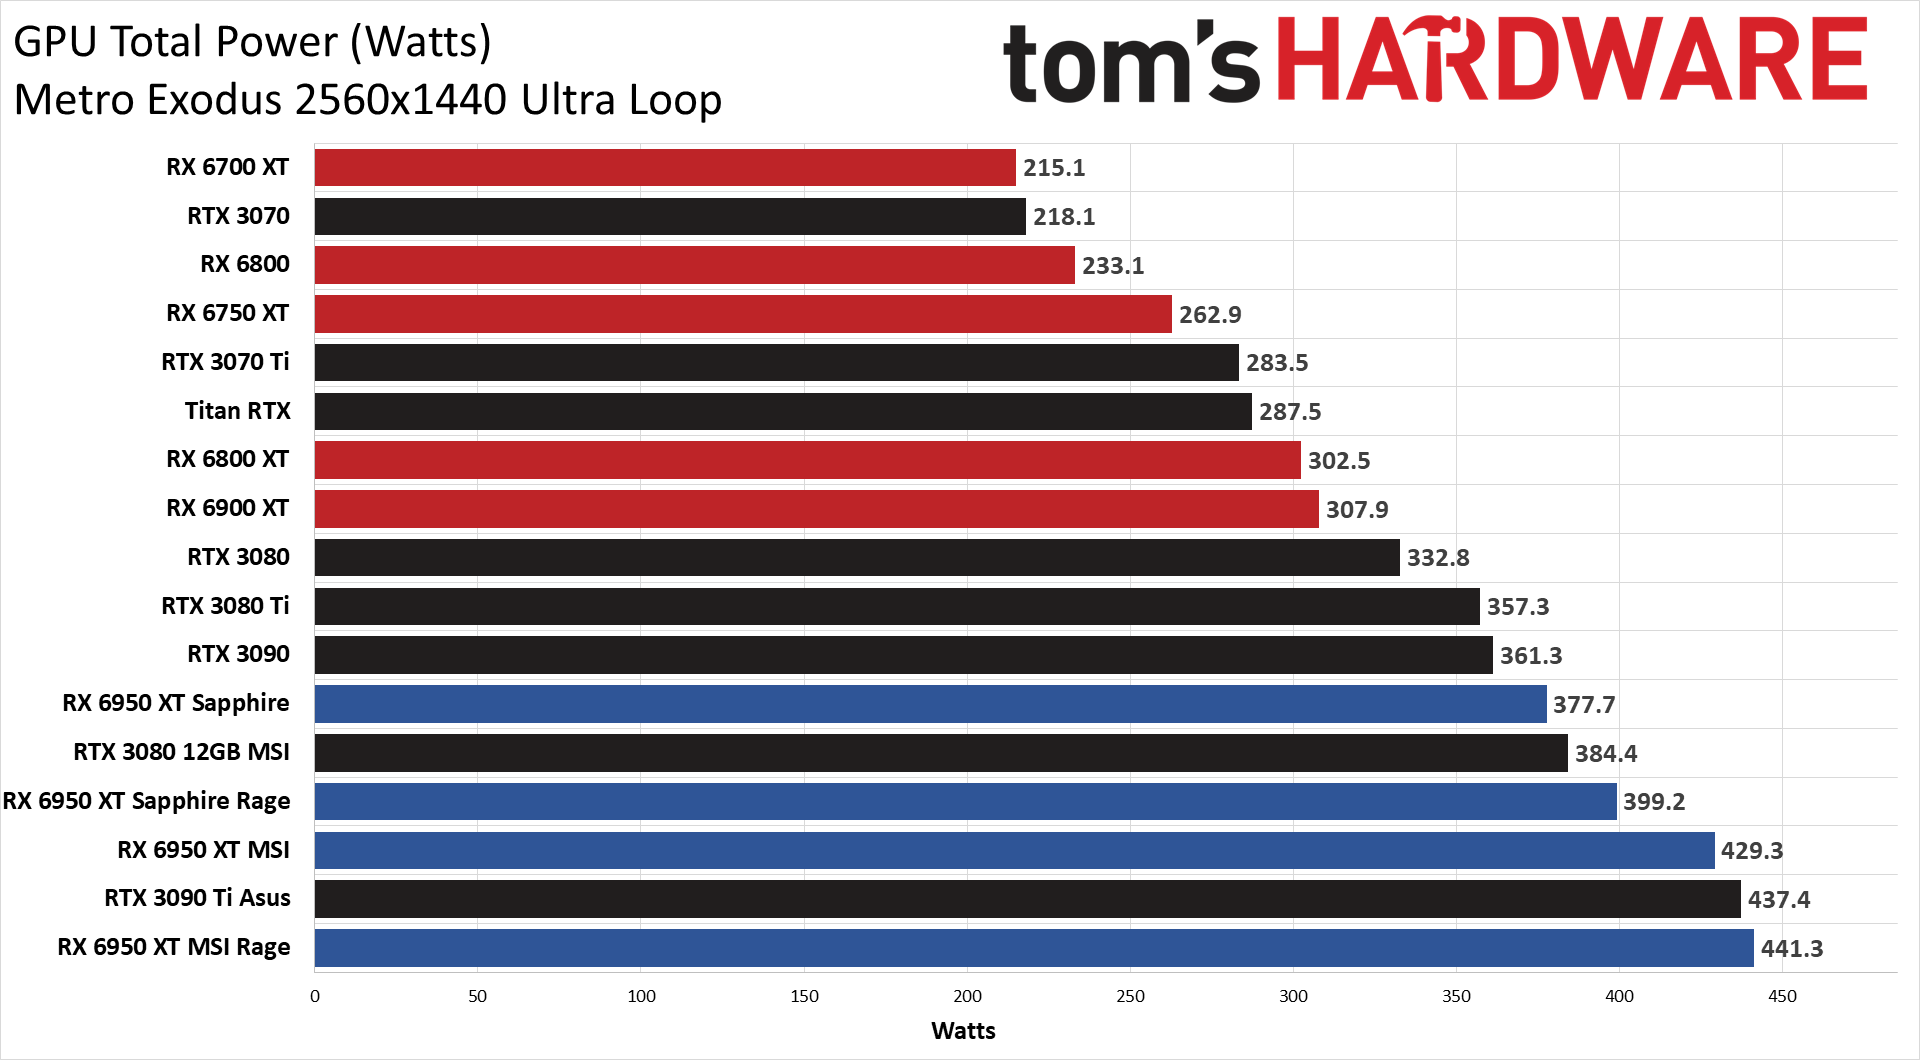
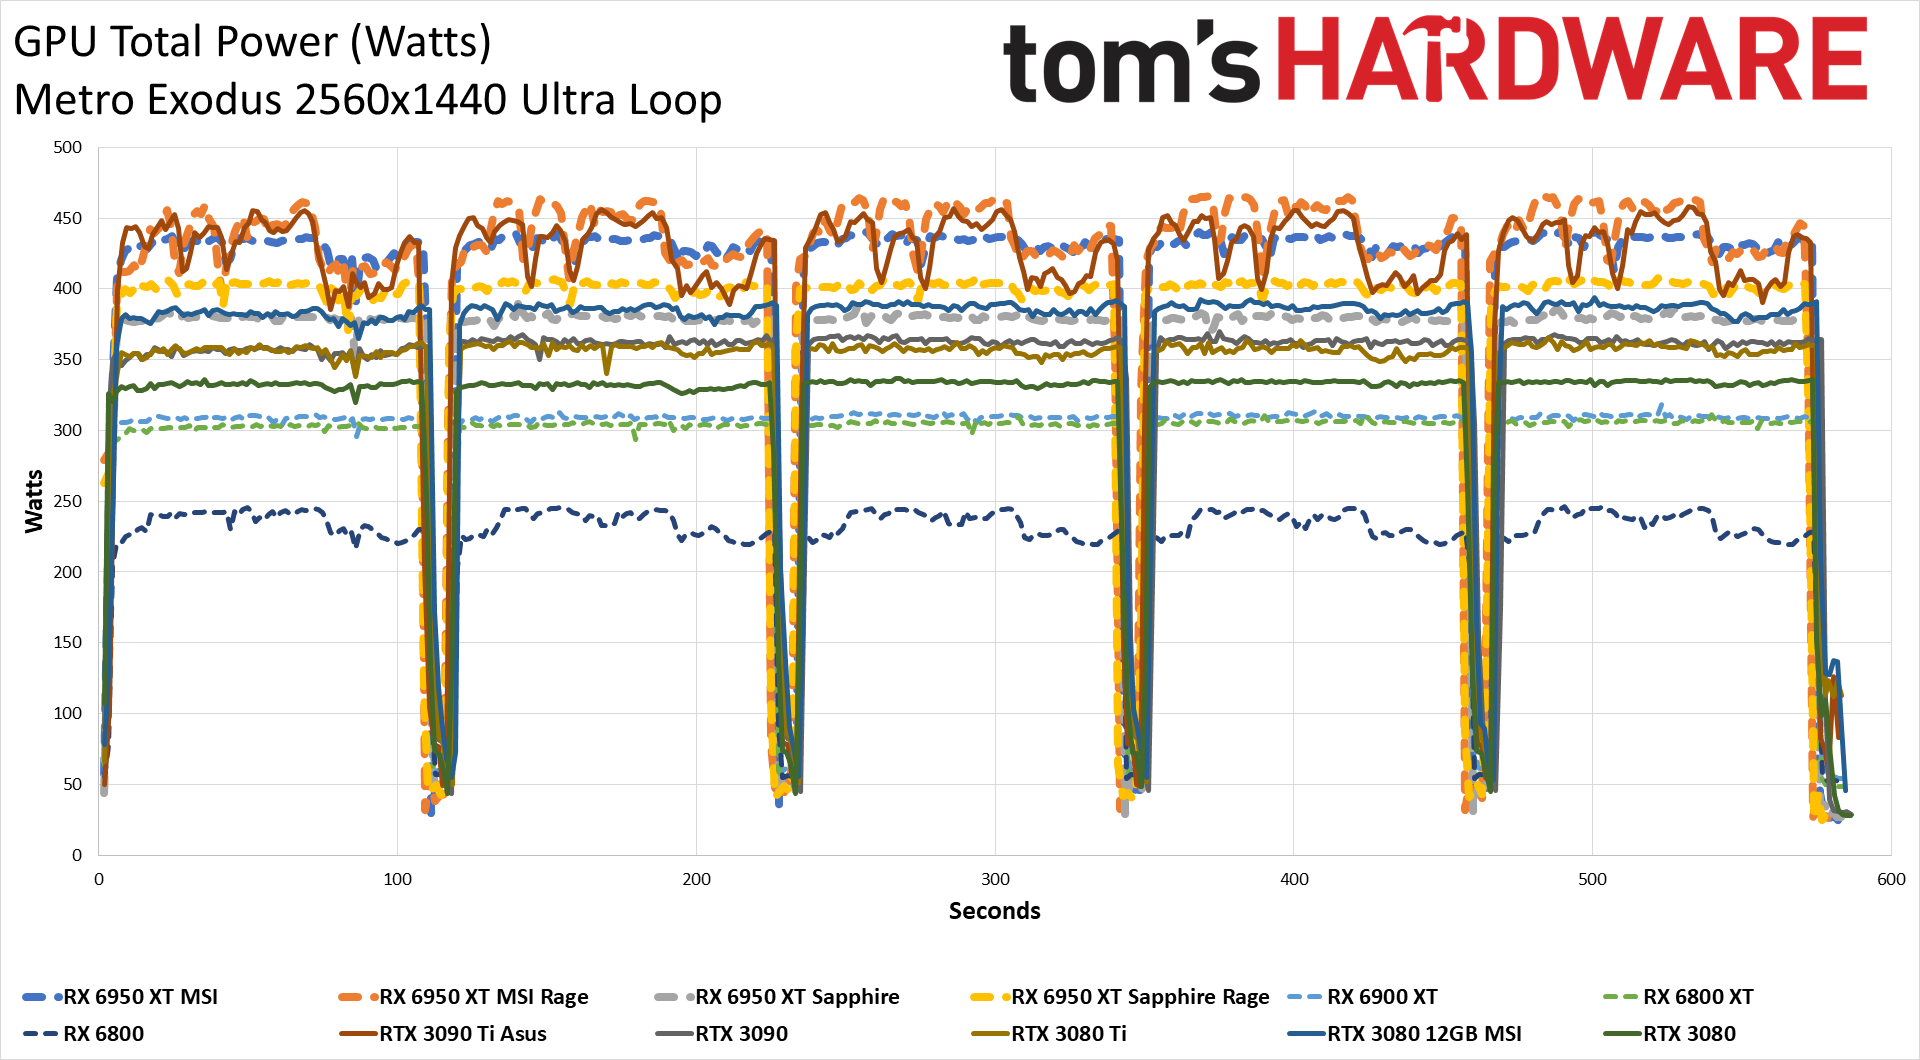
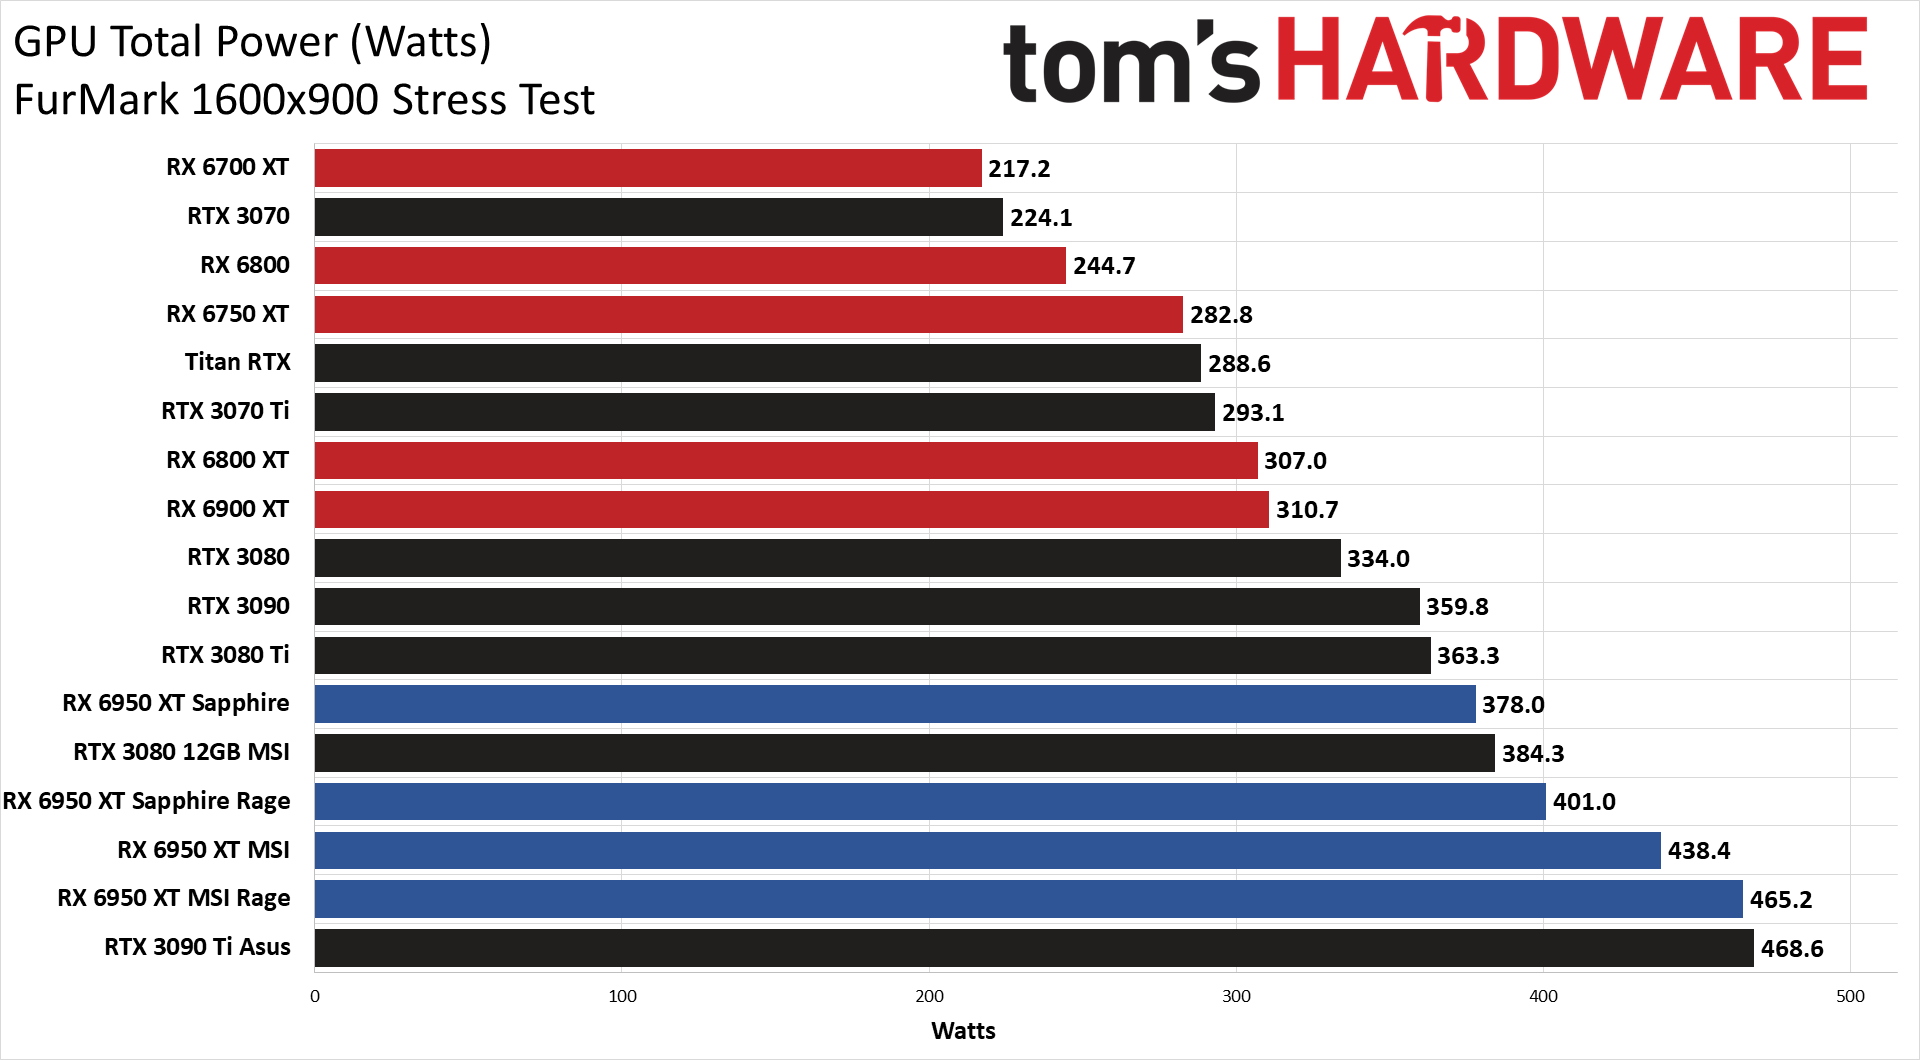
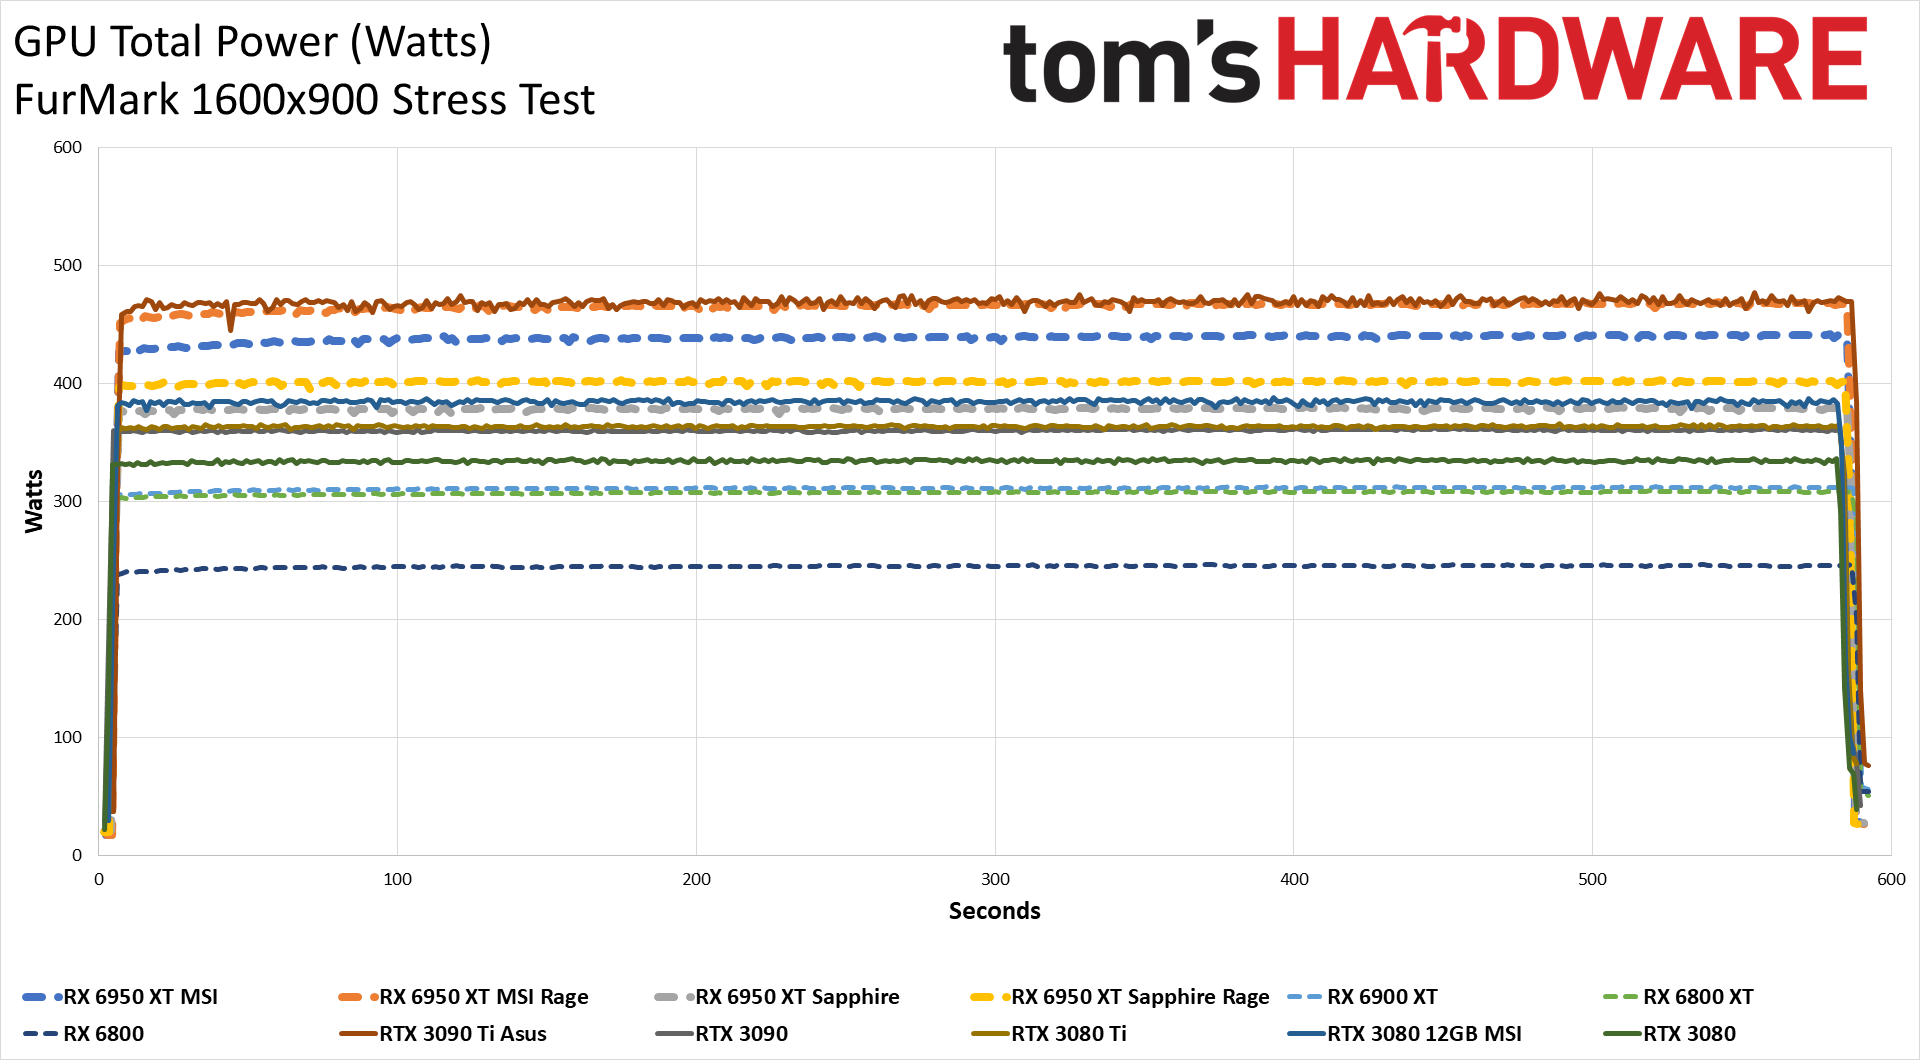
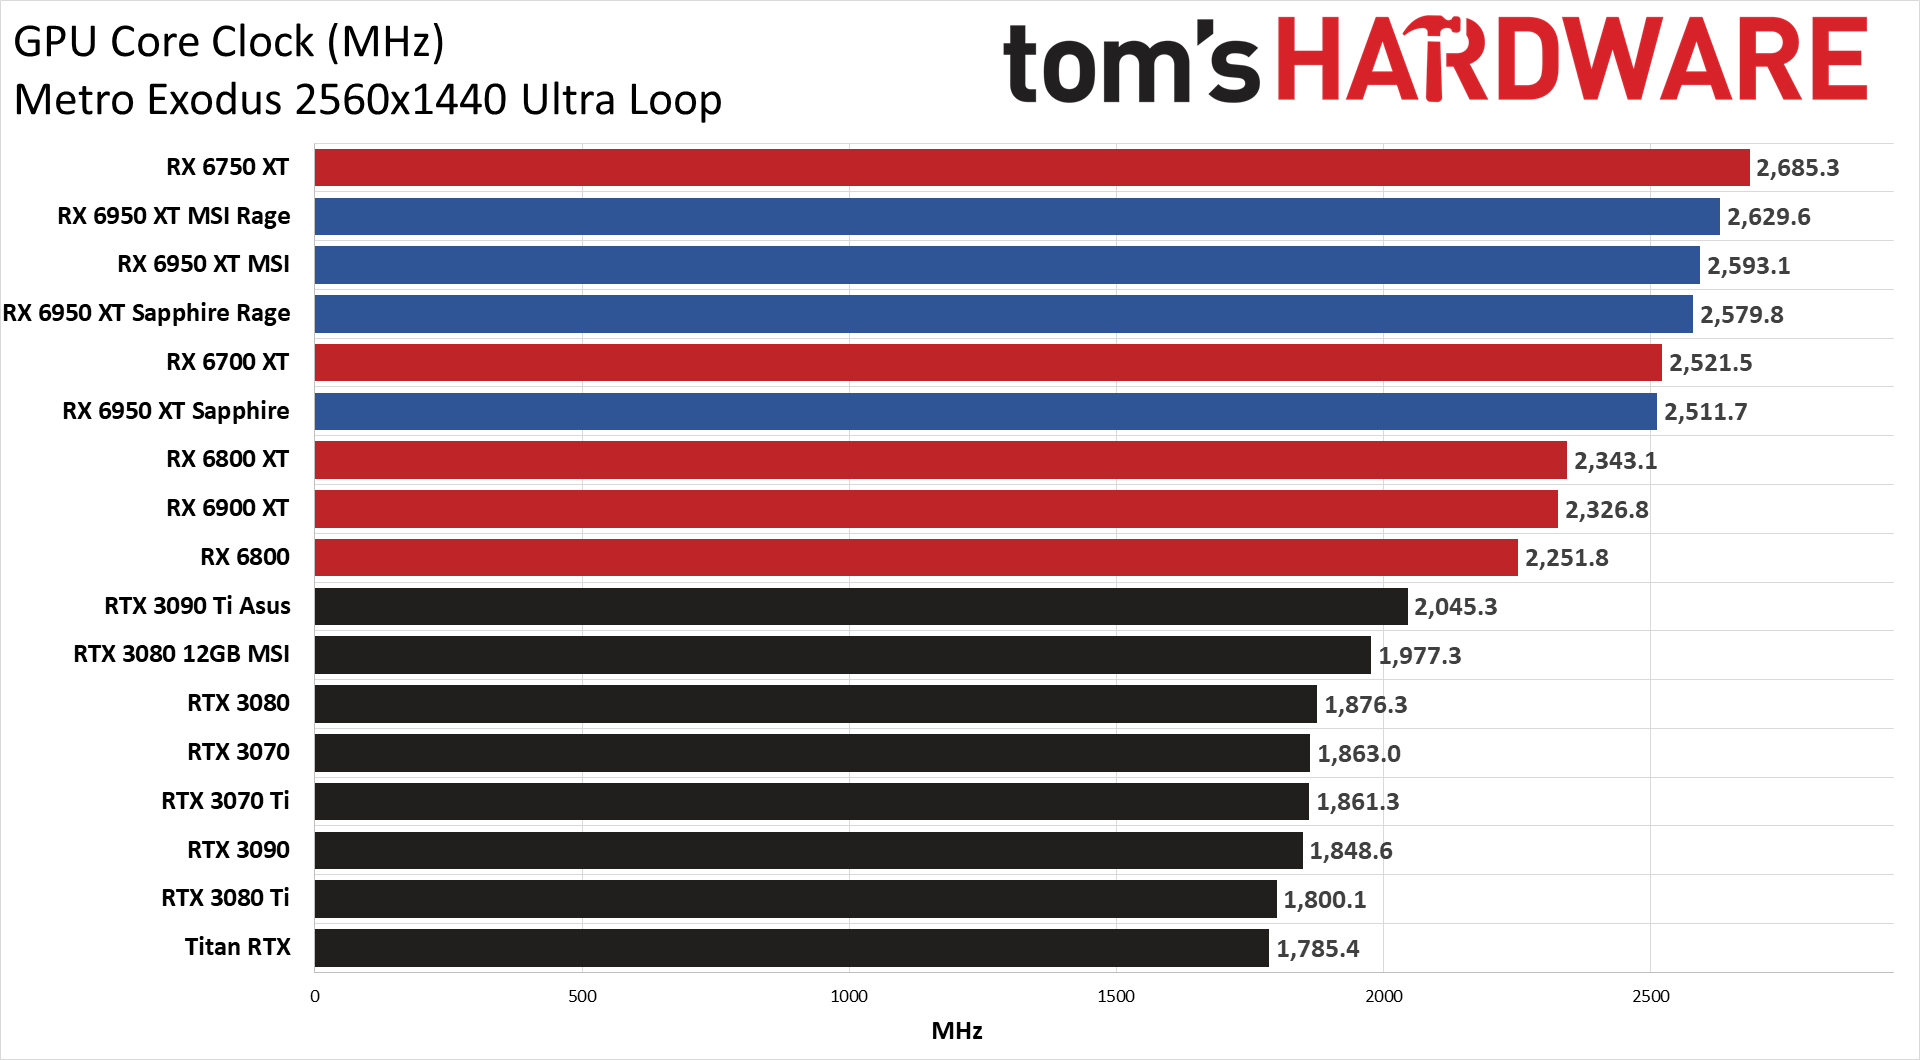
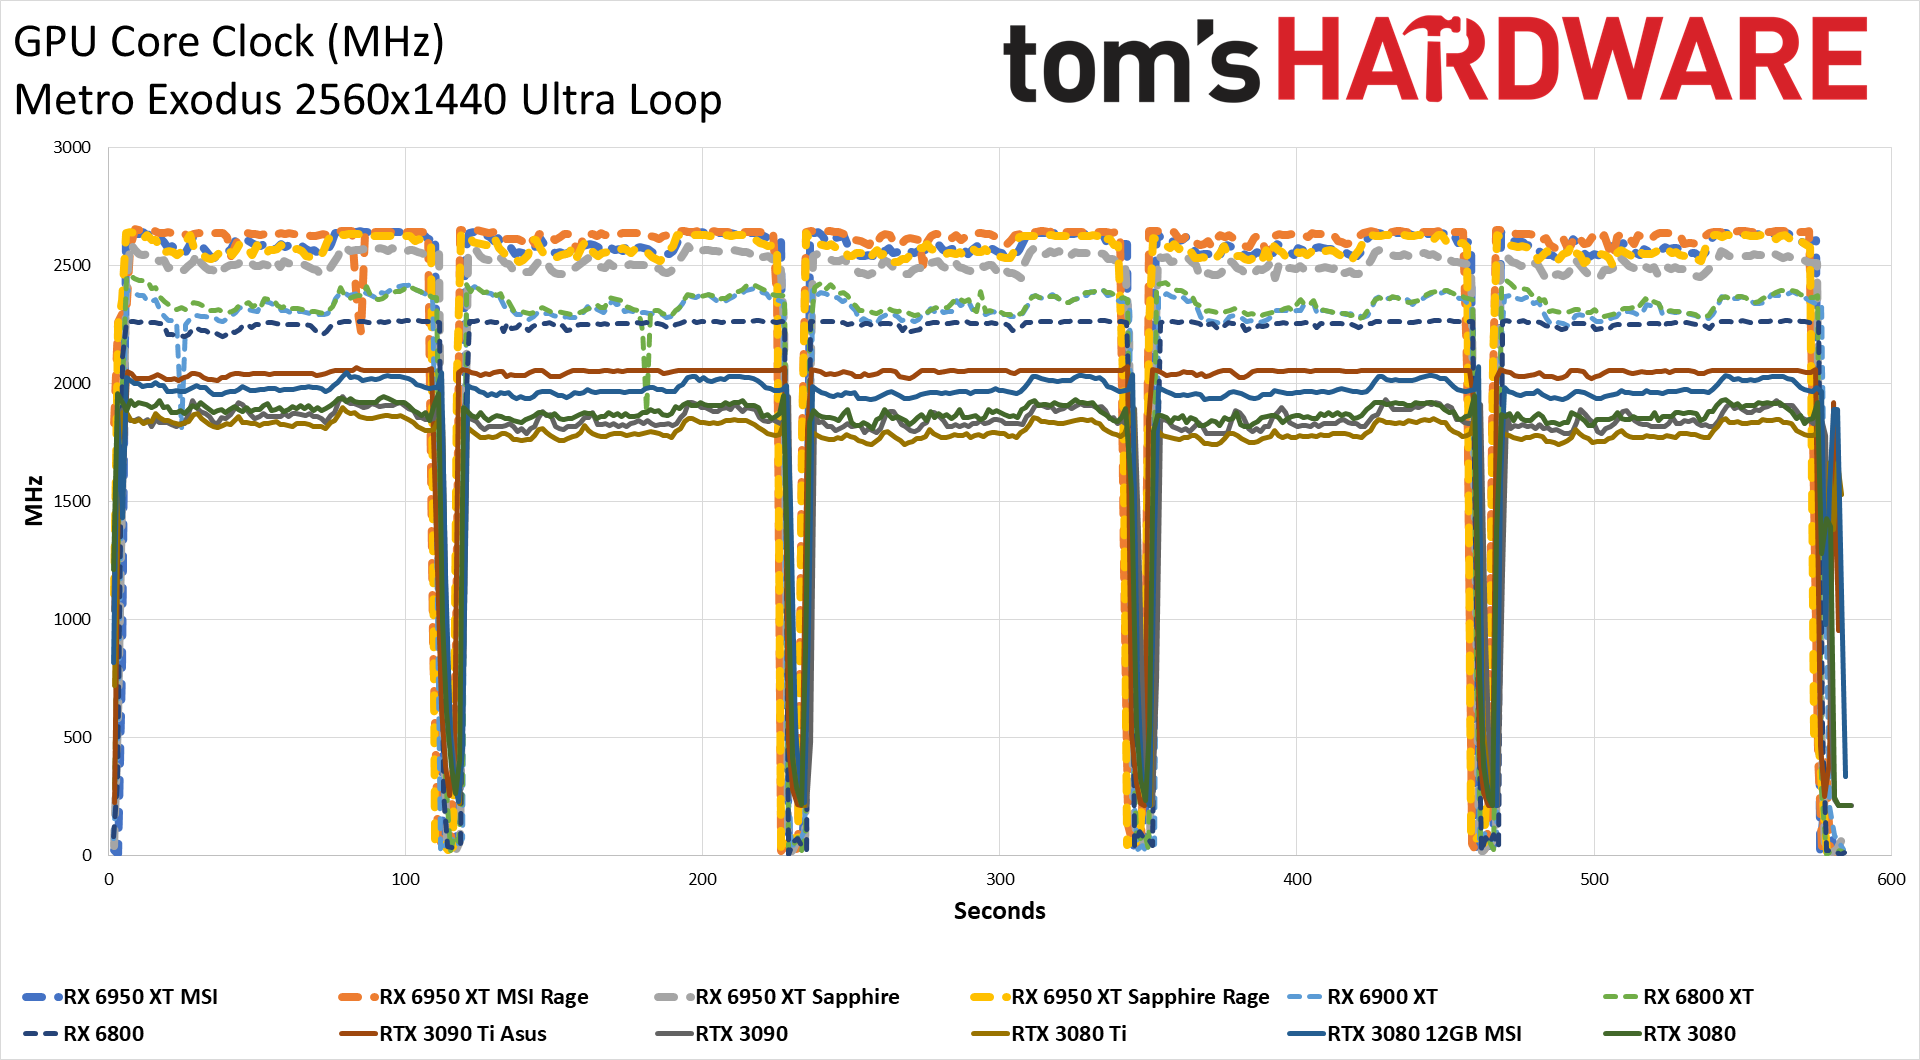
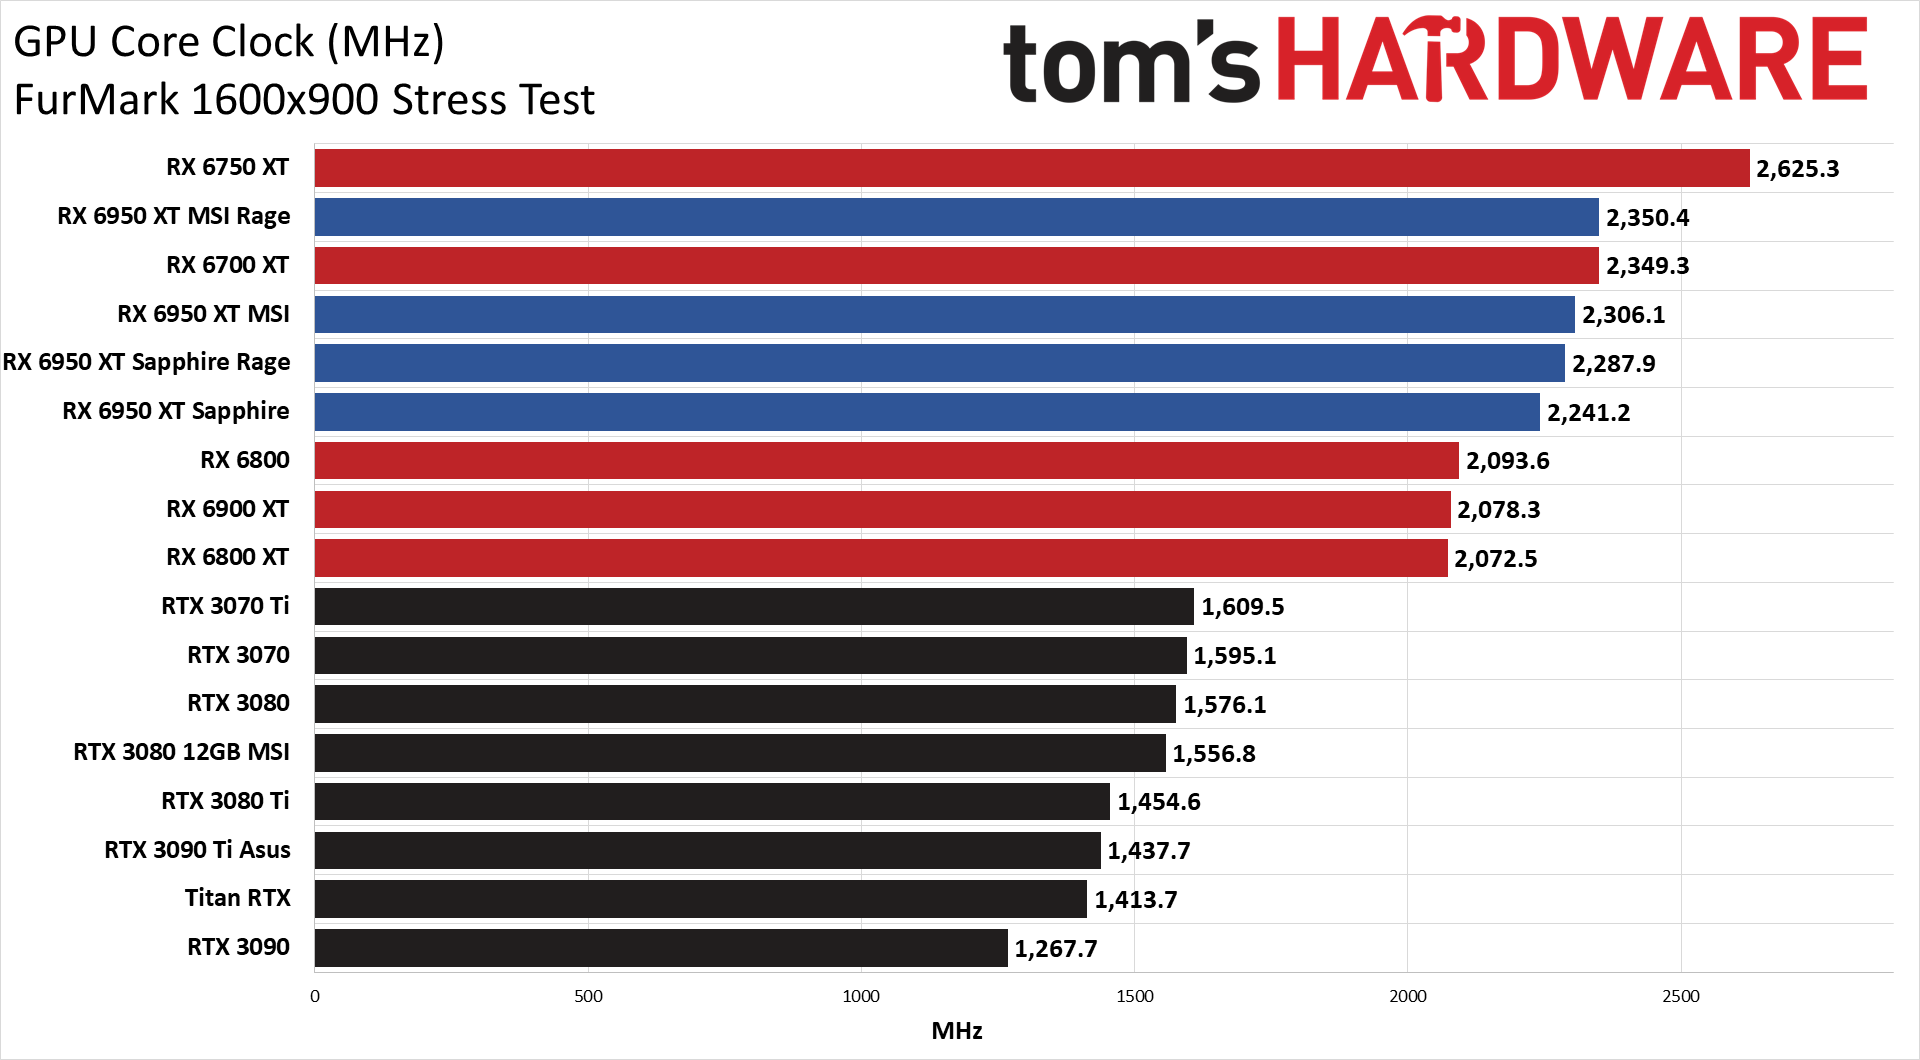
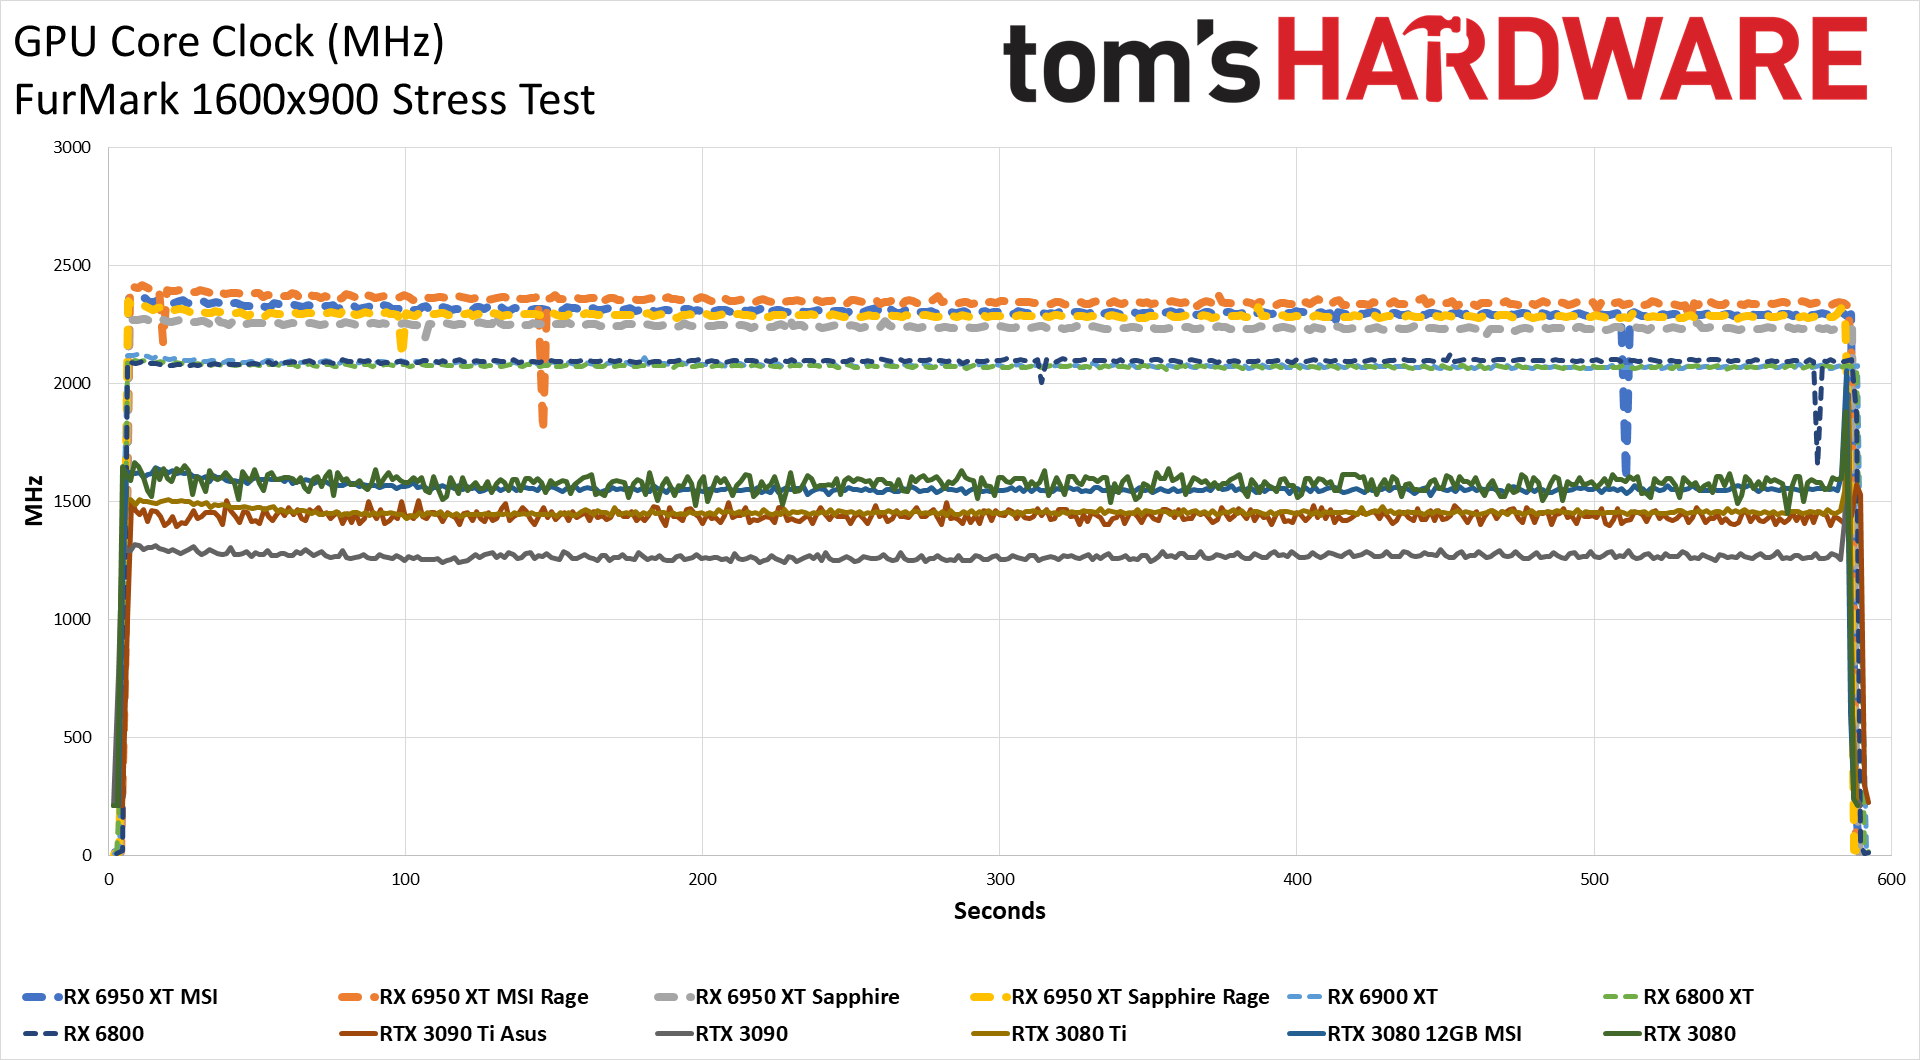
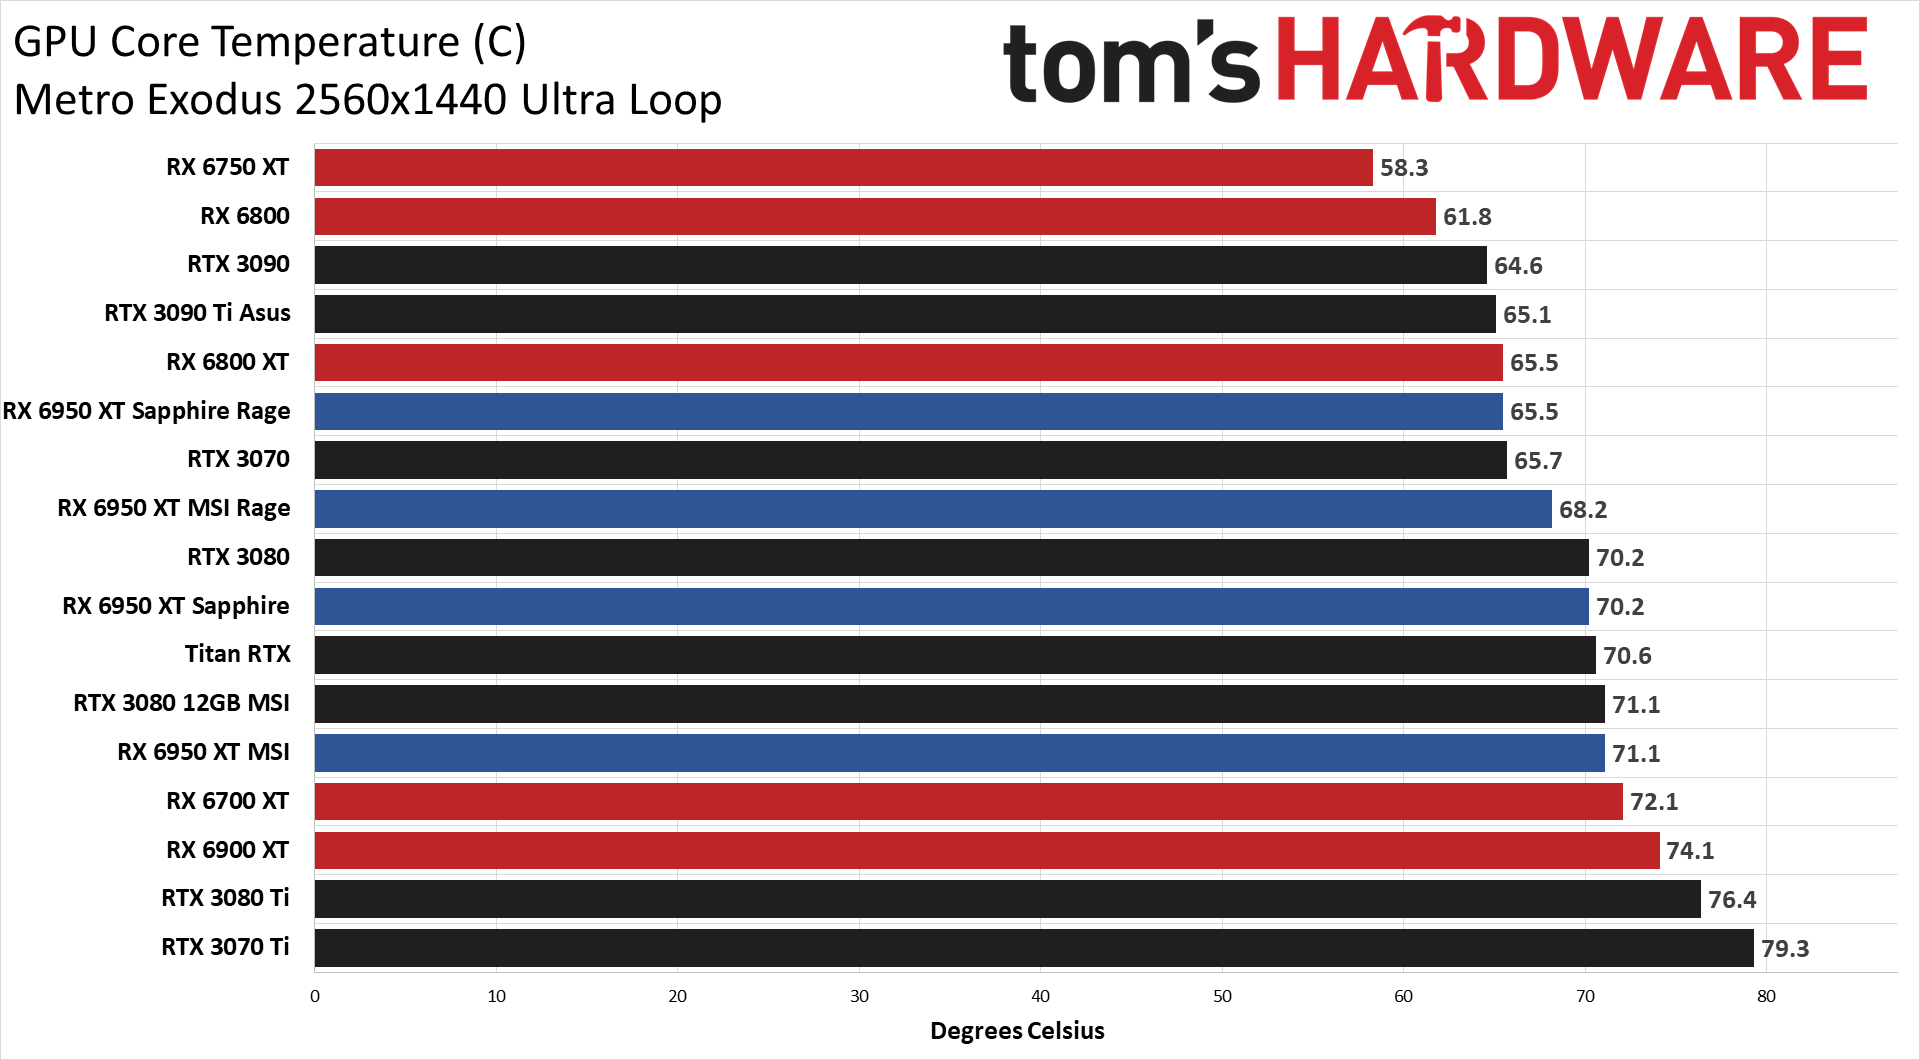
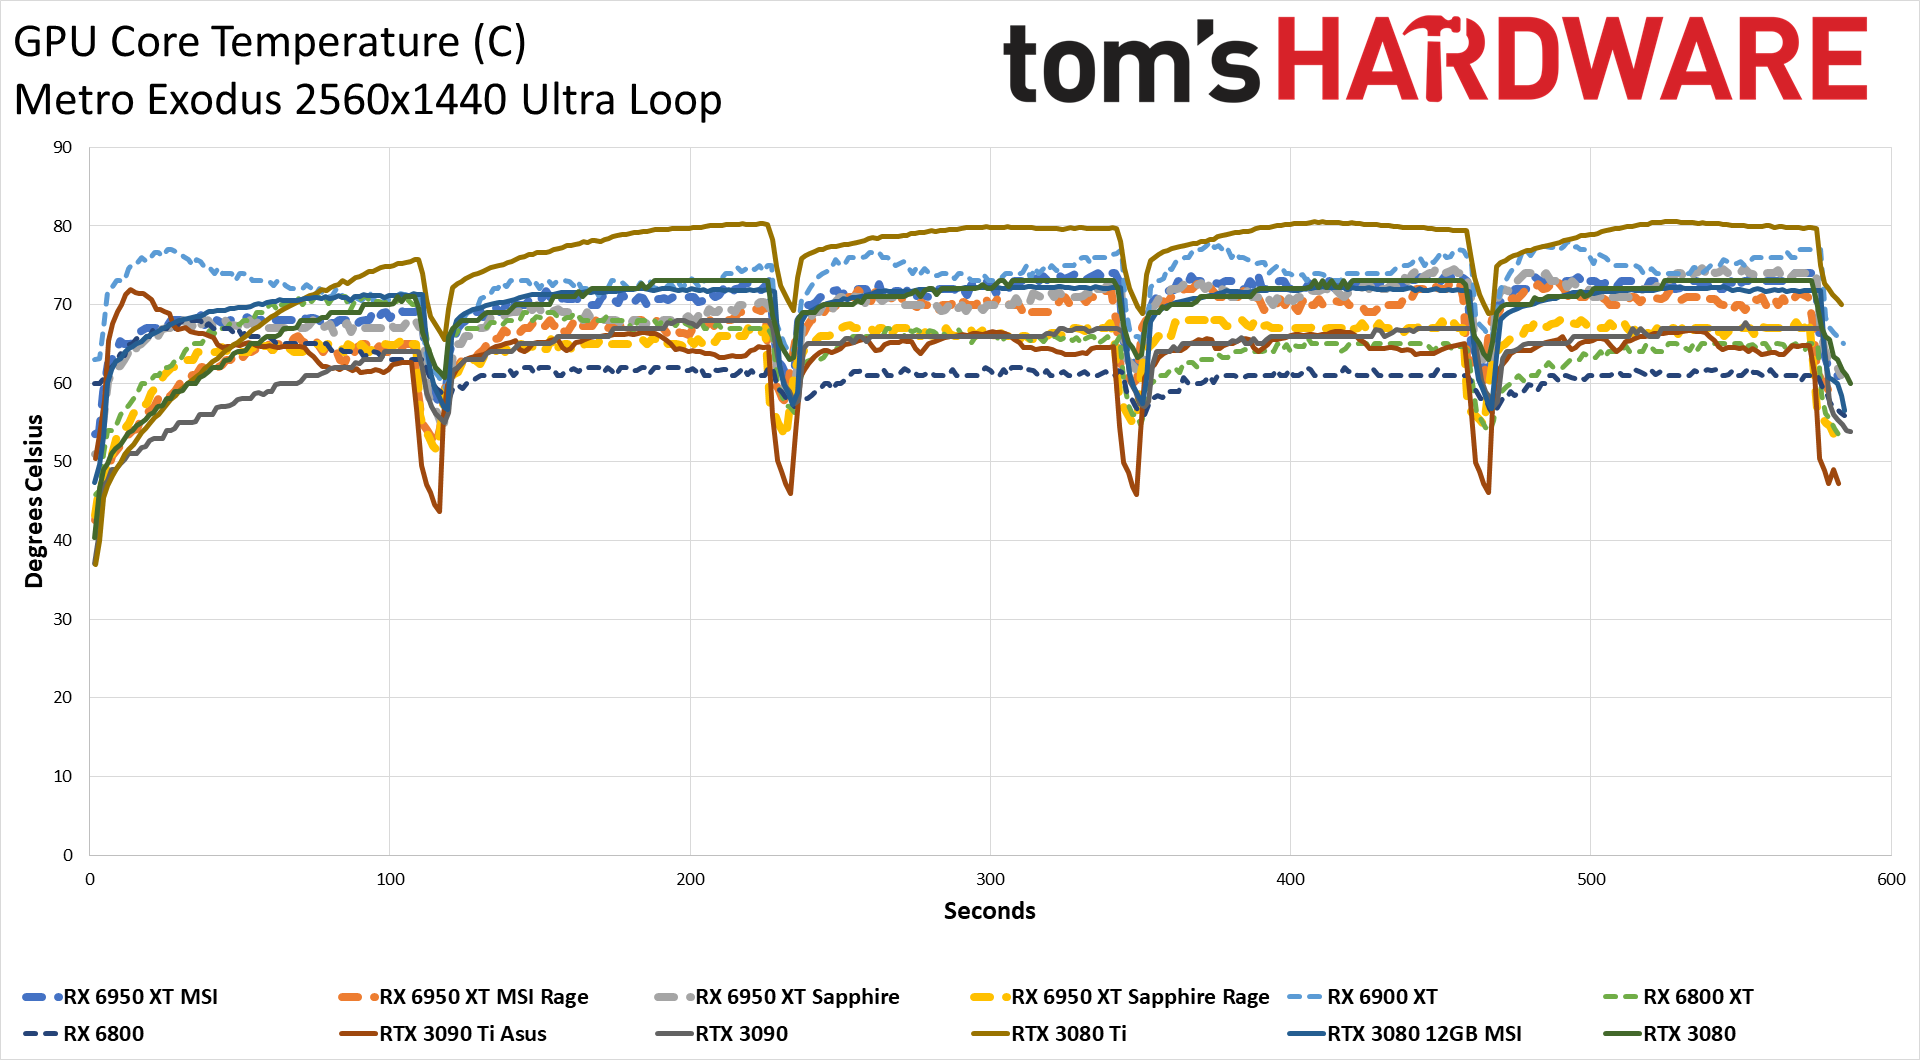
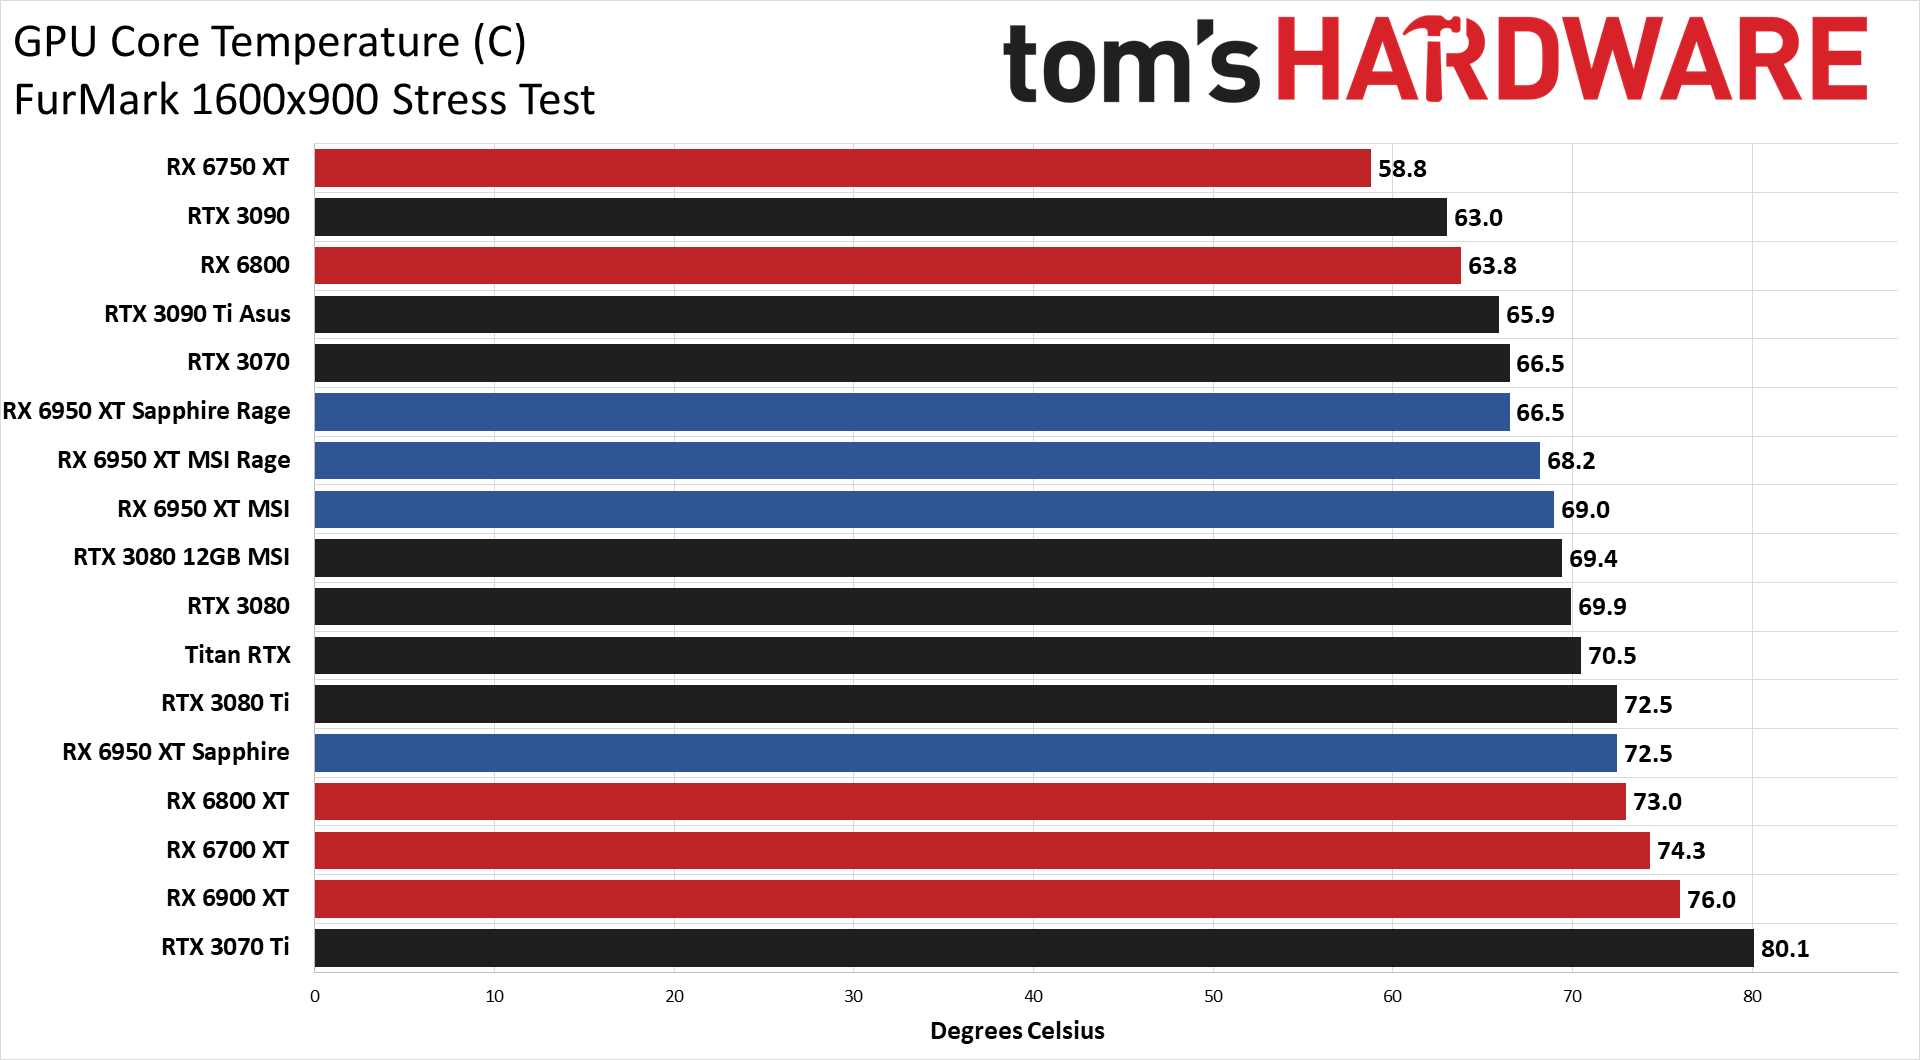
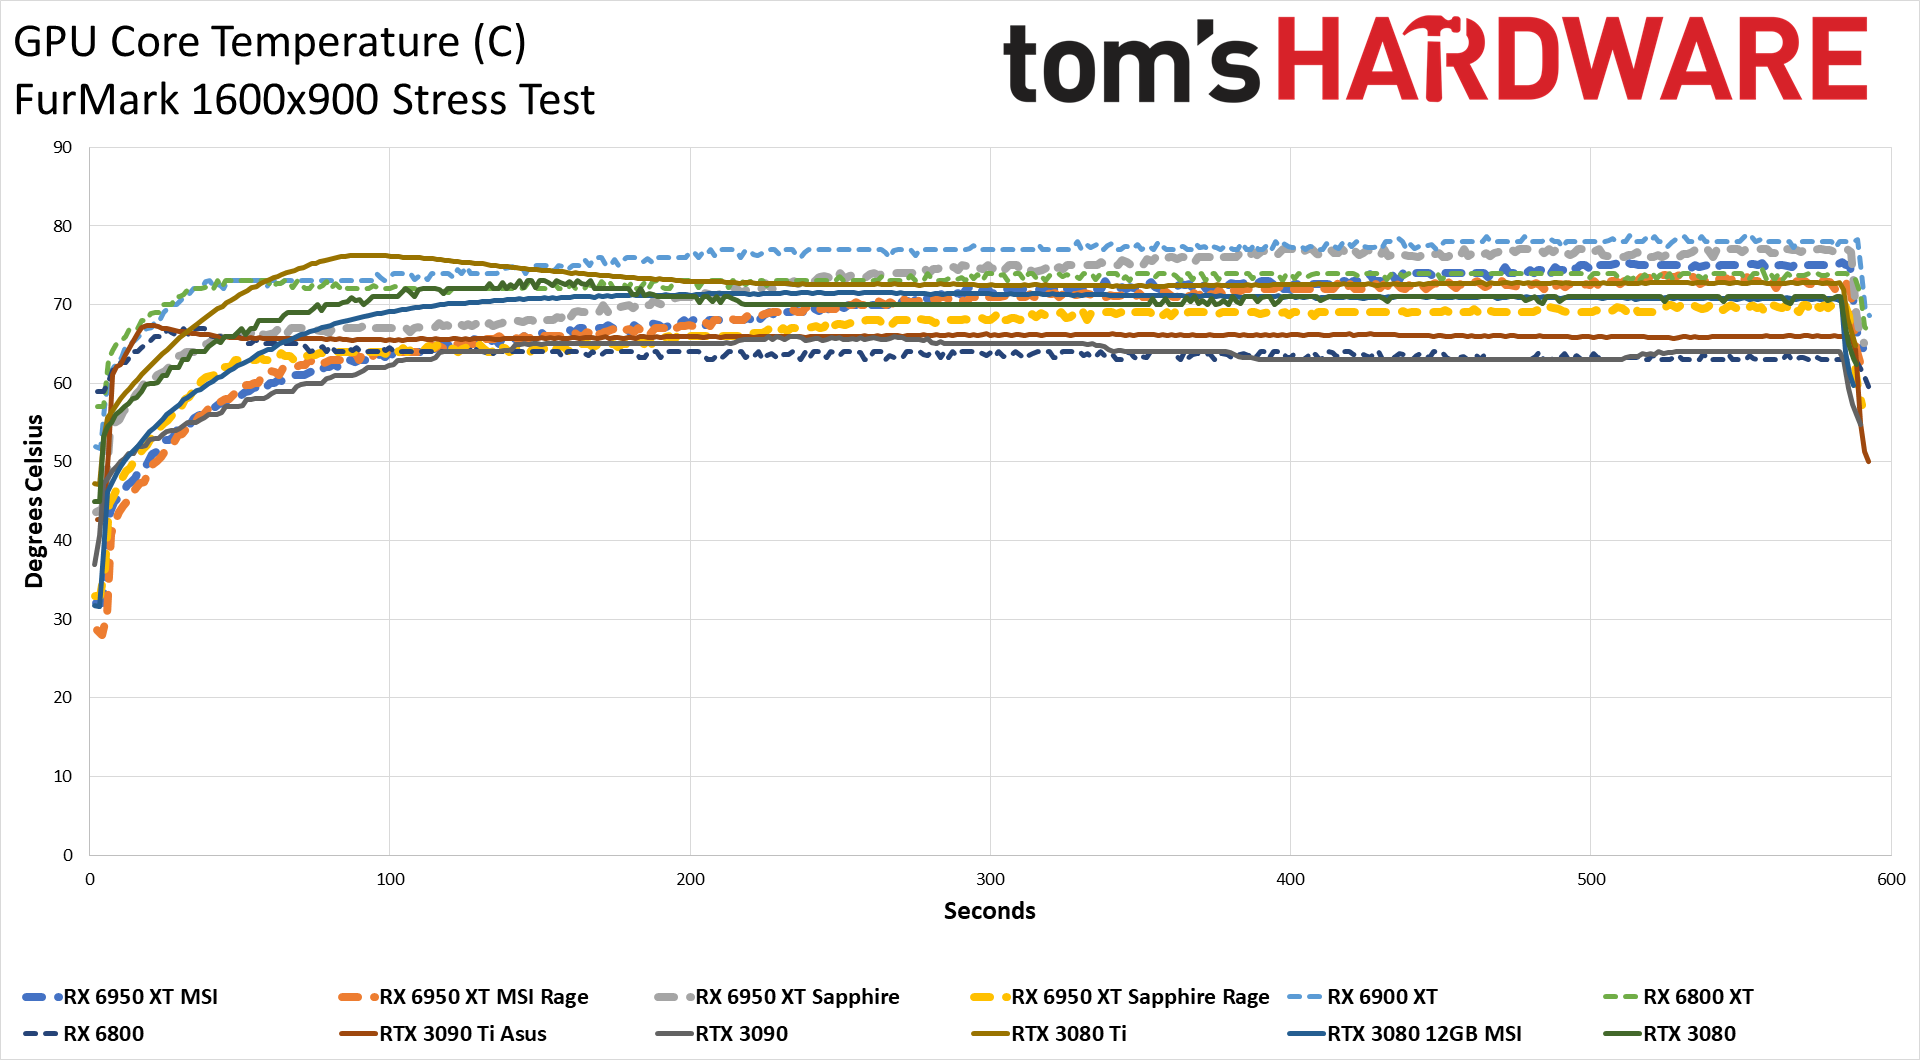
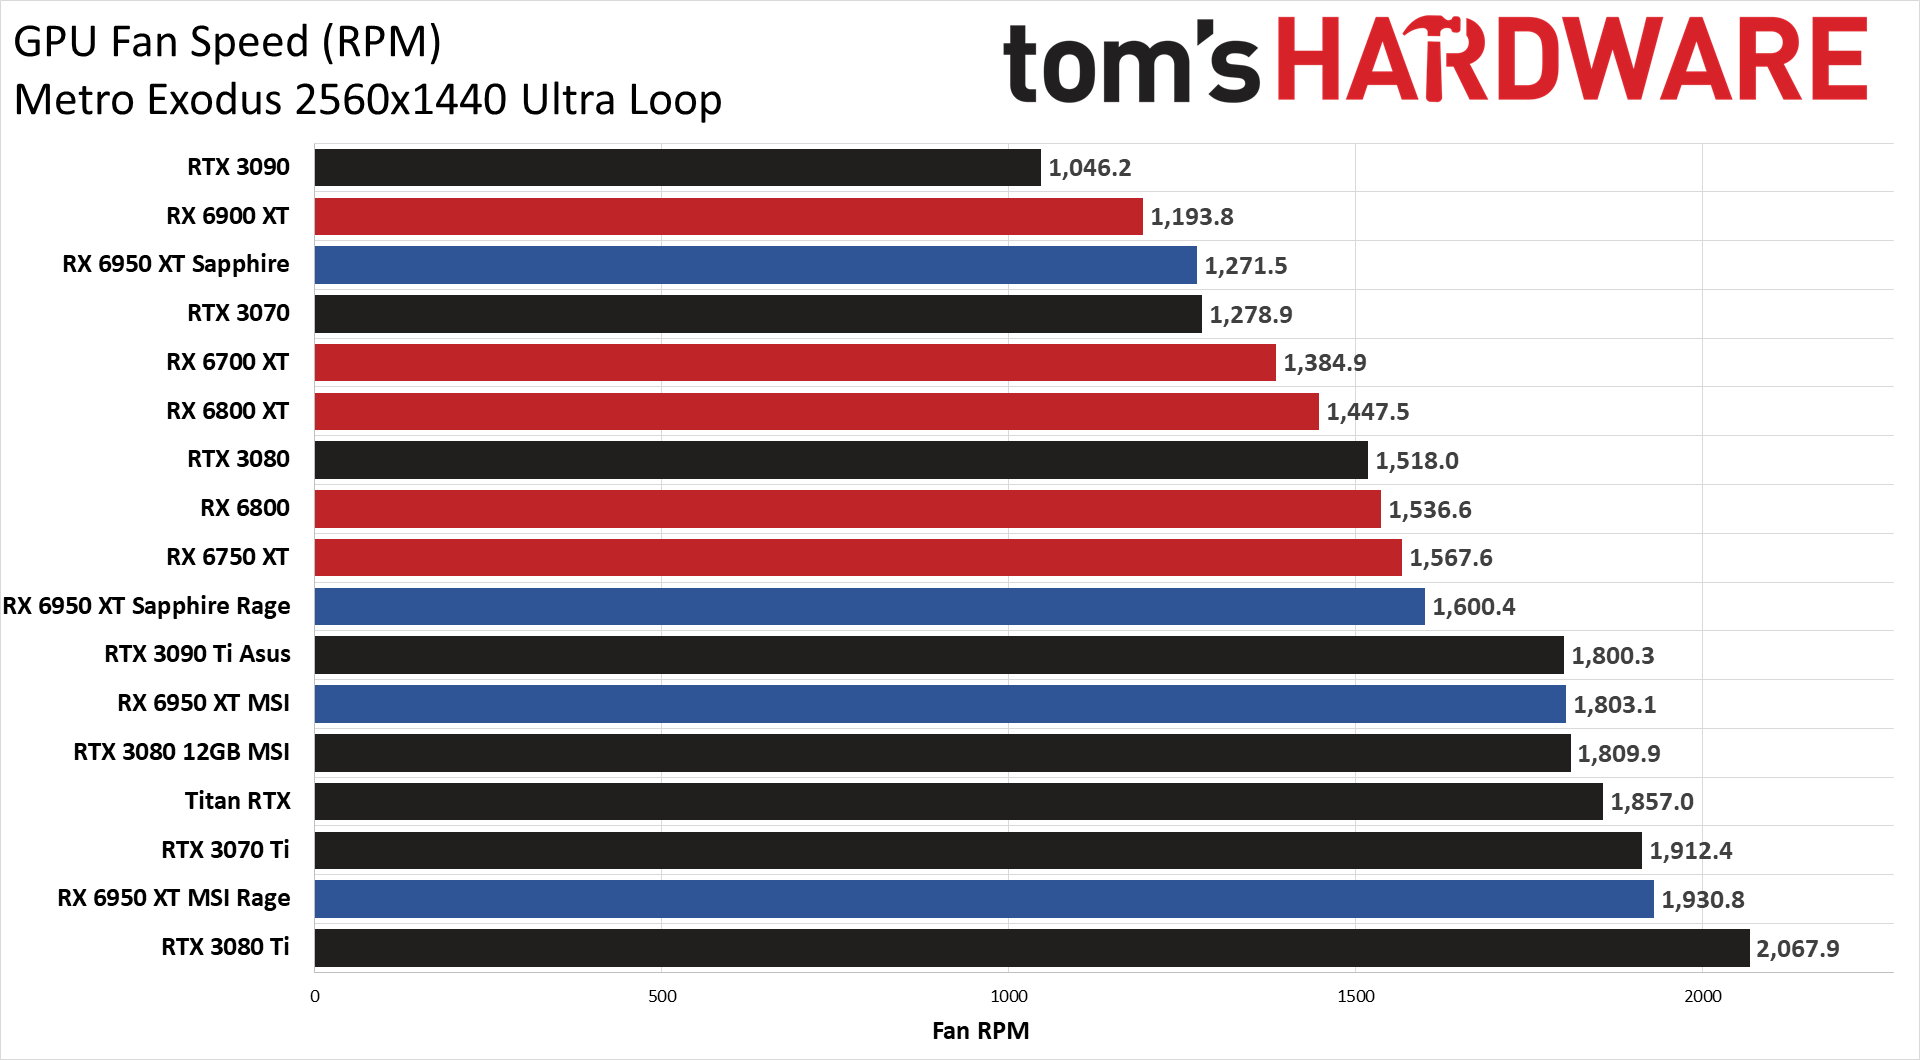
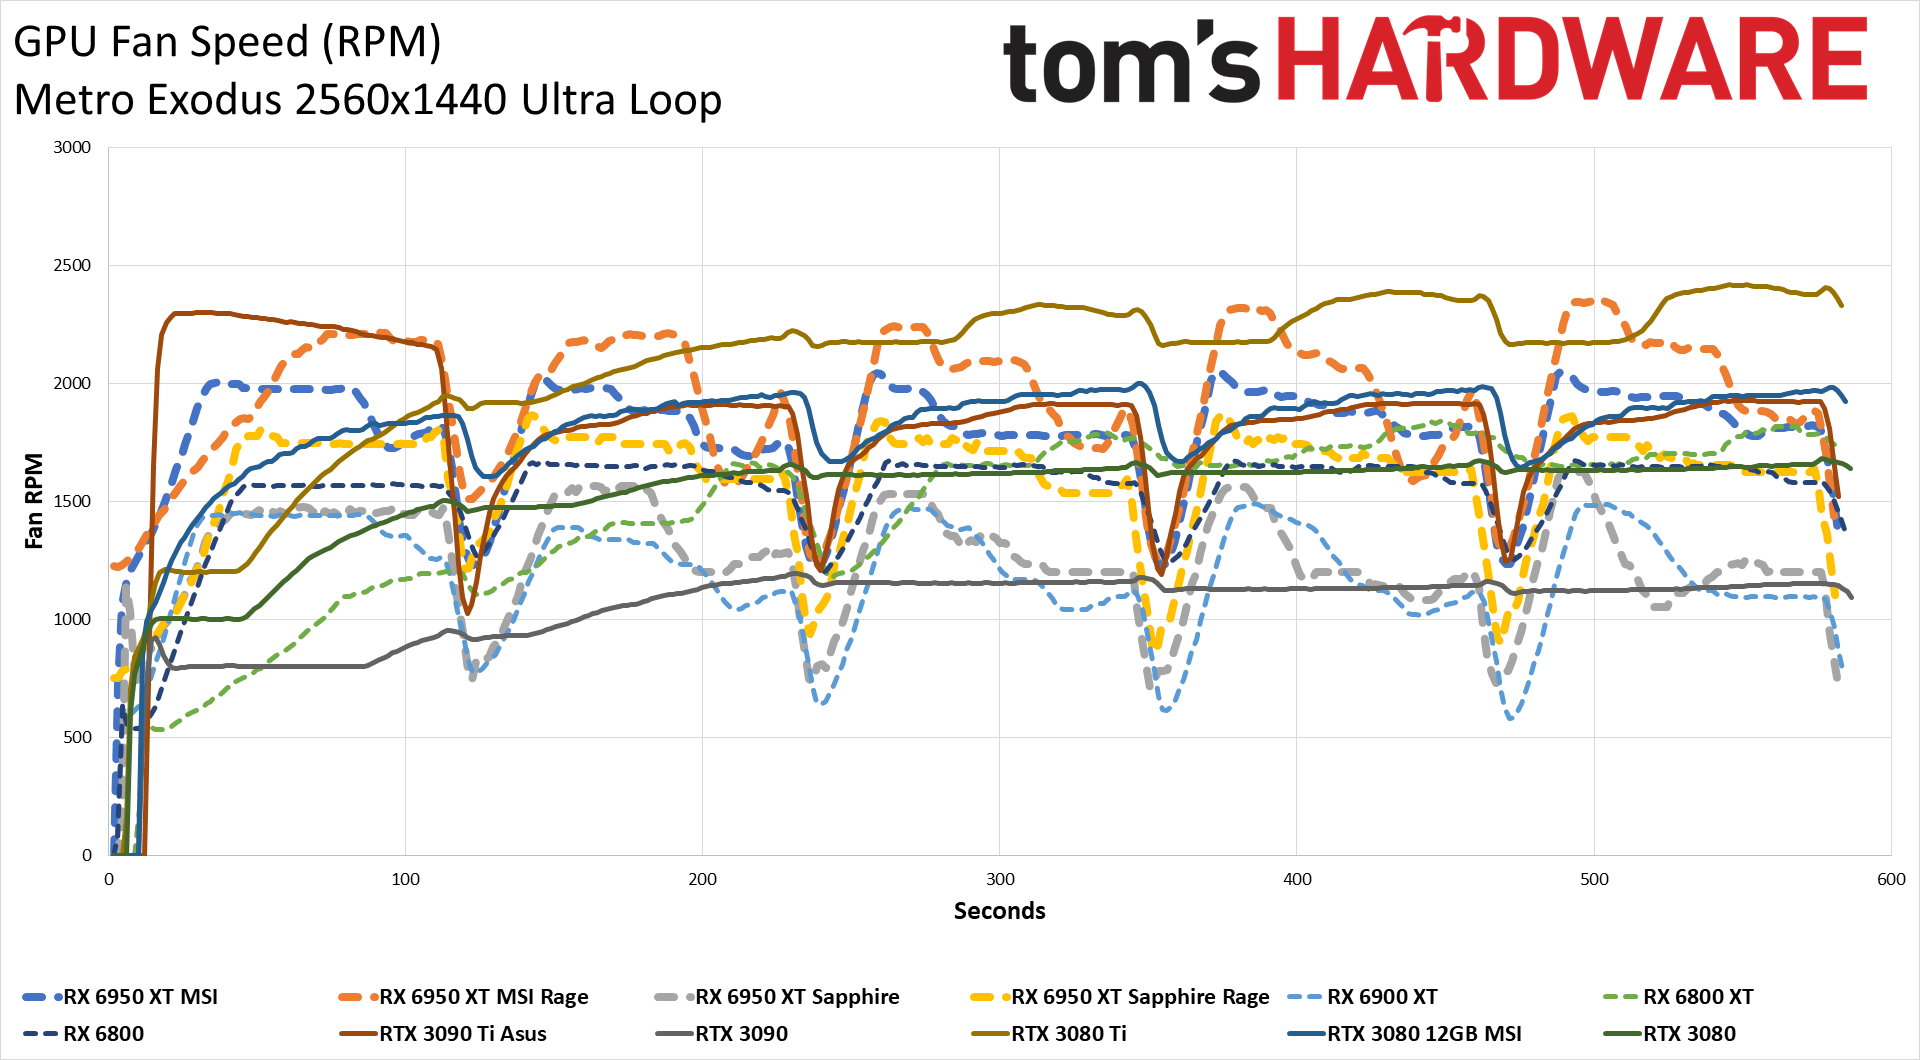
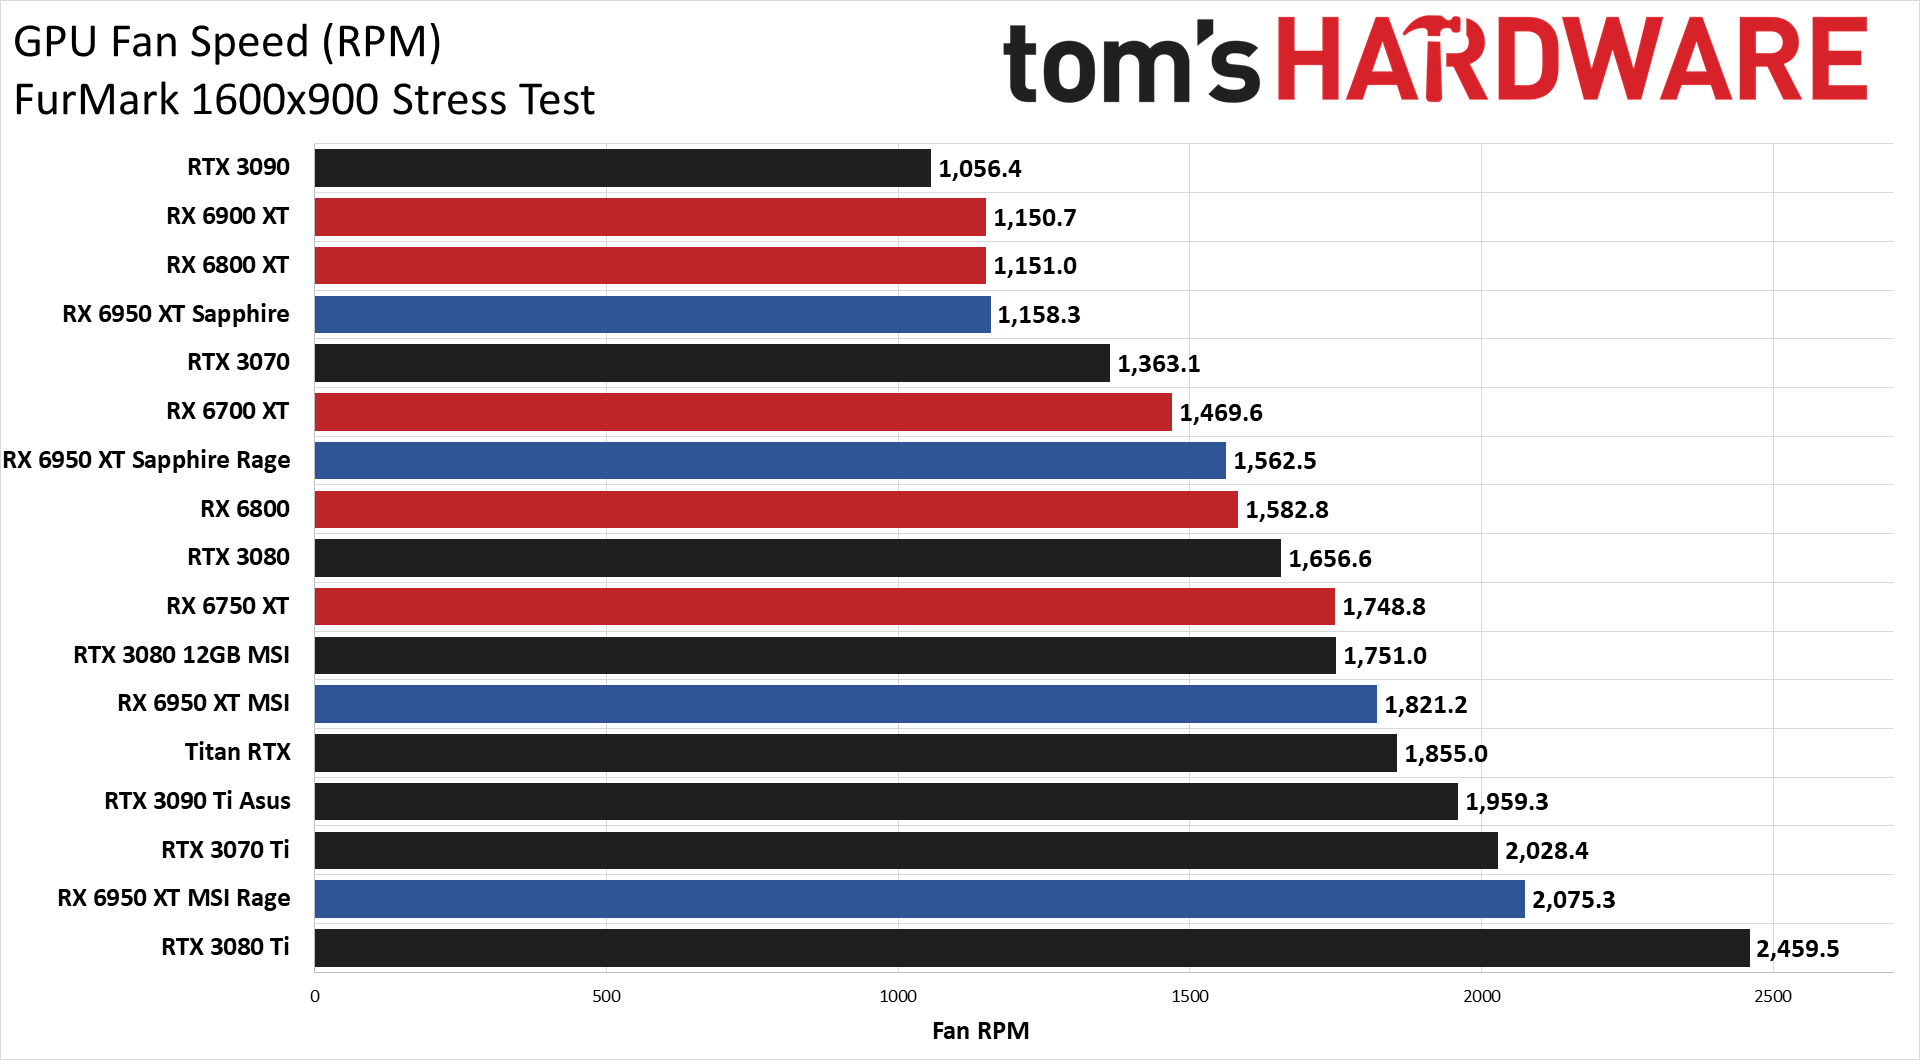
In theory, MSI lists 340W as the power draw for the RX 6950 XT Gaming X Trio. It labels that as "Power Consumption," but with our in-line power measurements, we saw far more than 340W. In Metro Exodus, we saw average peak power use of 429W, and FurMark showed even higher power use of 438W. We weren't running any MSI utilities or other software that would affect power use, so this represented the out of box experience. AMD's Rage mode gives a potential 10% increase in power limits, but here the MSI card only used 3% more power in Metro Exodus, though it did consume 6% more while running FurMark.
It's pretty obvious that MSI pushed power limits a lot higher than other GPUs with the Gaming X Trio, all in pursuit of the last few ounces of performance. As we showed in our gaming benchmarks, when using the same 22.5.1 drivers, things were so close between the MSI and Sapphire cards that it's hardly worth mentioning. We saw a range of up to 1.4% higher performance and up to 0.9% lower performance, and a lot of that is just the normal margin of error for testing GPUs, with an overall 0.2% difference on average.
Looking at the GPU clock speeds, you would expect more of an advantage for MSI, but without Rage mode the gap was still only 3%, and we didn't measure GPU clocks across our entire test suite. It's very likely that in many of the games, average GPU clocks were only 1% higher at most. With Rage mode, the difference in clock speed shrank to 2% in Metro Exodus. FurMark wasn't any different, showing about 3% higher GPU clocks for the MSI card with and without Rage mode, but again, MSI's card used up to 16% more power in FurMark, and 11–13% more power in Metro.
Temperatures were pretty similar across most of our extreme GPU test suite. The 3070 Ti and 3080 Ti (Founders Editions) ran a bit hotter, though custom AIC partner models tend to do a lot better, and the MSI card peaked at around 74C in our gaming tests, and up to 76C in FurMark. Rage mode bumped up fan speeds, so peak temperatures were 1C–3C lower than at stock for the MSI card.
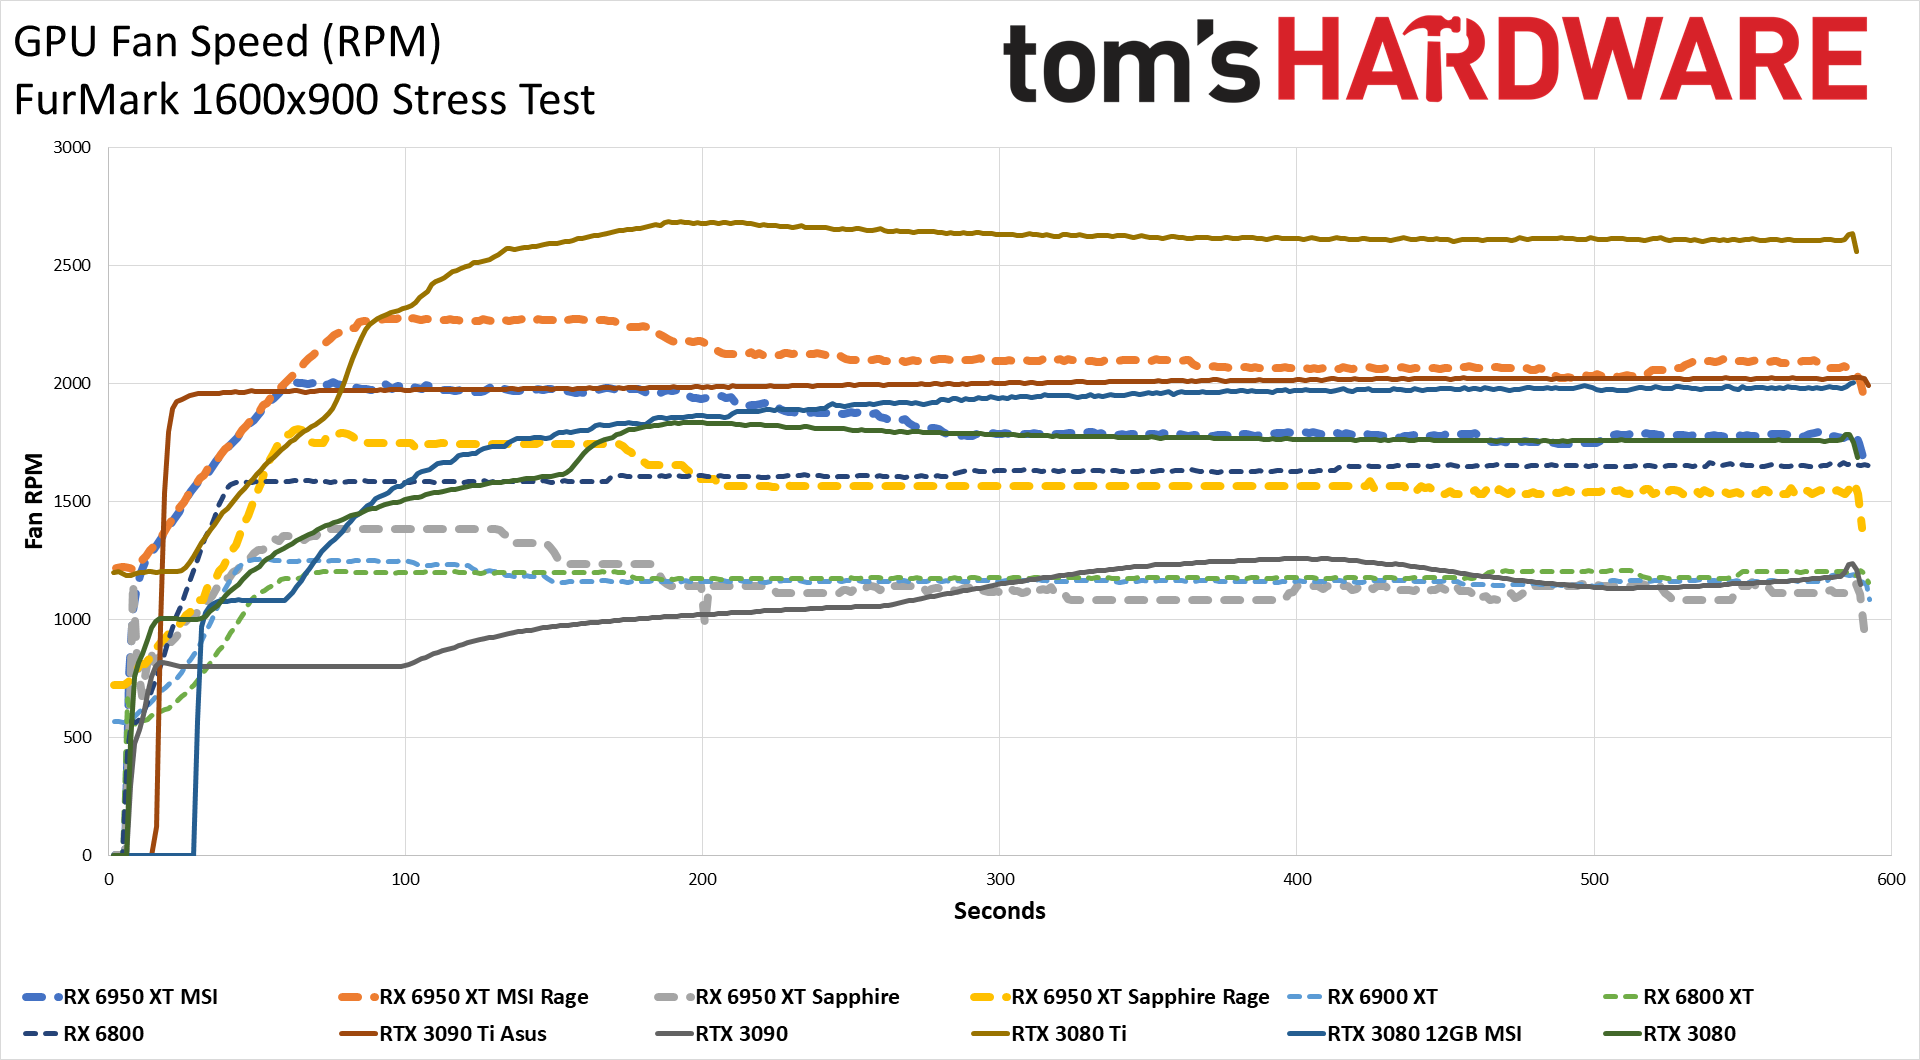
Due to its higher power use, it's no surprise that the MSI card needed higher fan speeds to stay cool. At stock, fans averaged 1800 RPM, which is higher than the Sapphire card in Rage mode for gaming. Somewhat curiously, fan speeds started higher with both the RX 6950 XT cards, and then dropped after a minute or so to lower values, almost like the cards were overcompensating for potential GPU heat than never fully arrived. We've seen a bit of that with some of the other RX 6000-series GPUs, like the reference 6900 XT, but the Nvidia GPUs tended to be a bit more consistent.
Checking noise levels, we used an SPL (sound pressure level) meter pointed at the center fan at a distance of 10cm, which is done to limit the impact of environmental noise. The ambient noise level in the room, running the test PC but with the GPU fans off (since there was no GPU load) was 32–33 dB(A). Under load, running Metro Exodus for over 30 minutes (not looping), fan speeds reached a stable 29% and we measured 42.1 dB(A) of noise. Enabling Rage mode caused the fans to always run, so ambient noise levels increased to 35.5 dB(A) and our gaming test hit 43.3 dB(A) with 32% fan speed. In both cases, the MSI card was about 5 dB louder than the Sapphire card.
We also tested with a static fan speed of 75%, which was far higher than anything we expect most people will ever encounter during normal use. The Gaming X Trio reached 58.5 dB(A) of noise, at a close distance, which is pretty similar to what we've seen with other high-end enthusiast cards.
- MORE: Best Graphics Cards
- MORE: GPU Benchmarks and Hierarchy
- MORE: All Graphics Content
Get Tom's Hardware's best news and in-depth reviews, straight to your inbox.
Current page: MSI Radeon RX 6950 XT: Power, Temps, Noise, Etc.
Prev Page MSI Radeon RX 6950 XT: 1080p Gaming Performance Next Page Bottom Line: MSI Radeon RX 6950 XT
Jarred Walton is a senior editor at Tom's Hardware focusing on everything GPU. He has been working as a tech journalist since 2004, writing for AnandTech, Maximum PC, and PC Gamer. From the first S3 Virge '3D decelerators' to today's GPUs, Jarred keeps up with all the latest graphics trends and is the one to ask about game performance.
-
-Fran- What a terrible model... The Sapphire is way way better, like always. MSI didn't even try to make this card decent; more like just fulfilling commitments or quotas.Reply
Also, I wonder if toying around with the VRAM speed would yield better results than the core in terms of extra FPS'es and specially power for the 6950XT. I have the 6900XT and I know for sure it does, but it's capped at ~2000, since it starts artifacting heavily above that speed for me. I run it stock, but I wanted to test the limit of it, heh.
Regards. -
King_V Editing nipick:Reply
We are not showing professional application performance with the MSI card, as it was basically the same story as we saw with our initial MSI RX 6950 XT content creation results.
That MSI that's linked should say Sapphire.
Still, given how little benefit pushing the extreme limits of power consumption gave to MSI, I'm really curious about how much, or rather, little, performance might be lost in backing down the power and clocks... I know nobody buys a top-of-the-line card in order to be power-efficient, but I wonder if we might have a situation here that is similar to the underclocking runs for the Vega 56. -
JarredWaltonGPU Reply
I poked around a bit at VRAM speeds when I was doing the Sapphire review. Ultimately, I didn't say much about it, but even though you can push clocks higher, I don't think you get the gains that I'd expect. There's something goofy with the VRAM speeds on these 18Gbps modules where you often don't get anywhere near the theoretical boost in performance relative to the existing 16Gbps cards. I suspect memory timings (which you can't directly see on the GDDR6) are somehow at play.-Fran- said:What a terrible model... The Sapphire is way way better, like always. MSI didn't even try to make this card decent; more like just fulfilling commitments or quotas.
Also, I wonder if toying around with the VRAM speed would yield better results than the core in terms of extra FPS'es and specially power for the 6950XT. I have the 6900XT and I know for sure it does, but it's capped at ~2000, since it starts artifacting heavily above that speed for me. I run it stock, but I wanted to test the limit of it, heh.
Regards.
For example, and I know this is a specific use case, but the cryptocurrency mining speed of the RX 6950 XT was consistently far lower than the RX 6900 XT, regardless of what I tried. You can get ~65 MH/s out of the RX 6900 XT after tuning, but the best I ever managed on the RX 6950 XT was about 54 MH/s. "Stock" (factory) performance with a tweak to the maximum GPU clock did better than any attempted memory overclock. -
-Fran- Reply
That is so weirdly interesting... I wonder if the higher clocks were at the expense of way way looser timings?JarredWaltonGPU said:I poked around a bit at VRAM speeds when I was doing the Sapphire review. Ultimately, I didn't say much about it, but even though you can push clocks higher, I don't think you get the gains that I'd expect. There's something goofy with the VRAM speeds on these 18Gbps modules where you often don't get anywhere near the theoretical boost in performance relative to the existing 16Gbps cards. I suspect memory timings (which you can't directly see on the GDDR6) are somehow at play.
For example, and I know this is a specific use case, but the cryptocurrency mining speed of the RX 6950 XT was consistently far lower than the RX 6900 XT, regardless of what I tried. You can get ~65 MH/s out of the RX 6900 XT after tuning, but the best I ever managed on the RX 6950 XT was about 54 MH/s. "Stock" (factory) performance with a tweak to the maximum GPU clock did better than any attempted memory overclock.
Regards. -
Sleepy_Hollowed Wow, what on earth is this card for? Expensive, inefficient space heater?Reply
Since even messing with voltages does not seem to make performance better, this is an absolute head scratcher, probably a spec-hunter card only.
That being said, other versions of this card will get some real usage with AMD's FSR 2.0 and it will make absolute sense even with zero tensor cores. Losing ~7 frames per second to nvidia is neglible at those resolutions and with comparable quality as well.
Let's see if next gen and DLSS 3.0 might be different, but DLSS 2.x is not.
