NEC PA272W 27-Inch Monitor Review: Accuracy And Flexibility
We’ve reviewed a lot of professional-class monitors, NEC's PA272W may be the most accurate and capable one ever to hit the Tom's Hardware lab. At almost $1300, it’s expensive for a 27-inch QHD screen. But there are features here you won’t find elsewhere.
Results: Brightness And Contrast
Uncalibrated
Before calibrating any panel, we measure zero and 100-percent signals at both ends of the brightness control range. This shows us how contrast is affected at the extremes of a monitor's luminance capability. We do not increase the contrast control past the clipping point. While doing this would increase a monitor’s light output, the brightest signal levels would not be visible, resulting in crushed highlight detail. Our numbers show the maximum light level possible with no clipping of the signal.
We always take our initial luminance measurements in the display’s stock configuration. For the PA272W, that means uniformity compensation is turned on. You’ll see later on how this affects the black level more than the white.
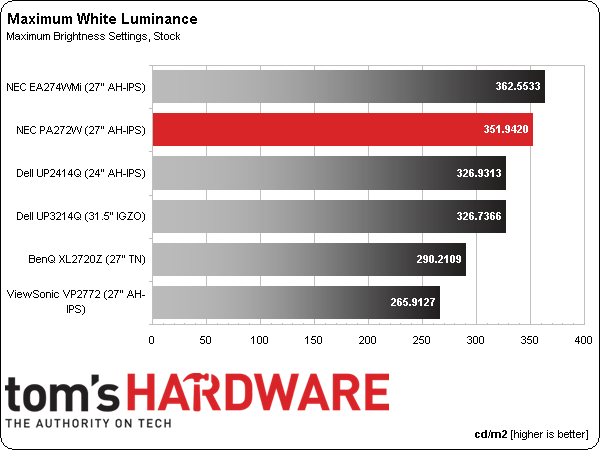
NEC specifies the PA272W at 340 cd/m2 maximum, and we beat that number by using the High Bright mode, a preset that is fully adjustable. Maxing the backlight in Adobe RGB or sRGB modes yields a peak brightness reading of around 300 cd/m2. You wouldn’t need that much output unless you used the monitor outdoors, on-location at a photo shoot, for example.
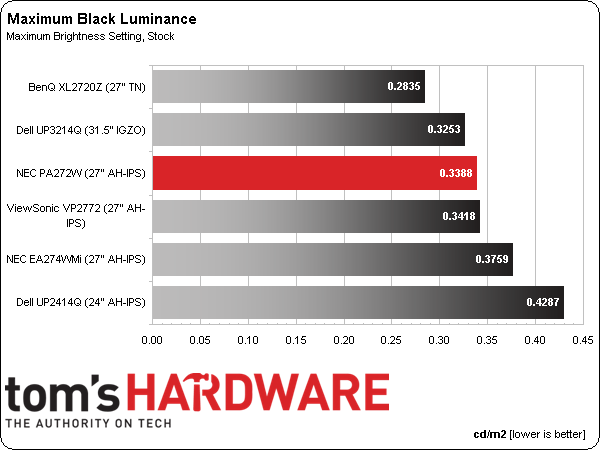
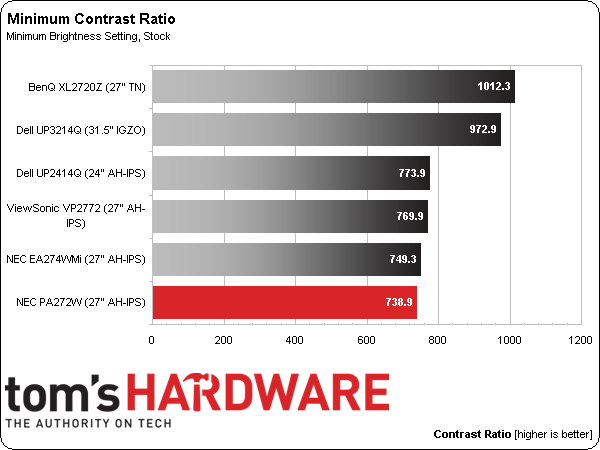
A measurement of .3388 cd/m2 is very respectable. It can be improved upon slightly by reducing or turning off the uniformity compensation.
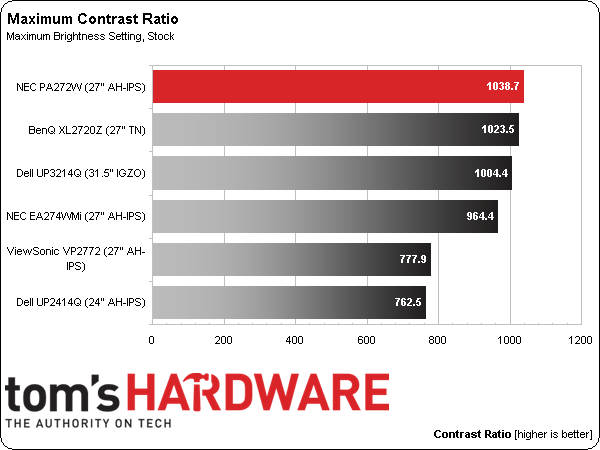
The PA272W beats all other recent review subjects for max contrast. We still look to TN screens for the highest possible ratio, but IPS monitors at all price points are catching up, as these results show.
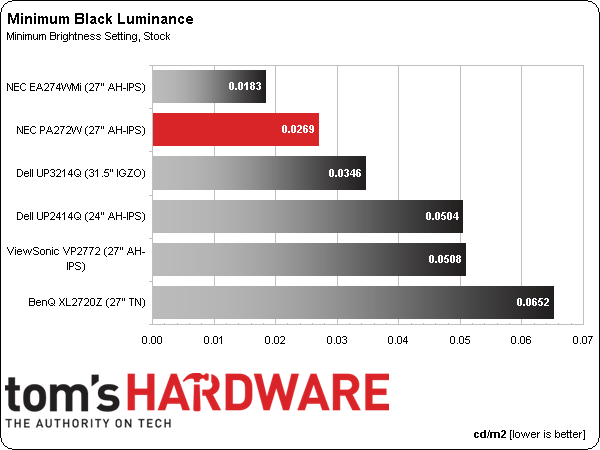
We believe 50 cd/m2 is a practical minimum standard for screen brightness. Any lower and you risk eyestrain and fatigue. The PA272W bottoms out at an extremely dim 19.8644 cd/m2. You’d have a hard time using any display at such a low light level, even in a completely dark room.
Since the brightness slider is ticked in cd/m2 values (which, by our measurements, proved to be pretty accurate), if you want 50 cd/m2, set brightness to that number and you’ll be within one or two candelas.
Get Tom's Hardware's best news and in-depth reviews, straight to your inbox.
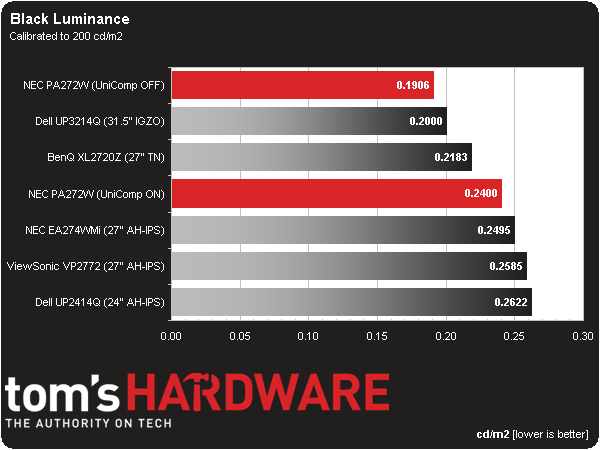
The NEC finishes second here, and sixth out of all of the monitors in our database. Our reading is quite low, and it only rises a tiny bit if you set the brightness to 50 cd/m2. The PA272W’s black levels are excellent, and even better when you turn the uniformity compensation off.
The minimum contrast value is pulled down by a low max white result. When used at more realistic light levels, the PA272W consistently delivers contrast closer to 1000 to 1.
After Calibration
Since we consider 200 cd/m2 to be an ideal point for peak output, we calibrate all of our test monitors to that value. In a room with some ambient light (like an office), this brightness level provides a sharp, punchy image with maximum detail and minimum eye fatigue. On many monitors it’s also the sweet spot for gamma and grayscale tracking, which we'll look at on the next page. In a darkened room, some professionals prefer a 120 cd/m2 calibration. We find it makes little to no difference on the calibrated black level and contrast measurements.
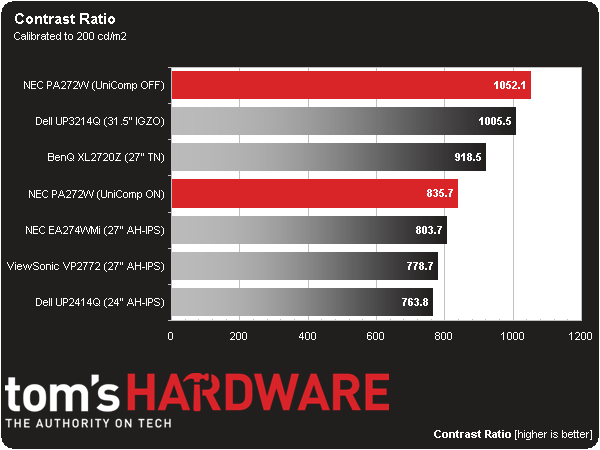
Right away you can see how the uniformity compensation feature affects black levels and overall contrast. It does make a measureable difference in screen uniformity, but ultimately you’ll have to decide which metric is of greater importance.
Personally, I prefer using the PA272W without uniformity compensation. Our measurements demonstrate excellent uniformity in the monitor’s native state, so I didn't feel it was necessary. Other users may disagree. Either way, black levels are very good.
Remember that there are five levels of uniformity compensation, so you can tweak around to find a happy medium between contrast and screen uniformity. We’re perfectly content to leave it off and enjoy above-average contrast performance.
ANSI Contrast Ratio
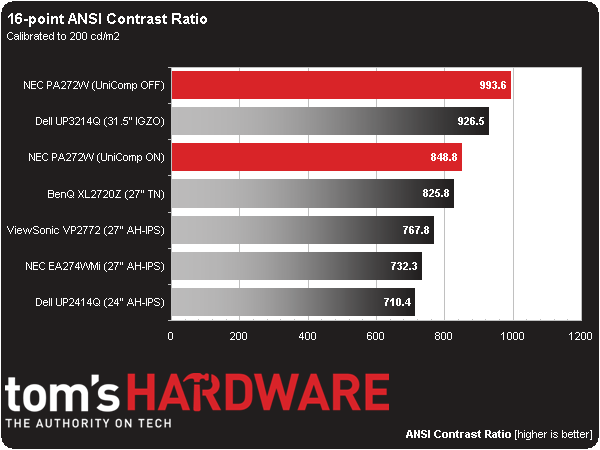
Another important measure of contrast is ANSI. To perform this test, a checkerboard pattern of sixteen zero and 100-percent squares is measured. The test is somewhat more real-world than on/off measurements because it gauges a display’s ability to simultaneously maintain both low black and full white levels, and factors in screen uniformity. The average of the eight full-white measurements is divided by the average of the eight full-black measurements to arrive at the ANSI result.
Both outcomes are among the best ANSI measurements we’ve recorded. The difference between uniformity compensation settings is only about 14 percent. The PA272W is an extremely well-engineered monitor built to a high quality-control standard. While its price tag may be high, you won’t find this level of precision in a less expensive display.
Current page: Results: Brightness And Contrast
Prev Page Measurement And Calibration Methodology: How We Test Next Page Results: Grayscale Tracking And Gamma Response
Christian Eberle is a Contributing Editor for Tom's Hardware US. He's a veteran reviewer of A/V equipment, specializing in monitors. Christian began his obsession with tech when he built his first PC in 1991, a 286 running DOS 3.0 at a blazing 12MHz. In 2006, he undertook training from the Imaging Science Foundation in video calibration and testing and thus started a passion for precise imaging that persists to this day. He is also a professional musician with a degree from the New England Conservatory as a classical bassoonist which he used to good effect as a performer with the West Point Army Band from 1987 to 2013. He enjoys watching movies and listening to high-end audio in his custom-built home theater and can be seen riding trails near his home on a race-ready ICE VTX recumbent trike. Christian enjoys the endless summer in Florida where he lives with his wife and Chihuahua and plays with orchestras around the state.
-
SuckRaven Every time Tom's Hardware reviews monitors, I keep posting in the comments that they should review NEC and EIZO for accuracy in comparison to the usual suspects. Finally my prayers have been answered. (Not that there are not other places that have not already done a good job of including reviews of high-end monitors with color accuracy, and uniformity as the main focus), but Tom's has always been a preferred resource. Anyways, you guys should do a shootout with the top flagships from HP, Dell, NEC and and EIZO, perhaps the CG277). Nice review.Reply -
Pikker I've recently purchased this monitor with calibration tools and hood for a discounted price, needless to say it looks incredible, putting to shame an older 27" IPS display that I had.Reply
Regarding the NEC 272 vs. Eizo 277, I think they are more same than different... the Eizo has an integrated calibrator, 16-bit LUT, bigger color space, and a bunch of other tweaks that should objectively make it a better display, but not ~$1000 better IMO. If you have that kinda money to burn, get two PA272W's instead. -
ubercake Good review.Reply
I think everyone should notice the low-cost IPS monitors offer sub-par contrast. Who cares about color accuracy if you can't see the in-betweens? Aren't the shades/hues just as important? This is something people don't realize when they pick up that $400 IPS display. Heck, contrast is better on the BenQ TN display than on the less expensive IPS displays in the review. Color without good contrast is a waste. Contrast is what you compromise at the lower end of the IPS monitor scale.
You have to spend money to get a quality IPS monitor. It's good to see that you can get this kind of performance at a lower price point now.
This NEC monitor is definitely impressive. It has great color accuracy AND contrast. Great for photography and graphic arts/design applications. This is a pro monitor and why you spend money on an IPS monitor. -
ceberle Reply13488868 said:Every time Tom's Hardware reviews monitors, I keep posting in the comments that they should review NEC and EIZO for accuracy in comparison to the usual suspects. Finally my prayers have been answered. (Not that there are not other places that have not already done a good job of including reviews of high-end monitors with color accuracy, and uniformity as the main focus), but Tom's has always been a preferred resource. Anyways, you guys should do a shootout with the top flagships from HP, Dell, NEC and and EIZO, perhaps the CG277). Nice review.
Look for a review of the HP Z27x in a few weeks. It's in our lab now.
-Christian- -
PapaCrazy Bought one of these and ended up with a display that had several dead pixels and a couple hot pixels. Exchanged it, got a display with even more deal pixels, I stopped counting in the teens. For $1400, seems offensive. Dell was offering a zero dead pixel guarantee for half the price with the u2711. Calibrated, it seems to do quite well in color accuracy, I never get complaints after file deliveries, but the Dell is made like a piece of shit. Has a major heating problem which effects the top (where the heat collects) of the display's color output after intensive usage. I'm sick of this over-inflated display market. They are either under-engineered or overpriced.Reply -
Pikker ReplyBought one of these and ended up with a display that had several dead pixels and a couple hot pixels. Exchanged it, got a display with even more deal pixels, I stopped counting in the teens. For $1400, seems offensive.
That's some bad luck... I got mine from B&H and the display was perfect out of the box. Otherwise, the thing is built like a tank with an all-metal frame under the plastic outer shell, and it doesn't flex no matter what, if anything, I'd say it's over-engineered. -
PapaCrazy Reply13514585 said:Bought one of these and ended up with a display that had several dead pixels and a couple hot pixels. Exchanged it, got a display with even more deal pixels, I stopped counting in the teens. For $1400, seems offensive.
That's some bad luck... I got mine from B&H and the display was perfect out of the box. Otherwise, the thing is built like a tank with an all-metal frame under the plastic outer shell, and it doesn't flex no matter what, if anything, I'd say it's over-engineered.
Got mine from B&H too. NEC released an upgraded model w/ improved colorimeter shortly after my purchase. It could very well have been an accumulation of old stock, the backwash of sorts, that I drank from. When studying up, I found the only way to get a guarantee of zero dead pixels on NEC displays, you need to pony up for the ultra-expensive medical grade displays. It is well made though, I thought the portrait mode was a great feature and the stand was far more solid than the Dell's. Ran cooler as well. (thermally I mean)
