System Builder Marathon: TH's $2000 Hand-Picked Build
Benchmark Results: 3DMark And PCMark
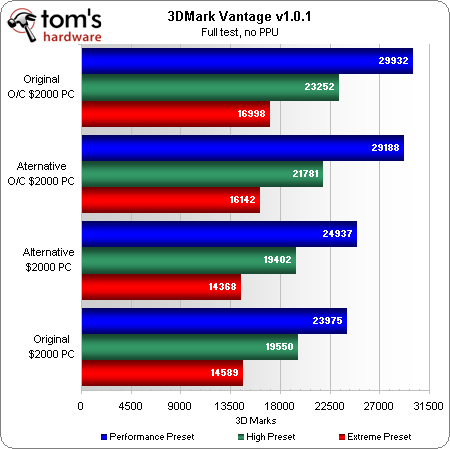
We didn’t intend to gimp the new, AMD graphics system with a lower CPU overclock, but this type of variability is usually part of the experience. For 3DMark, we suggest those seeking a card-to-card comparison consider the non-overclocked results.
The biggest problem with 3DMark Vantage’s default settings was that the benchmark’s PhysX tests rewarded huge CPU score improvements to systems that contained Nvidia graphics. Disabling the benchmark’s PPU (PhysX Processing Unit) tests allows the alternative build’s CrossFire configuration to conquer the original build’s SLI, though the results are not always mirrored by games. 3DMark11 rectifies this situation, and we're looking into adding that app to the suite as well.
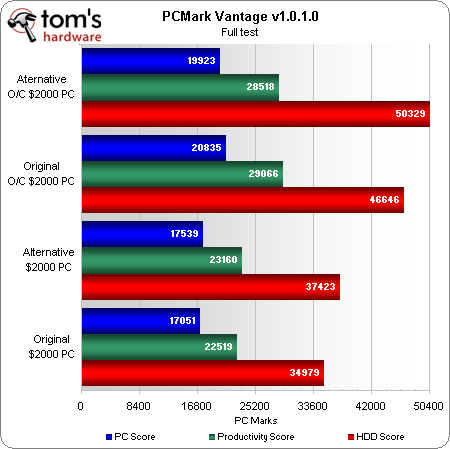
Using the same controller, drives, and controller drivers as the original system, the new alternative build still takes the lead in PC Mark’s HDD test. This could be due to memory improvements, since the drive’s files are most likely cached to RAM. A better CPU overclock pushes the original build’s overall score into the lead, however.
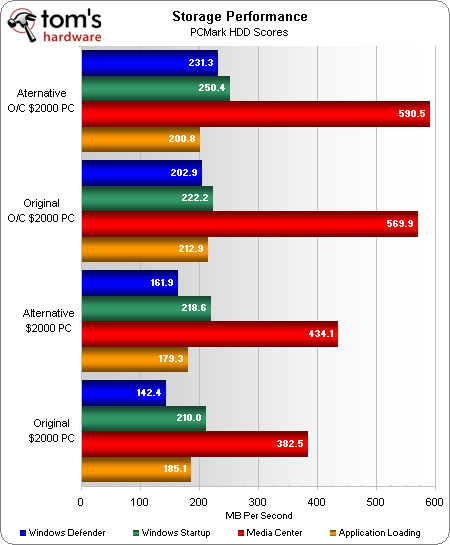
A quick look at some of the detailed hard drive benchmark results shows specifically where the alternative build scored in this metric.
Current page: Benchmark Results: 3DMark And PCMark
Prev Page Test Settings Next Page Benchmark Results: SiSoftware SandraGet Tom's Hardware's best news and in-depth reviews, straight to your inbox.
-
dogman_1234 Can't Wait untill Bulldozer and Sandy Brodge Editions come out. I know it sounds cliche but...Reply -
A price table for the new build would be nice too, so i can see how much would it cost when i remove the BD and Case.Reply
-
gti88 Tamz_mscThis is probably the best way of spending 2000$ for a PC.I don't think so, considering that cheaper and less power-hungry Sandy Bridge is coming.Reply -
scook9 gti88I don't think so, considering that cheaper and less power-hungry Sandy Bridge is coming.You forgot weaker ;)Reply -
scrumworks Decent review but it seems that in nvidia setups, even the same CPUs can somehow overclock better. And the speed of RAM has negligible or no effect on overall system performance so no point tuning that component.Reply -
Luay "Familiarity in overclocking and a third PCIe x16 graphics card slot that operates in x8 mode when occupied are two reasons why we chose the X58A-UD3R over the similarly-priced Asus Sabertooth X58."Reply
Ok, fine. Wouldn't hurt to familiarize anew with a better board and that 3rd slot wasn't used anyways. Megahalems over Noctua? Seasonic over Corsair AX? :(
Or was it last minute budget cuts to make it less than $2000? -
nerrawg scrumworksDecent review but it seems that in nvidia setups, even the same CPUs can somehow overclock better. And the speed of RAM has negligible or no effect on overall system performance so no point tuning that component.Reply
What do you mean, this was the same model processor but not the same one. They got a new one for this build - so how does that show that the graphics have anything to do with the overclock? If anything it says exactly what is stated in the article, that the overclockability of the i7 950 varies between each sample quite a margin.
NVidia or for that matter AMD graphics have no effect on the CPU overclock.
-
-Fran- How does a Core i5 @~4.3Ghz or a Phenom II X6 @~4Ghz stack up against the Core i7? Well, that's using the same other components, 'cept RAM and MoBo :PReply
I'd like to know that.
Cheers!


