Tom's Hardware Verdict
The GeForce RTX 2080 Super is faster than the GeForce RTX 2080 it replaces, and Nvidia’s own implementation costs $100 less than the old Founders Edition model. As a result, the Super model offers substantially better performance per dollar. Just be ready to pay a still-expensive $700 and cope with warmer temperatures.
Pros
- +
Faster than the overclocked GeForce RTX 2080 Founders Edition
- +
$100 less expensive than GeForce RTX 2080 Founders Edition
- +
Benefits from Nvidia’s high build quality
- +
Still quiet, despite increased power consumption
Cons
- -
Even at its lower price, this card is priced at a premium
- -
The same cooler means more heat and faster fans
- -
Axial fan design blows waste heat back into your chassis
Why you can trust Tom's Hardware
Meet Nvidia's GeForce RTX 2080 Super 8GB
The GeForce RTX 2080 that launched last September was unquestionably fast. But it wasn’t much quicker than the GeForce GTX 1080 Ti. More problematic, the Founders Edition model sold for $800, meaning you paid an extra $100 for its slight performance advantage over Nvidia’s previous-gen flagship.
The $699 GeForce RTX 2080 Super tips the scales back in favor of gamers with high-refresh QHD monitors and 4K displays by serving up average frame rates that are 6% higher than GeForce RTX 2080 (and 17% better than GTX 1080 Ti) at a price point that is $100 less expensive than the old 2080 Founders Edition card. It also offers performance that is far ahead of AMD's new Navi-powered Radeon 5700XT, but that's not surprising given that Nvidia's card costs 75% more.
It’s not going to make anyone with a high-end graphics card want to upgrade. But if you were waiting for a refresh to get your hands on better value than what the first round of Turing-based cards offered, know that GeForce RTX 2080 Super gives you 21% better performance per dollar than GeForce RTX 2080 Founders Edition (or a scant 6% improvement over the least expensive 2080s).
Editor's Note: An earlier version of this review carried the headline "Leaving Navi in the Dust." We've revised the title to better reflect the content of the article, which primarily compares RTX 2080 Super to other cards in its price range.
Meet GeForce RTX 2080 Super
Even more so than GeForce RTX 2060 Super and 2070 Super, the 2080 Super looks very, very similar to its predecessor. Nvidia now has ample supply of flawless TU104 processors that it can use to build GeForce RTX 2080 Super without disabling any of its on-die resources.
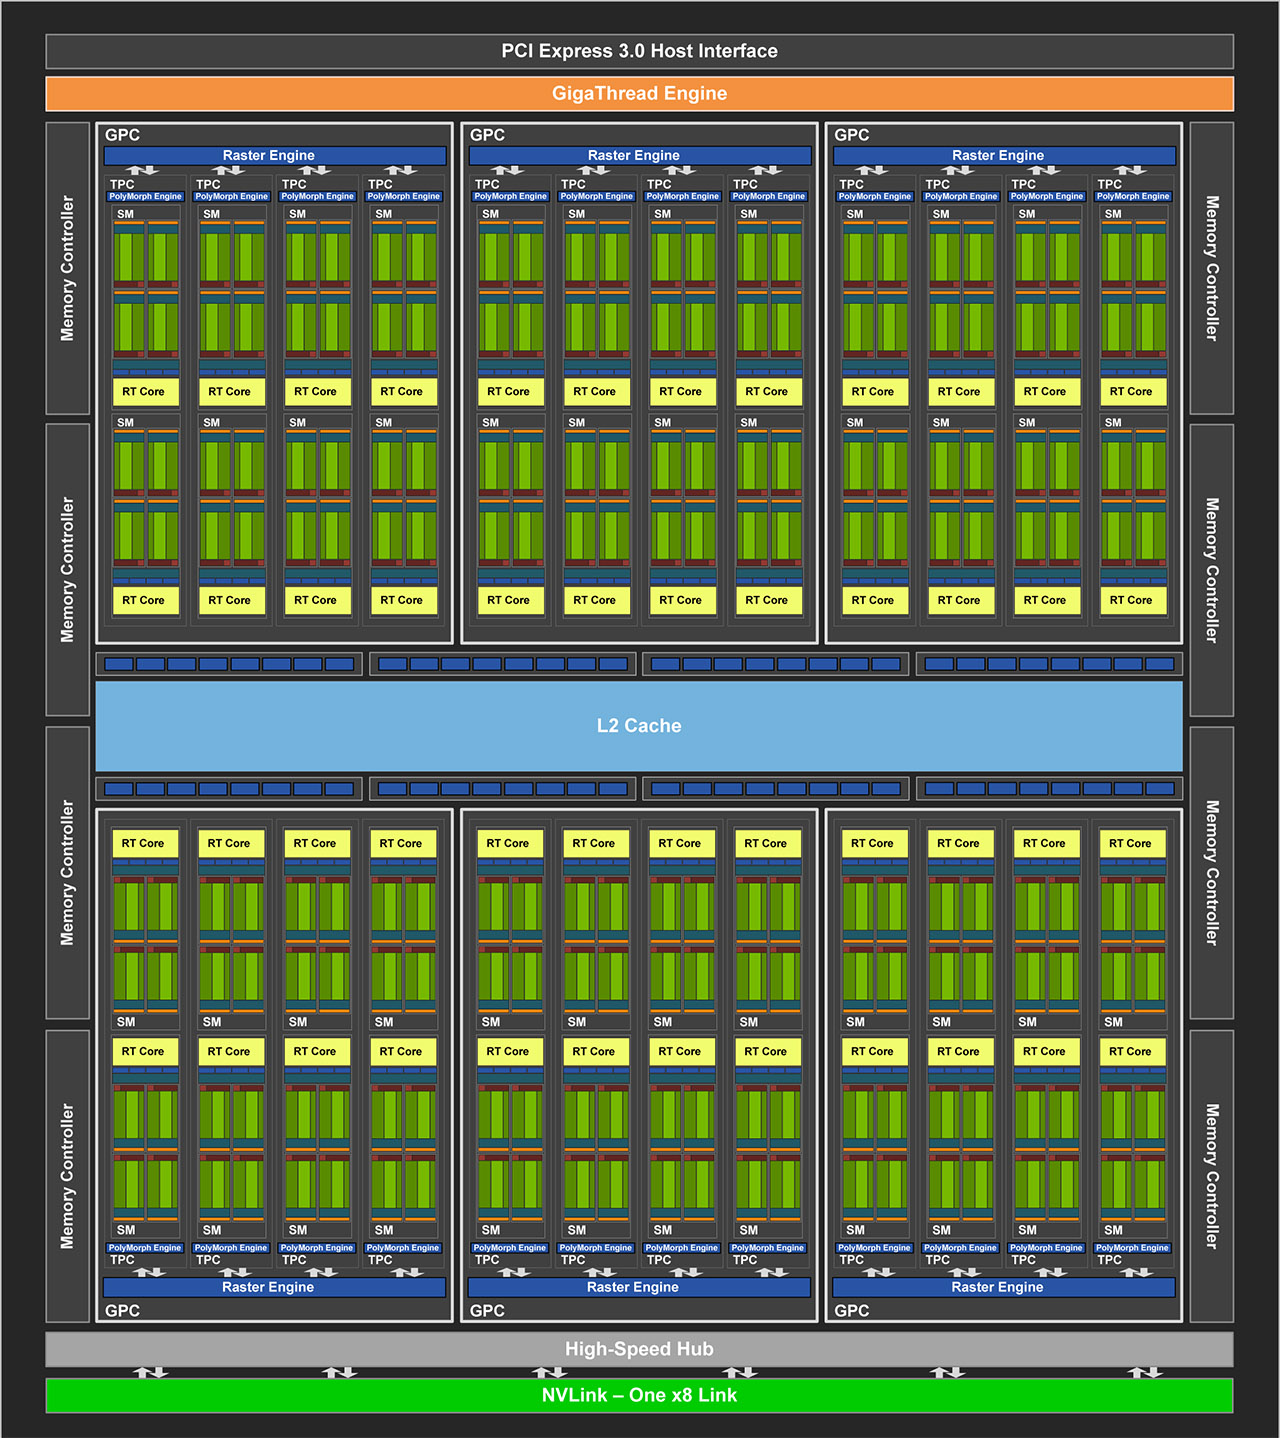
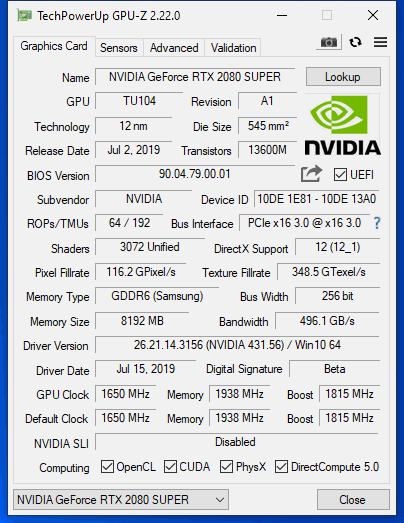
As a brief refresher on TU104 and its vital specs, TSMC manufactures the GPU on its 12nm FinFET node. A total of 13.6 billion transistors are crammed into a 545 mm² die, which is naturally smaller than Nvidia’s massive TU102 processor but still quite a bit larger than last generation’s 471 mm² flagship (GP102).
TU104 is constructed with the same building blocks as TU102; it just features fewer of them. Streaming Multiprocessors still sport 64 CUDA cores, eight Tensor cores, one RT core, four texture units, 16 load/store units, 256KB of register space, and 96KB of L1 cache/shared memory. TPCs are still composed of two SMs and a PolyMorph geometry engine. Only here, there are four TPCs per GPC, and six GPCs spread across the processor. Therefore, a fully enabled TU104 wields 48 SMs, 3,072 CUDA cores, 384 Tensor cores, 48 RT cores, 192 texture units, and 24 PolyMorph engines. TU104 also loses an eight-lane NVLink connection compared to TU102, limiting it to one x8 link and 50 GB/s of bi-directional throughput.
Get Tom's Hardware's best news and in-depth reviews, straight to your inbox.
A correspondingly narrower back end feeds the compute resources through eight 32-bit GDDR6 memory controllers (256-bit aggregate) attached to 64 ROPs and 4MB of L2 cache. But rather than populating that 256-bit path with 14 Gb/s GDDR6 modules from Micron, Nvidia switches to 8GB of Samsung’s K4Z80325BC-HC16, a 16 Gb/s part clocked down to 15.5 Gb/s for GeForce RTX 2080 Super. Why de-tune the data rate? Jumping to 16 Gb/s would have required a PCB modification, and the gain wouldn't have been worth the added cost and complexity. Nvidia says the memory should still overclock to 16 Gb/s manually, though. What's more, GPU overclocks are more effective for improving performance since the chip isn't bandwidth-starved.
| Row 0 - Cell 0 | GeForce RTX 2060 Super | GeForce RTX 2070 Super | GeForce RTX 2080 Super |
| Architecture (GPU) | Turing (TU106) | Turing (TU104) | Turing (TU104) |
| CUDA Cores | 2176 | 2560 | 3072 |
| Peak FP32 Compute | 7.2 TLFOPS | 9.1 TFLOPS | 11.2 TFLOPS |
| Tensor Cores | 272 | 320 | 384 |
| RT Cores | 34 | 40 | 48 |
| Texture Units | 136 | 160 | 192 |
| Base Clock Rate | 1470 MHz | 1605 MHz | 1650 MHz |
| GPU Boost Rate | 1650 MHz | 1770 MHz | 1815 MHz |
| Memory Capacity | 8GB GDDR6 | 8GB GDDR6 | 8GB GDDR6 |
| Memory Bus | 256-bit | 256-bit | 256-bit |
| Memory Bandwidth | 448 GB/s | 448 GB/s | 496 GB/s |
| ROPs | 64 | 64 | 64 |
| L2 Cache | 4MB | 4MB | 4MB |
| TDP | 175W | 215W | 250W |
| Transistor Count | 10.8 billion | 13.6 billion | 13.6 billion |
| Die Size | 445 mm² | 545 mm² | 545 mm² |
| SLI Support | No | Yes | Yes |
The cumulative effect of a more capable TU104 is amplified by higher clock rates. Whereas GeForce RTX 2080 Founders Edition had a 1,515 MHz base and 1,800 MHz GPU Boost rating, GeForce RTX 2080 Super starts at 1,650 MHz base and typically operates closer to 1,815 MHz. Peak FP32 compute performance rises from 10.6 TFLOPS to 11.2 TFLOPS. And memory bandwidth increases to 496.1 GB/s, up from 448 GB/s.
Those more aggressive specs do influence GeForce RTX 2080 Super’s power consumption, bumping its board rating up to 250W. However, Nvidia still gets by with eight- and six-pin auxiliary power connectors.
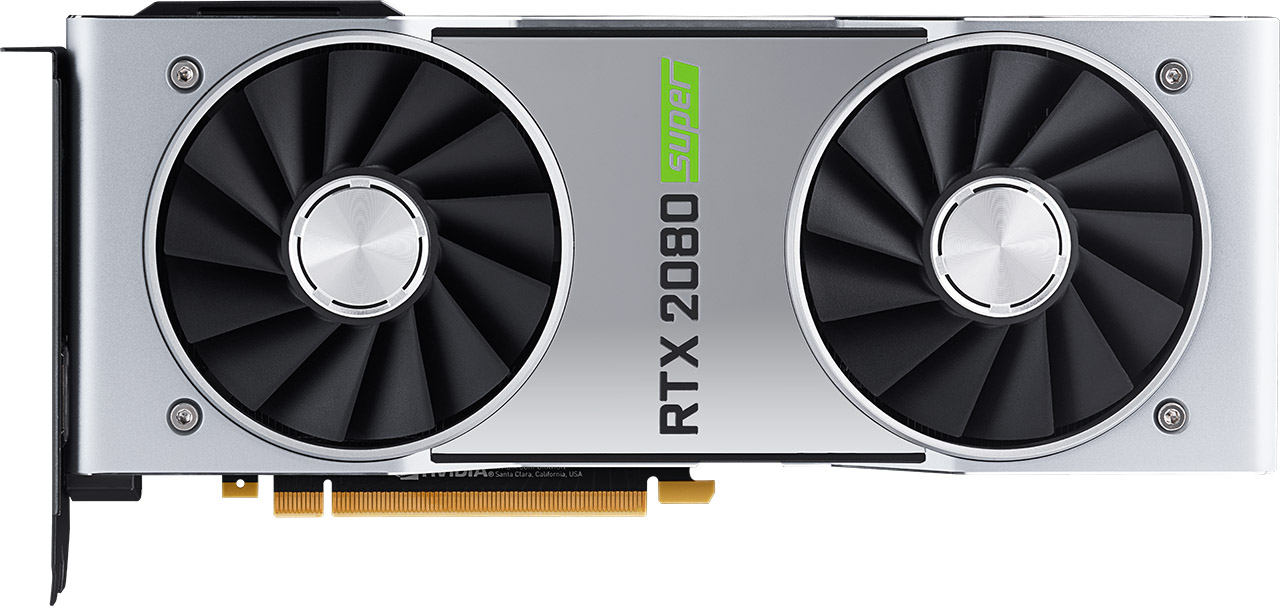
For that matter, GeForce RTX 2080 Super and GeForce RTX 2080 Founders Edition are almost identical from the outside, other than some Super branding on the backplate and an RTX 2080 Super logo over a reflective sticker applied to the front. A pair of 8.5cm axial fans on either side utilize 13 blades to move heat away from TU104 as quickly as possible.
The same forged aluminum shroud holds them in place over a dense fin stack soldered onto a vapor chamber.
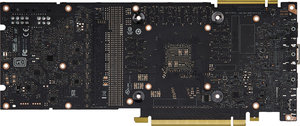
Inside, you’re looking at the same 8 (GPU) + 2 (memory)-phase power supply. Six of the GPU’s phases are fed by the power connectors, while the other two draw current from the PCIe slot.
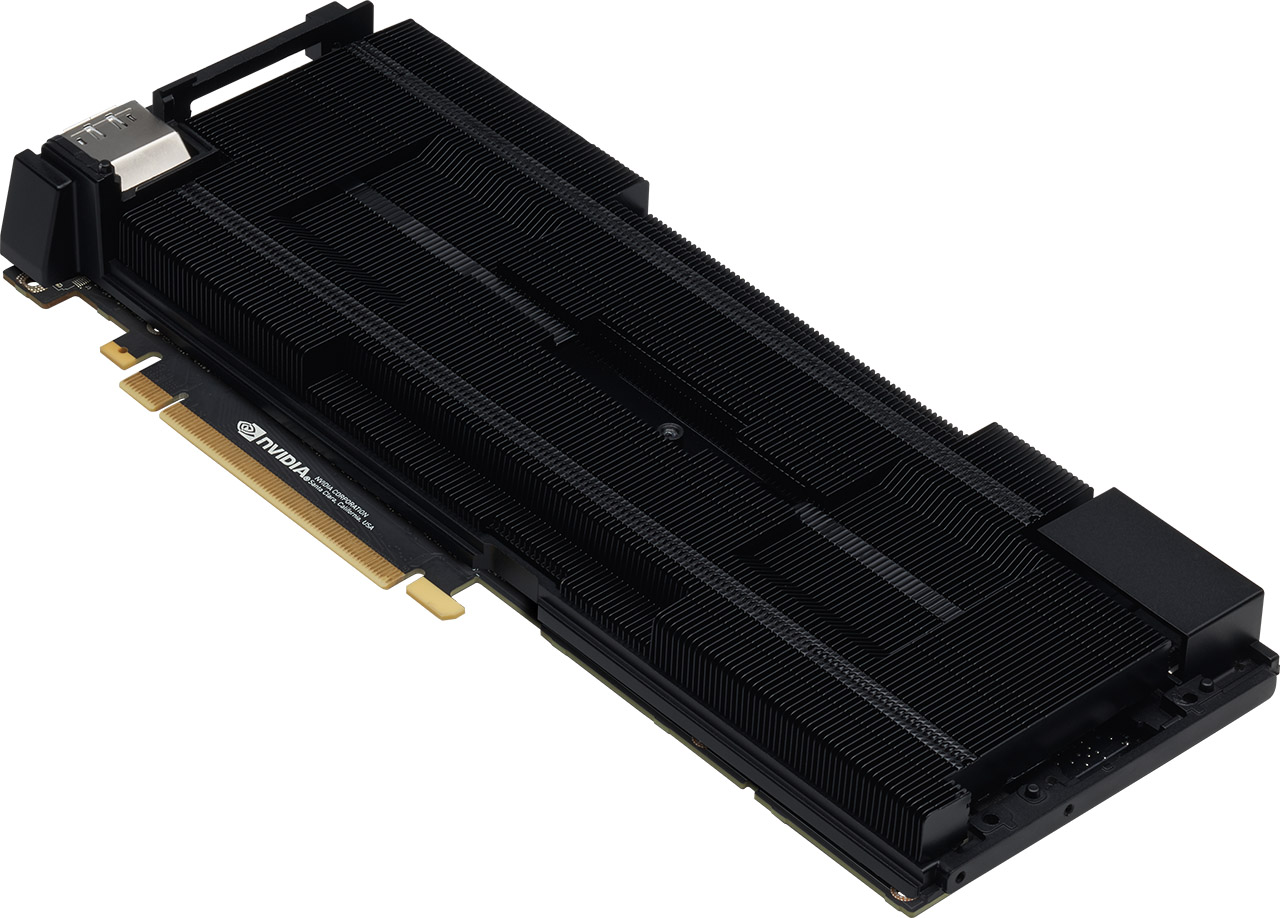
Up front, Nvidia exposes the same display outputs: three DisplayPort 1.4 connectors, one HDMI 2.0b port, and one USB Type-C interface with VirtualLink support.
How We Tested GeForce RTX 2080 Super
With the GeForce RTX 2060 Super and 2070 Super reviews behind us, along with our coverage of Radeon RX 5700 and 5700 XT, we were able to fill in a few more blanks in our benchmark data using a brand-new platform. The machine we’re testing on now is powered by Intel’s Core i7-8086K six-core CPU on a Z370 Aorus Ultra Gaming motherboard with 64GB of a Corsair CMK128GX4M8A2400OC14 kit. We’re still using a couple of 500GB Crucial MX200 SSDs for our gaming suite, along with Noctua’s NH-D15S heat sink/fan combo.
Our latest library of data already included GeForce RTX 2080, GeForce RTX 2070, GeForce RTX 2060, GeForce GTX 1080 Ti, GeForce GTX 1080, GeForce GTX 1070 Ti, and GeForce GTX 1070. To that list, we added GeForce RTX 2080 Ti. All of those cards are represented by Nvidia’s own Founders Edition models except for the 1070 Ti, which is an MSI GeForce GTX 1070 Ti Gaming 8G. AMD’s own Radeon VII is part of the comparison as well, along with Sapphire’s Nitro+ Radeon RX Vega 64 and Nitro+ Radeon RX Vega 56. Those partner cards ensure we don’t see the frequency/throttling issues encountered with our reference models.
Our benchmark selection includes Battlefield V, Destiny 2, Far Cry 5, Final Fantasy XV, Forza Horizon 4, Grand Theft Auto V, Metro Exodus, Shadow of the Tomb Raider, Strange Brigade, Tom Clancy’s The Division 2, Tom Clancy’s Ghost Recon Wildlands, The Witcher 3 and Wolfenstein II: The New Colossus.
The testing methodology we're using comes from PresentMon: Performance In DirectX, OpenGL, And Vulkan. In short, these games are evaluated using a combination of OCAT and our own in-house GUI for PresentMon, with logging via GPU-Z.
We’re using driver build 431.16 for Nvidia’s GeForce RTX 2060 and 2070 Super and build 430.86 for all the previous-gen Nvidia cards. Earlier this month, Nvidia published driver build 431.36, which affected performance in Tom Clancy’s The Division 2, Strange Brigade, and Metro Exodus. As a result, we had to re-test GeForce RTX 2080, 2070, and 2060 using that update. On AMD’s side, we’re using Adrenalin 2019 Edition 19.6.3 for all three cards.
MORE: Best Graphics Cards
MORE: Desktop GPU Performance Hierarchy Table
MORE: All Graphics Content
Current page: Meet Nvidia's GeForce RTX 2080 Super 8GB
Next Page Performance Results: 2560 x 1440-
shmoochie "Even more so than GeForce RTX 2060 Super and 2070 Super, the 2080 Super looks very, very similar to its predecessor"Reply
TLDR It's basically just a price drop. You could overclock your founder's edition for the same performance increase. -
Aspiring techie I don't understand why this card got a 4/5 star rating, which ties with the RX 5700. This card is way overpriced. Technically, both cards are, but at least the Navi card is a much better value than competing Nvidia cards.Reply -
redgarl It scored higher than the 5700XT...? Toms... these reviews are useless if they don't make sense... you know?!!!Reply
There is no way this product can be recommended... NO WAY in hell.
Score should be 2.5/5 -
TCA_ChinChin The least exciting of the Super refreshes that weren't that exciting in the first place. I'll say it again, screws early adopters (this time only a little bit) and new customers still don't get a good value since the RTX-2080 range price/performance is garbage anyways. The least improvement for the least worth it product in Nvidia's lineup.Reply -
jimmysmitty Replyshmoochie said:"Even more so than GeForce RTX 2060 Super and 2070 Super, the 2080 Super looks very, very similar to its predecessor"
TLDR It's basically just a price drop. You could overclock your founder's edition for the same performance increase.
Not quite? The 2060 Super includes more memory and more memory bandwidth along with more shaders.
All the cards have more shaders and also probably will have more clocking headroom. This is not like the HD7970GHz edition that was a binned speed chip. These are binned but binned with more total shaders.
Aspiring techie said:I don't understand why this card got a 4/5 star rating, which ties with the RX 5700. This card is way overpriced. Technically, both cards are, but at least the Navi card is a much better value than competing Nvidia cards.
Because price is only one aspect of the total score for a card?
Value is also in the eye of the beholder. Why did the owner of my company dump $140K into a Mercedes that has had massive problems after his $140K Audis transmission blew and he only got $20K for the trade? I mean hell its a construction company and he could have bought two very nice Ford Raptors instead which makes more sense but he likes the other cars more.
Point being, while I agree the price is a tad too high, not everyone sees the RX 5700 XT as a good value when chasing the max FPS. Especially considering that down the road the RX 5700 XT will have to be replaced sooner than the RTX 2080 Super.
redgarl said:It scored higher than the 5700XT...? Toms... these reviews are useless if they don't make sense... you know?!!!
There is no way this product can be recommended... NO WAY in hell.
Score should be 2.5/5
It's always the same with you isn't it? Maybe both cards have their value but this one has better value for the market segment it is trying to reach.
BTW Chris is probably the best reviewer TH has, I certainly miss the days when he was running the ship. They are typically fully fledged with plenty of information to help make a good decision.
Yes the RX 5700 XT is a better "value" if price is your only concern but until AMD tosses GCN to the curb and pushes out a new uArch design that can truly push nVidia we wont see any real price war in the GPU market.
Basically AMD needs to pull a Zen. -
-Fran- Value from a top dog? Some people needs a reality check in a capitalist world.Reply
Yeah, yeah, the 2080ti is the top dog... No, the Titan V was it? I can't remember as AMD is so far behind we have to deal with this pricing nonsense from nVidia to get decent performance.
I sound* salty, because I am. I want prices to go down, but no company out there works as a charity. The only way nVidia will ever drop prices (even in the form of a re-brand / re-launch) is with competition.
You can all hope AMD gets their act together and delivers with the next gen.
Cheers! -
chickenballs Reply
Maybe you have forgotten about the famous Tom's article about the RTX cards before they were even released:Aspiring techie said:I don't understand why this card got a 4/5 star rating, which ties with the RX 5700. This card is way overpriced. Technically, both cards are, but at least the Navi card is a much better value than competing Nvidia cards.
https://www.tomshardware.com/news/nvidia-rtx-gpus-worth-the-money,37689.html
Just buy it!
Qeb3IhsZSCMView: https://www.youtube.com/watch?v=Qeb3IhsZSCM -
TCA_ChinChin Title changes from "Nvidia GeForce RTX 2080 Super Review: Leaving Navi In The Dust" to "Nvidia Geforce RTX 2080 Super Review: Leaving Navi In The Dust At Nearly 2x the price" to "Nvidia Geforce RTX 2080 Super Review: High-Res Gaming at a Premium Price". Maybe y'all should have just used the last title in the beginning? Even this comment thread still has the original name. If you guy's kept it as is, then it would've been the save as "Nvidia GeForce RTX 2080 Super Review: Leaving RTX 2070 In The Dust" or simply anything else in the 400$ bracket. Imagine comparing a 700$ card to a 400$ card.Reply -
jimmysmitty Replychickenballs said:Maybe you have forgotten about the famous Tom's article about the RTX cards before they were even released:
https://www.tomshardware.com/news/nvidia-rtx-gpus-worth-the-money,37689.html
Just buy it!
Qeb3IhsZSCMView: https://www.youtube.com/watch?v=Qeb3IhsZSCM
That was an Op-Ed by the head of TH. Myself, and most moderators, were very much against it anyways as they are always pointless.
However that has NOTHING to do with Chris and his review. Chris has never been that way and always gives an honest opinion for the product. -
ingtar33 Reply
bingo, don't question nvidia, just buy them! I for one am all for our corperate overlords.chickenballs said:Maybe you have forgotten about the famous Tom's article about the RTX cards before they were even released:
https://www.tomshardware.com/news/nvidia-rtx-gpus-worth-the-money,37689.html
Just buy it!
Qeb3IhsZSCMView: https://www.youtube.com/watch?v=Qeb3IhsZSCM
setting that sad social commentary aside, I love how THG ignores the fact that the 2080 super is just a 1080ti, being sold at $700+
the Rt2070 xt just tested at or just above 2070 speeds (depending on the reviewer), and sells for <400
If that isn't attractive for anyone then you'll never see lower prices from nvidia. Why? because it's people like those, waiting for the mystical nvidia price drop that allows them to NEVER drop their prices. The longer they refuse to buy team red, the more they lock in nvidia's monopolistic practices.
and the more tech journalists and publications like THG ignores NVIDIA's predatory monopolistic pricing, the worst the situation gets.
