Why you can trust Tom's Hardware
We measure real-world power consumption using Powenetics testing hardware and software. We capture in-line GPU power consumption by collecting data while looping Metro Exodus (the original, not the enhanced version) and while running the FurMark stress test. We also check noise levels using an SPL meter. Our PC for these tests remains the same old Core i9-9900K as we've used previously, to keep results consistent.
We also test on our newer 13900K PC using PCAT v2 hardware in all of our gaming benchmarks, which gives a wider view of power use and efficiency. We'll start with the gallery of our PCAT results — note that FPS/$ uses the official MSRPs for the RX 7000- and RTX 40-series cards, while FPS/W (ie, efficiency) uses the measured power consumption.
We have results for our 1440p and 4K testing, along with the manually overclocked 4K testing (except on the RTX 4080 and 4090 Founders Edition cards, where we didn't retest overclocked results). We'll stick to just the latest generation GPUs for these tables.
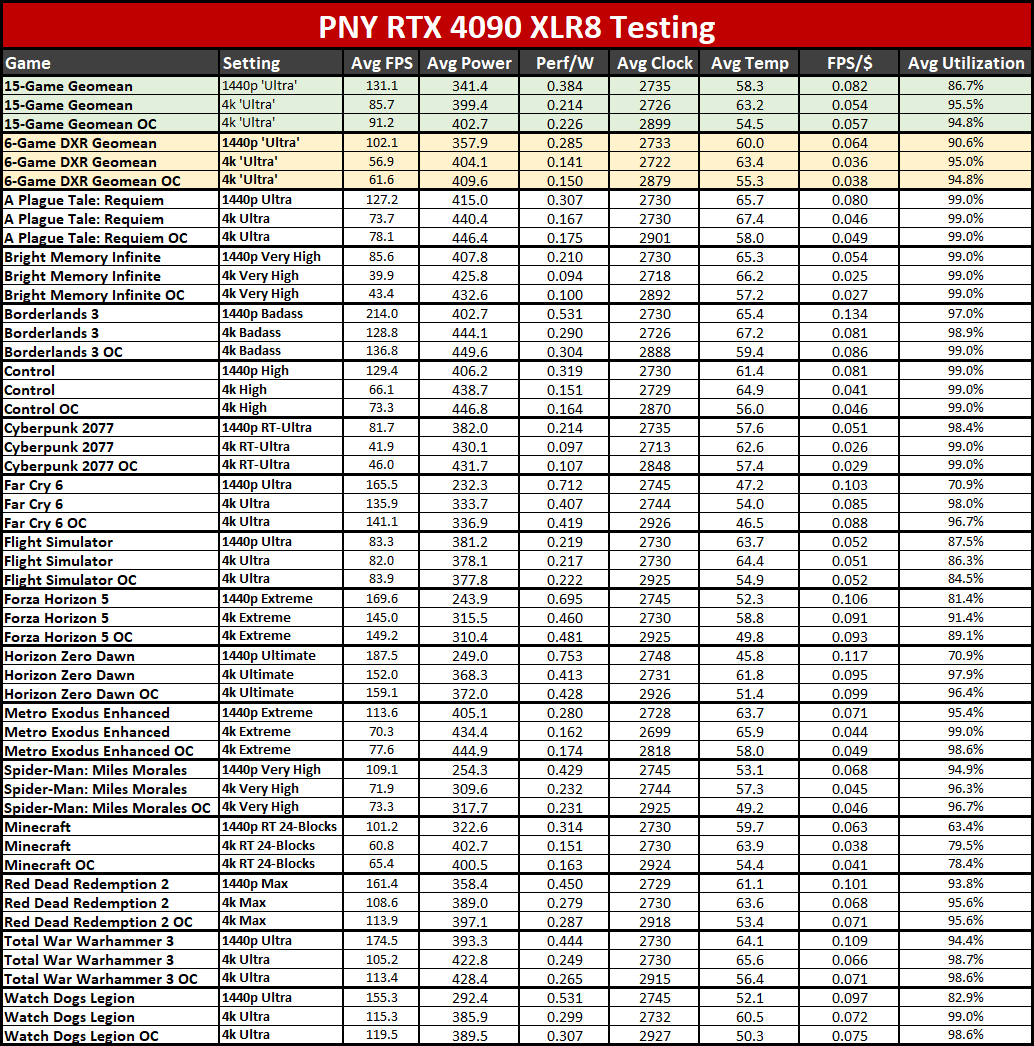
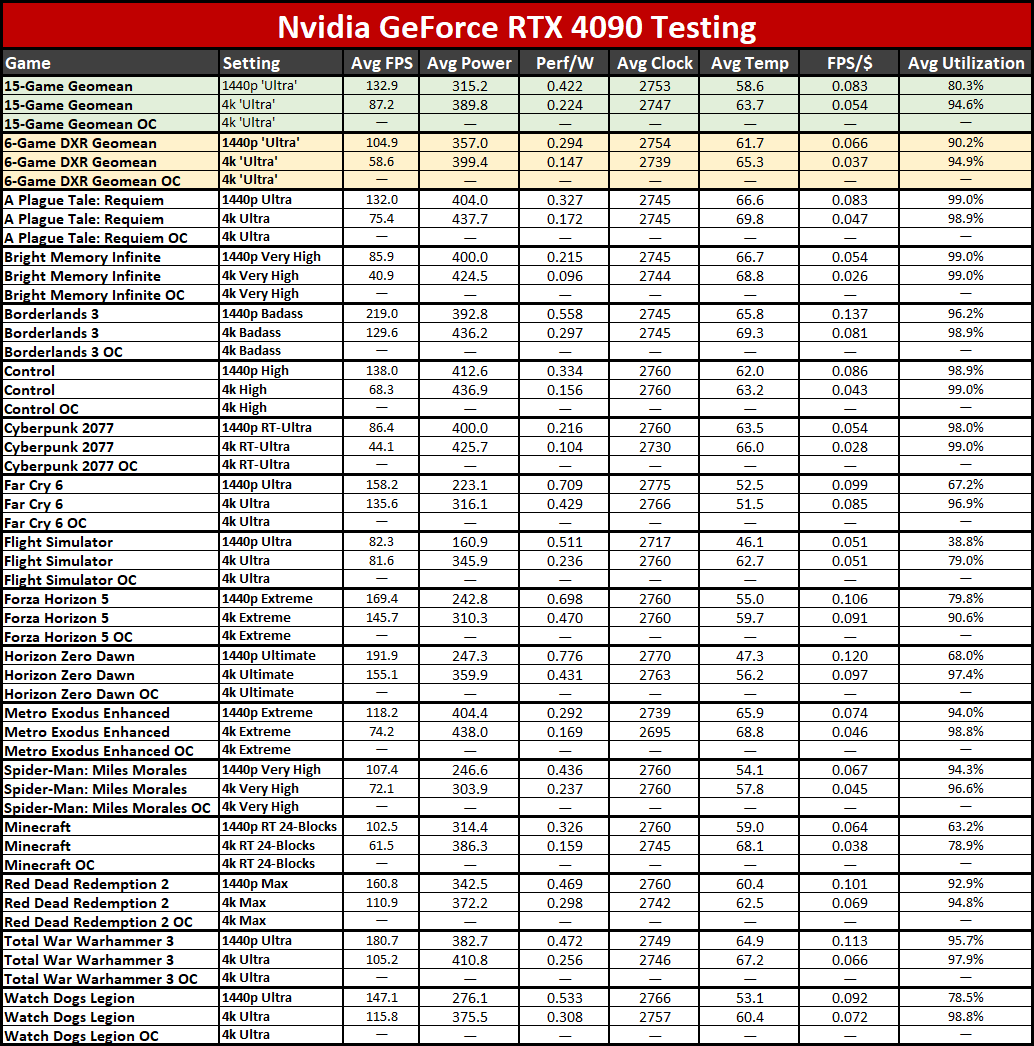
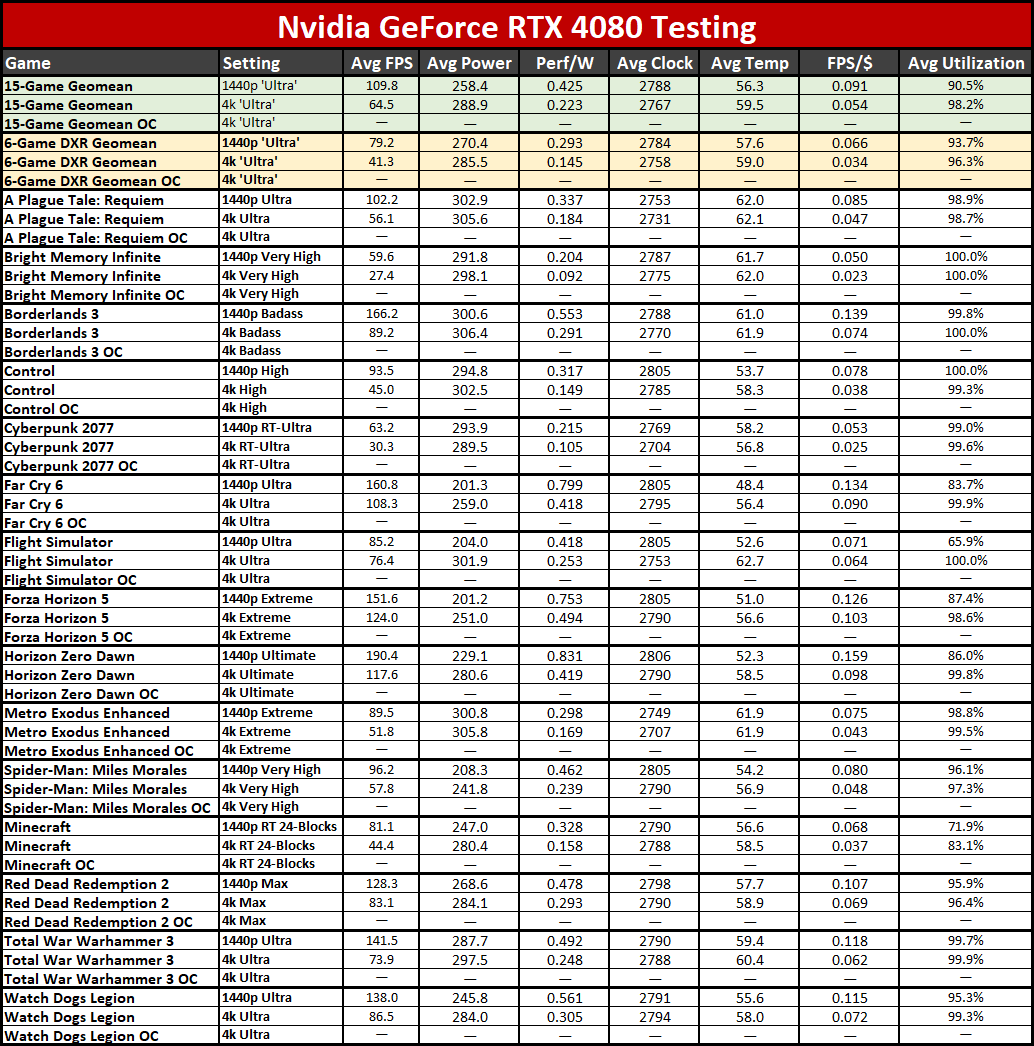
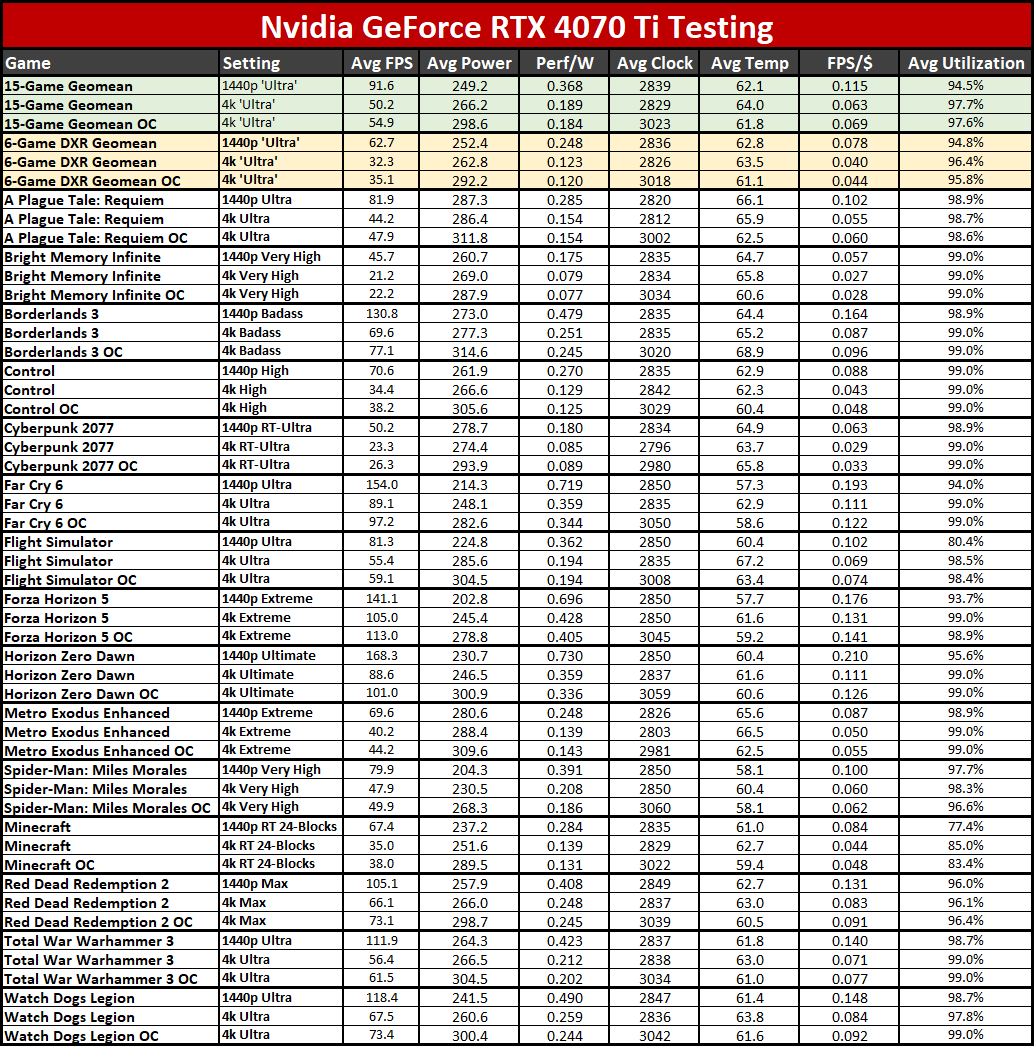
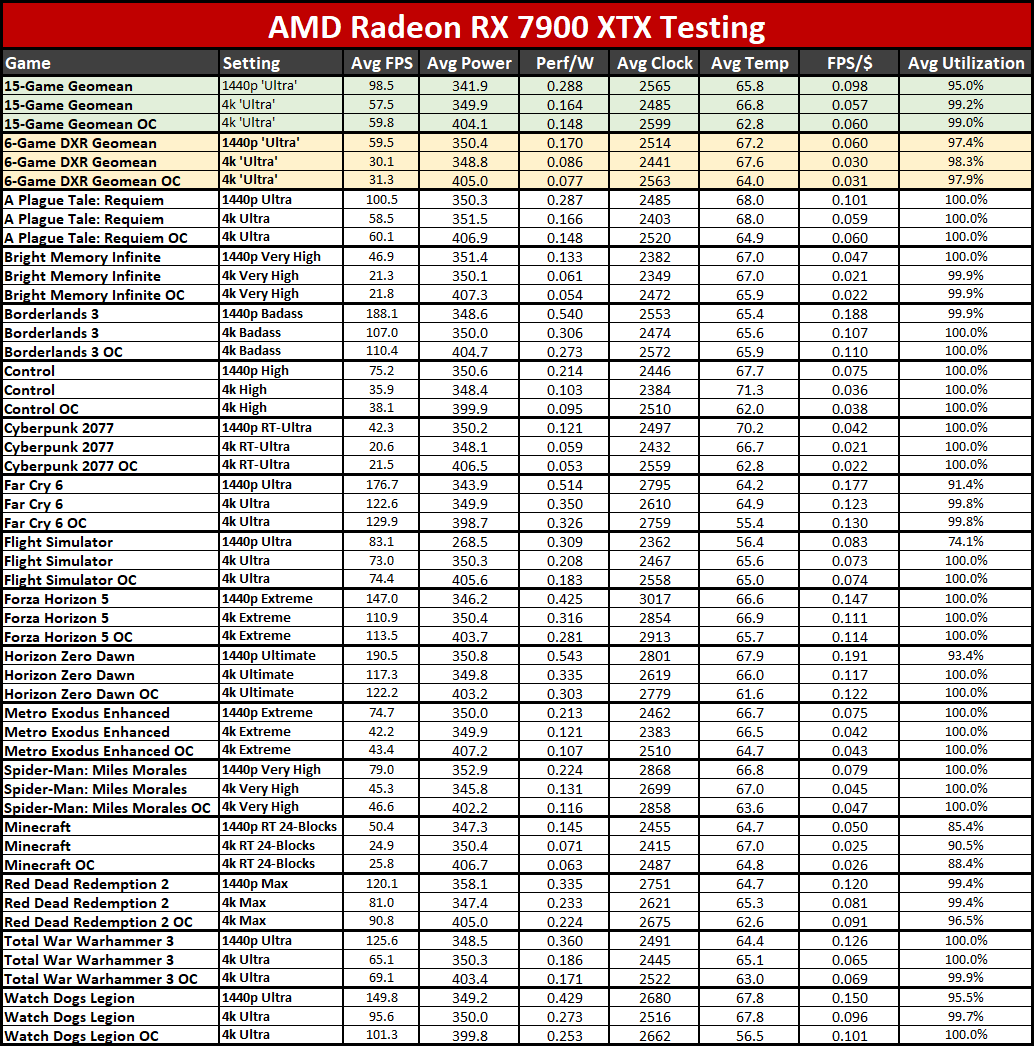
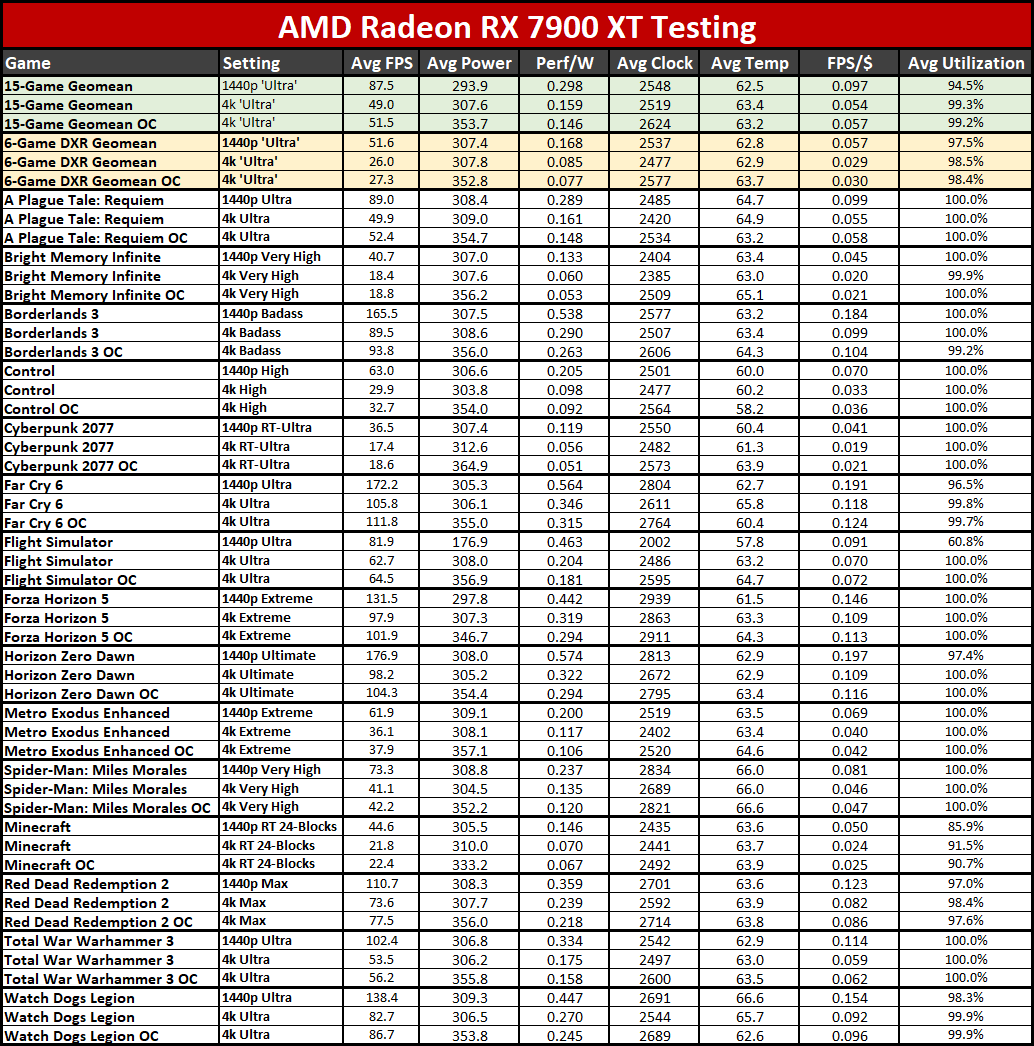
The other GPUs are included mostly as a reference point, and our focus will be on the two 4090 cards. Interestingly, across our test suite, the PNY card ends up using slightly more power than the Founders Edition, at least for the overall geometric mean. There are some outliers in the results, though.
Look at Flight Simulator, where the Founders Edition only used 161W at 1440p while the PNY uses 381W — more than double the power use. Performance is basically unchanged, so it's possible that a driver update is to blame, or else just different VBIOS settings. But even omitting Flight Simulator, the PNY card consistently uses a bit more power at both 1440p and 4K, which likely comes down to differences in the board level components (capacitors, inductors, etc.)
The net result is that PNY's card ends up slightly less efficient overall, but it's not a big enough change to warrant further discussion. Overclocking meanwhile only increases power use by about 1% on average, as the power limit didn't change. A few games might use up to 2% more power, but the interesting bit is that clock speeds improve by 6% so overall efficiency also gets better.
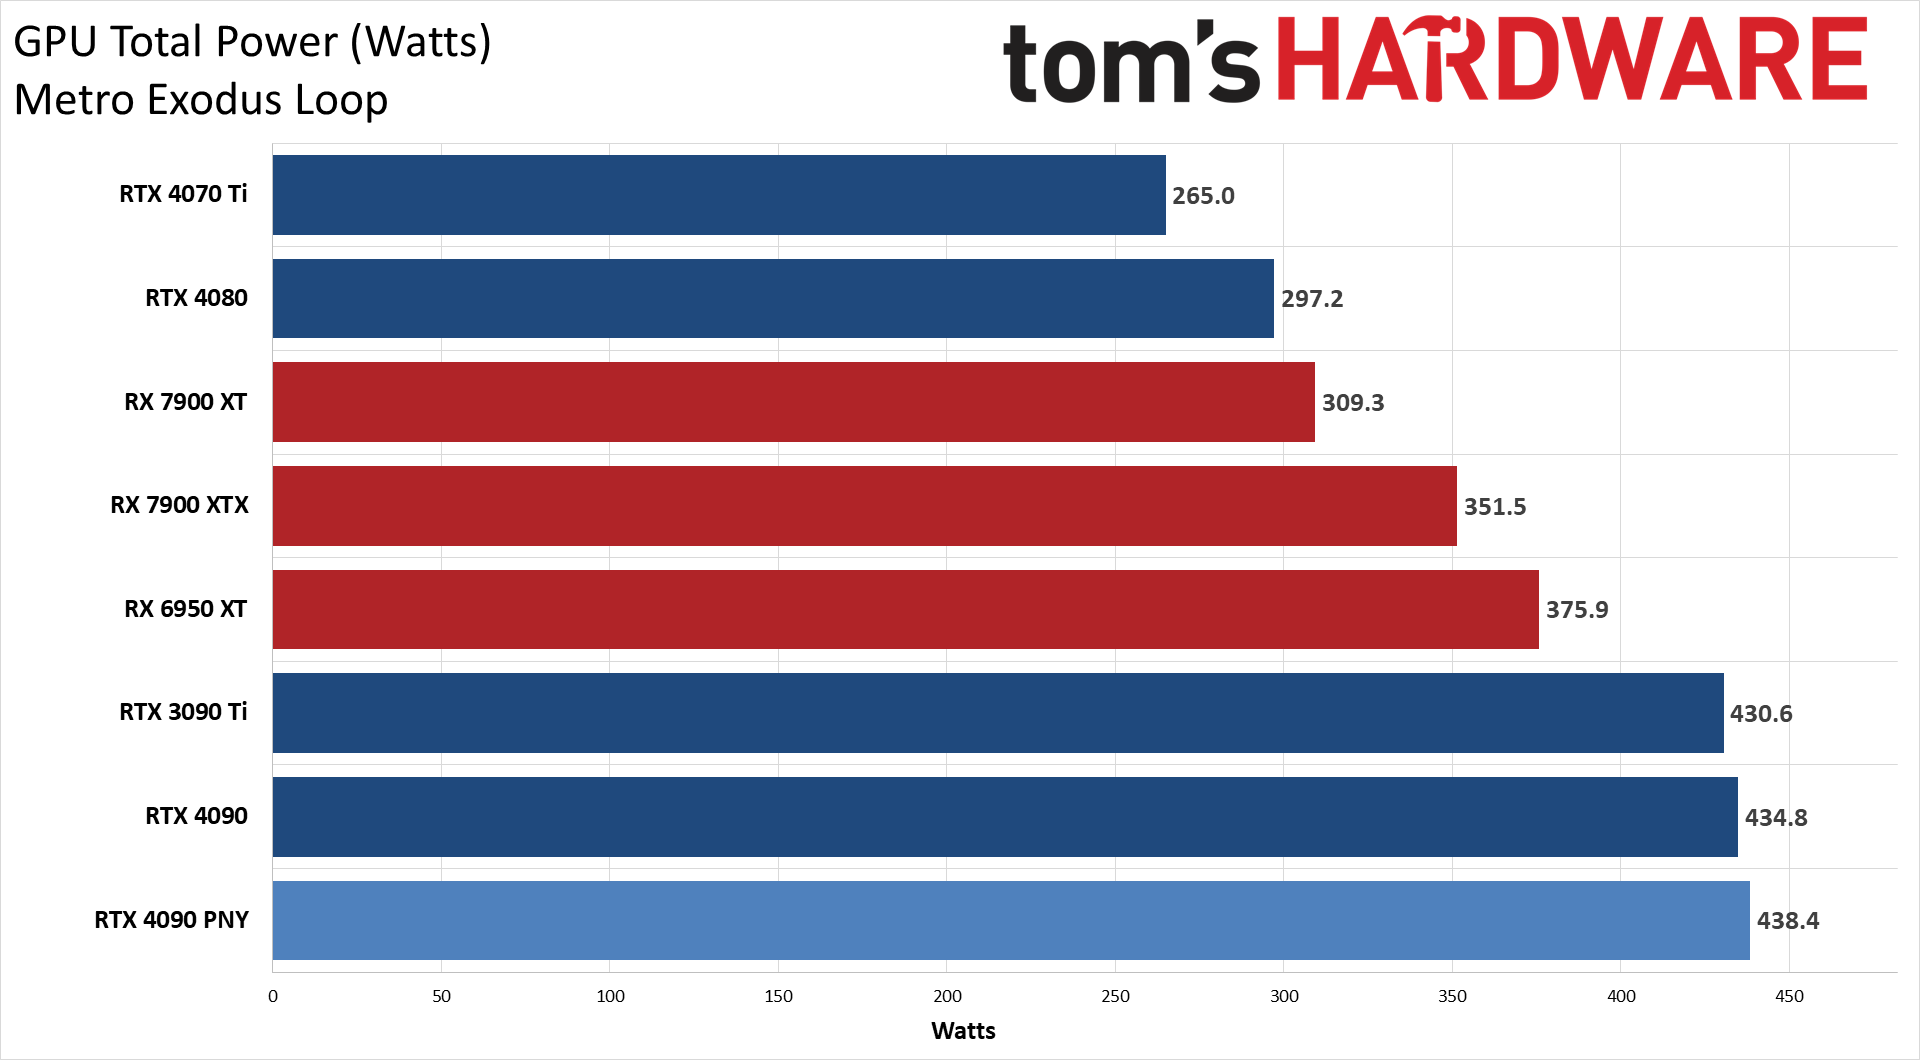
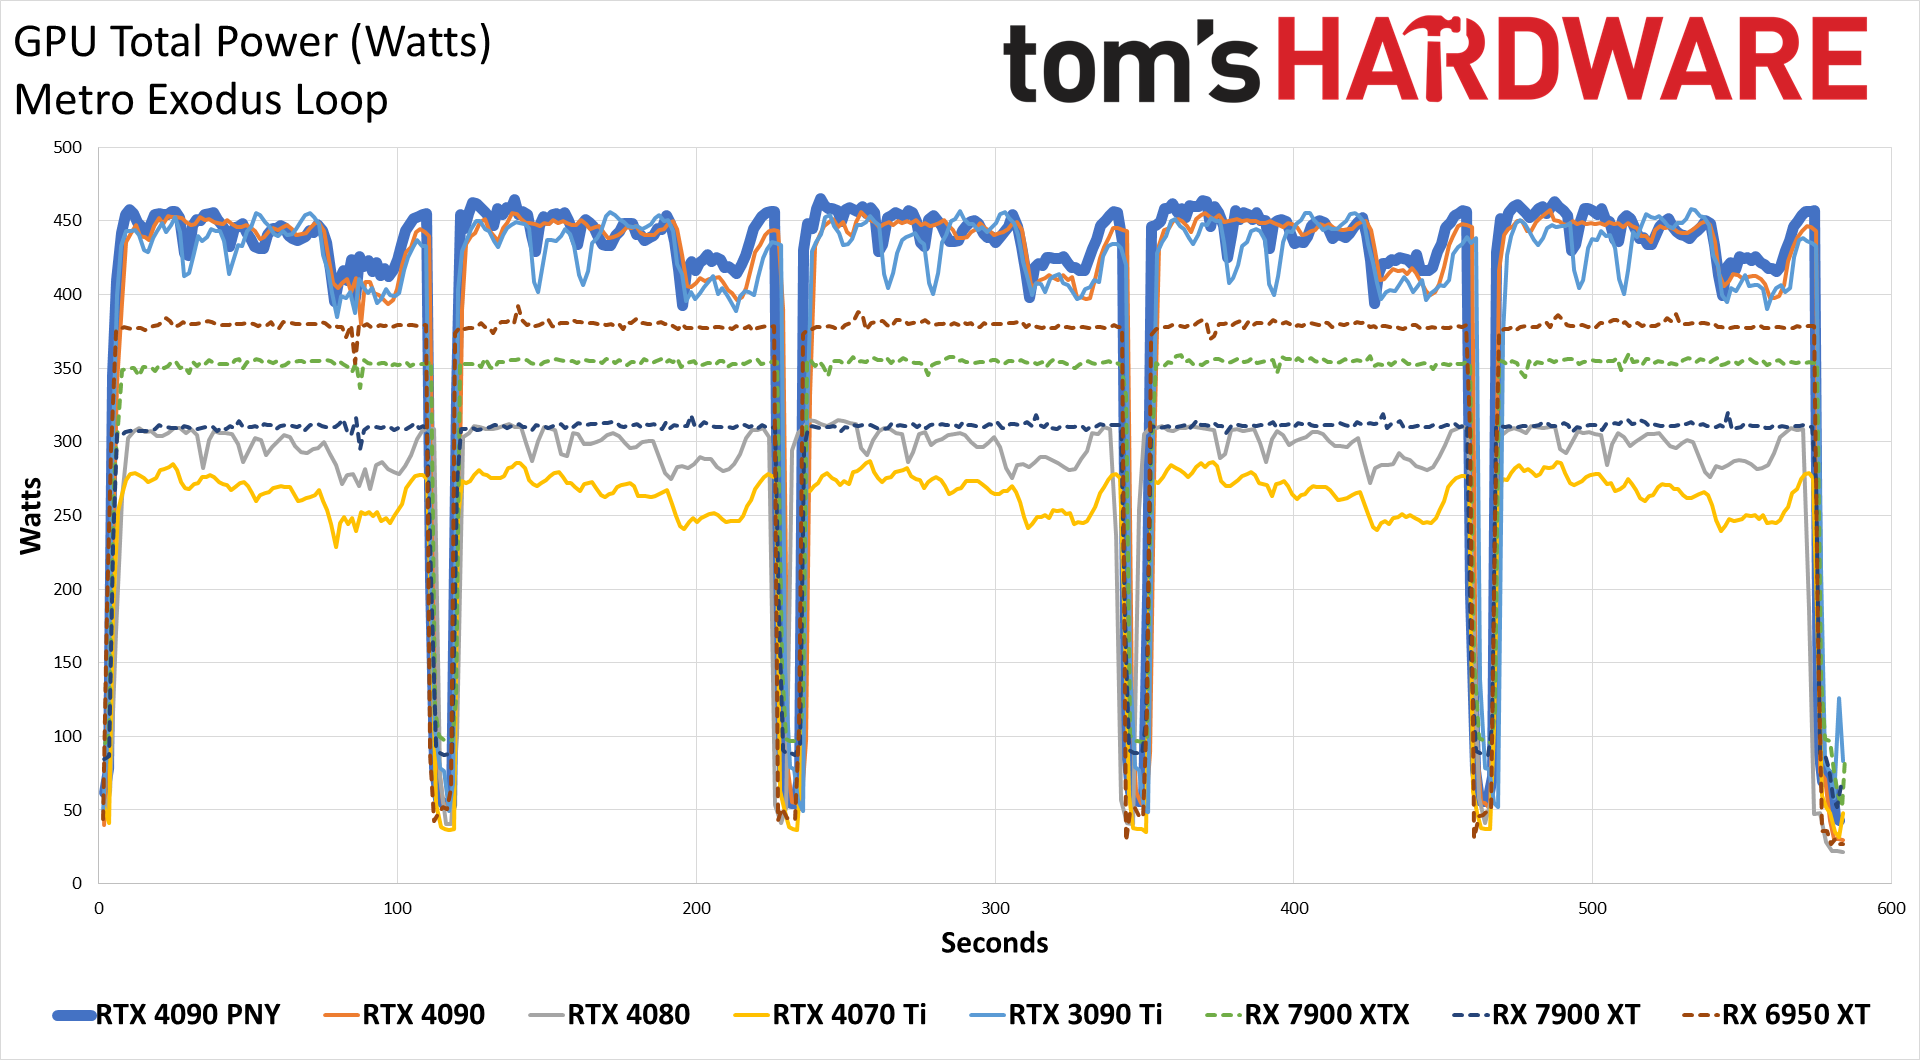
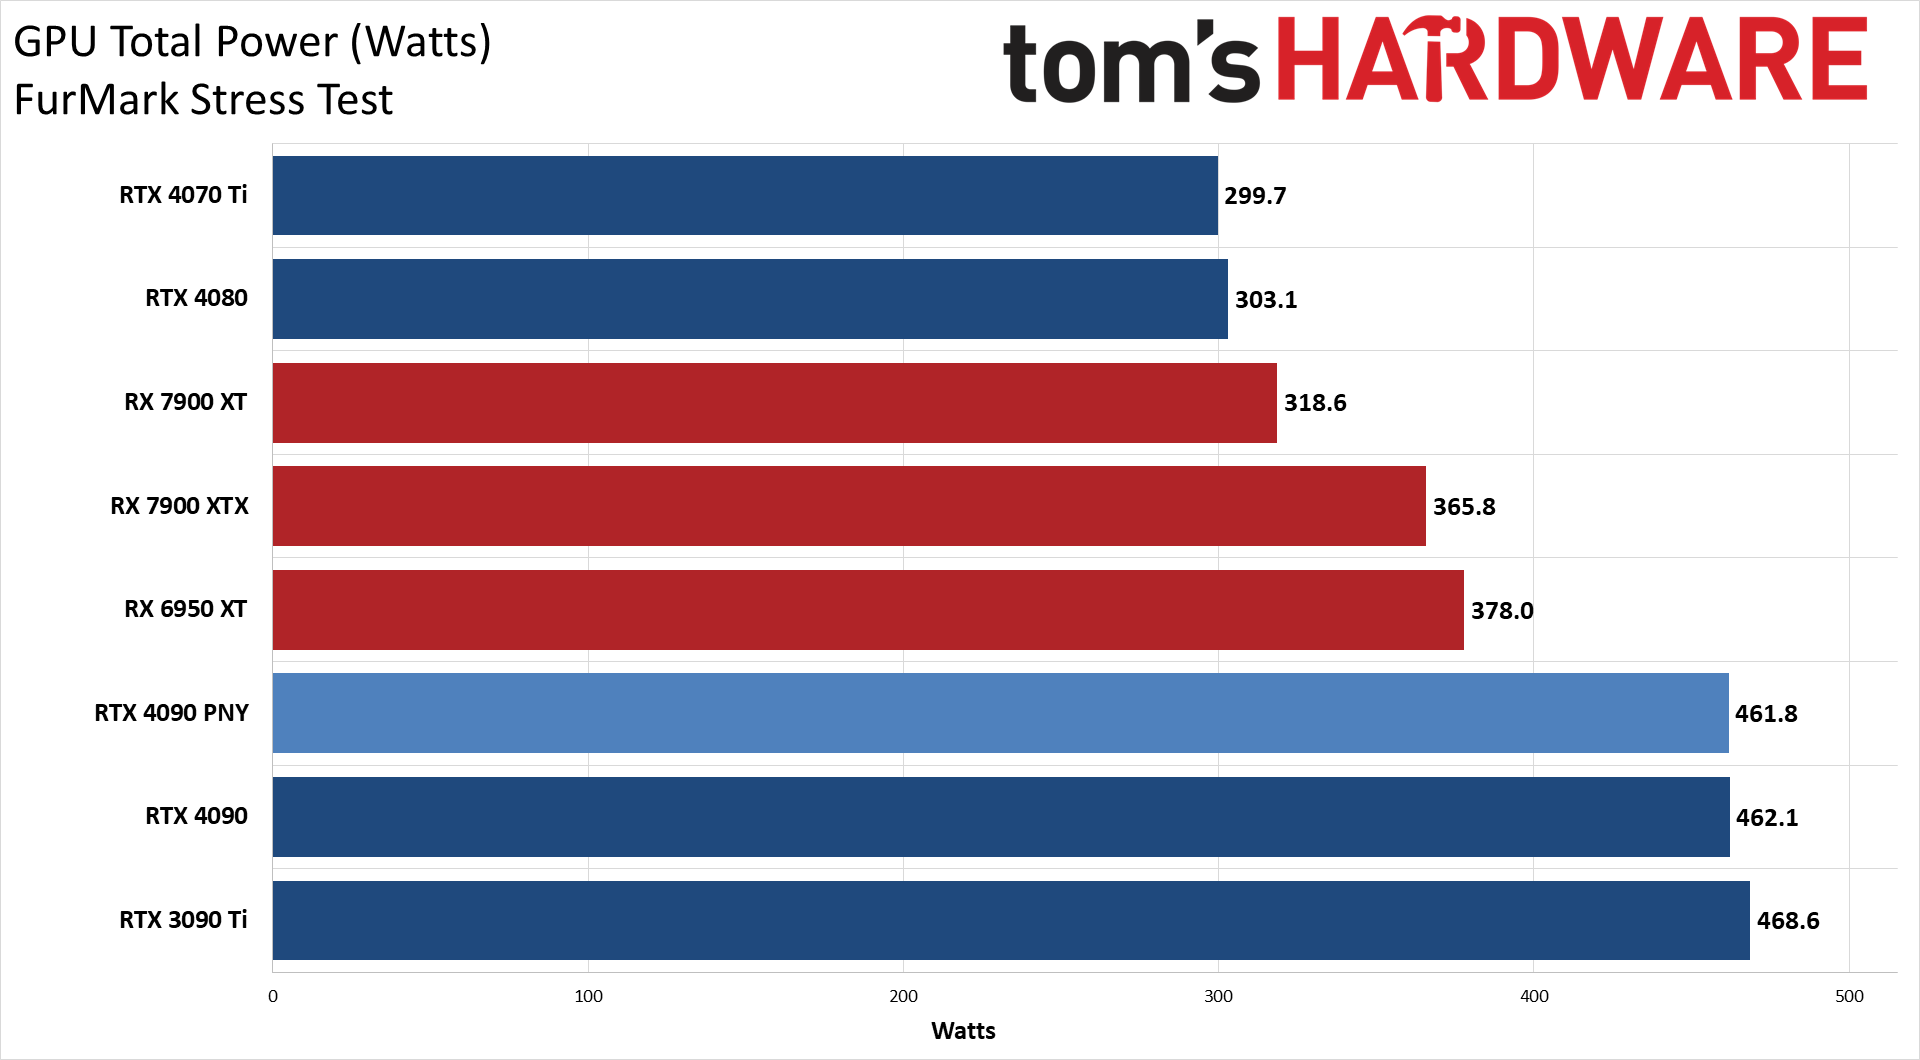
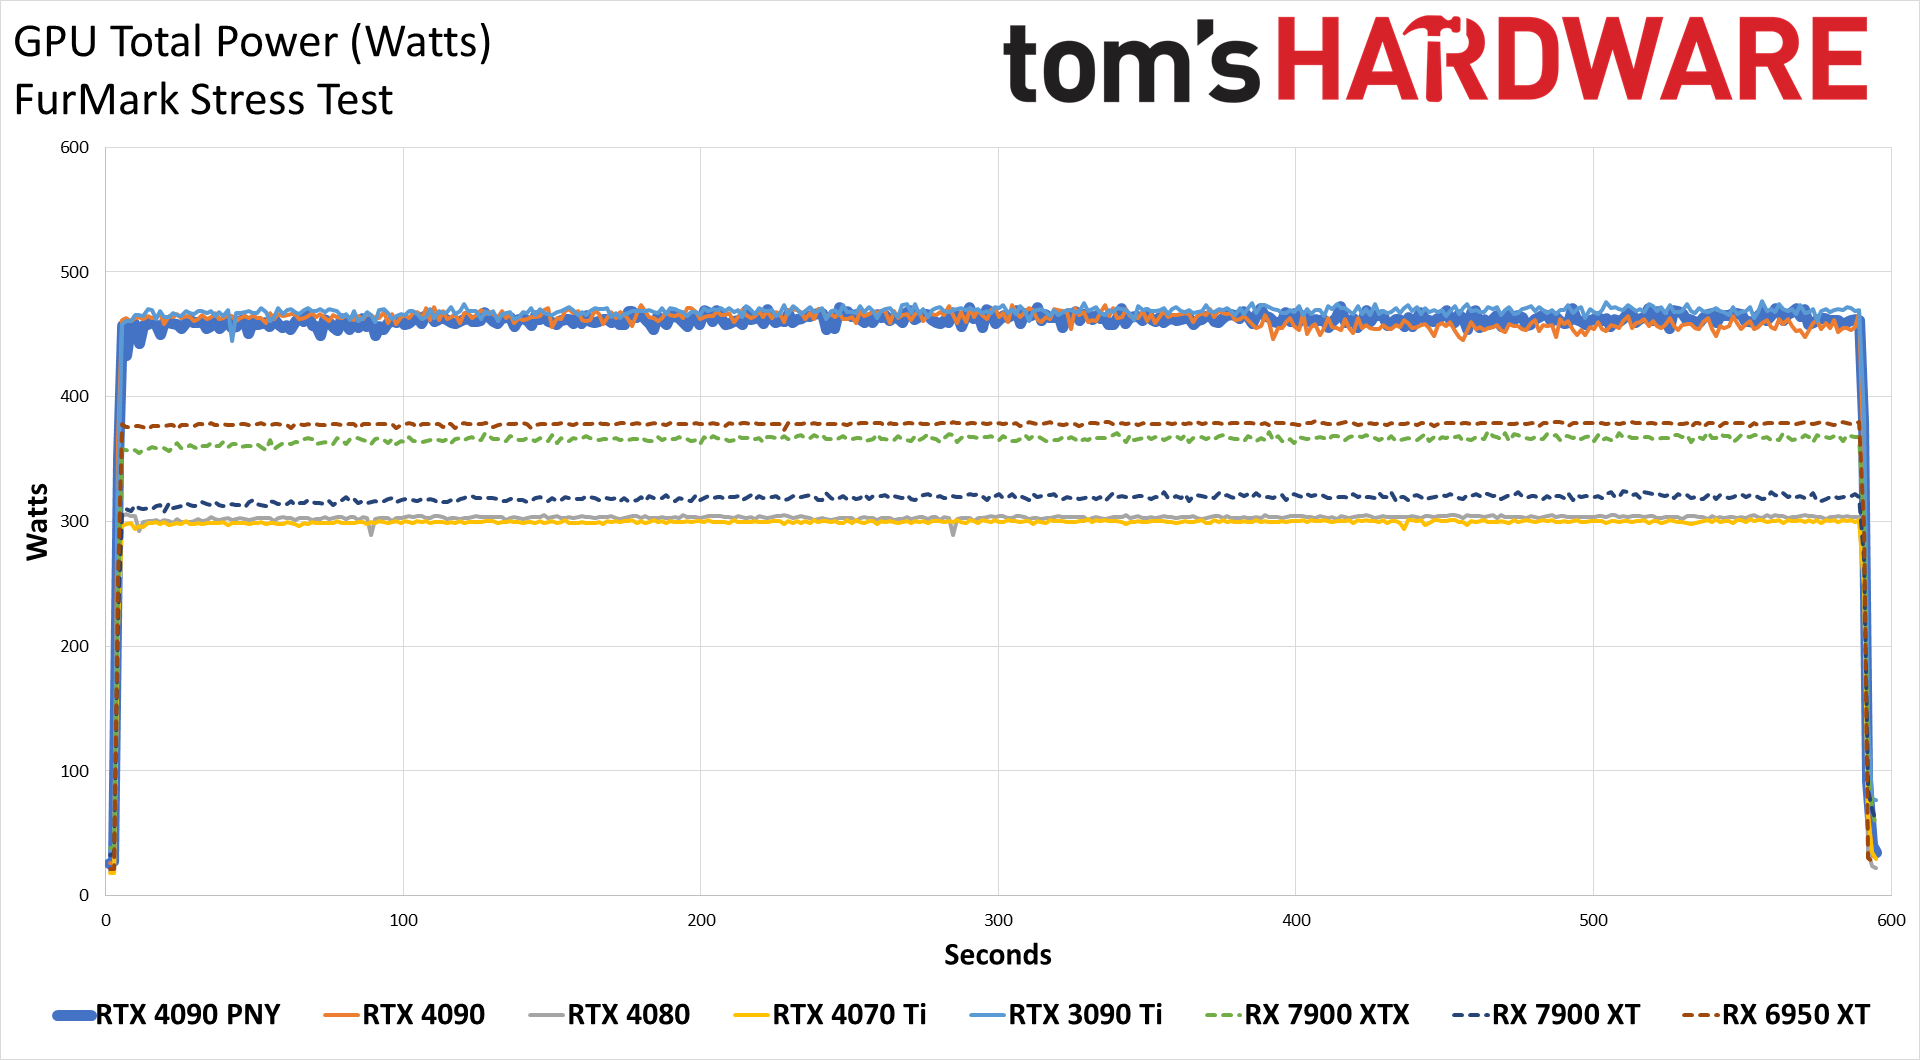
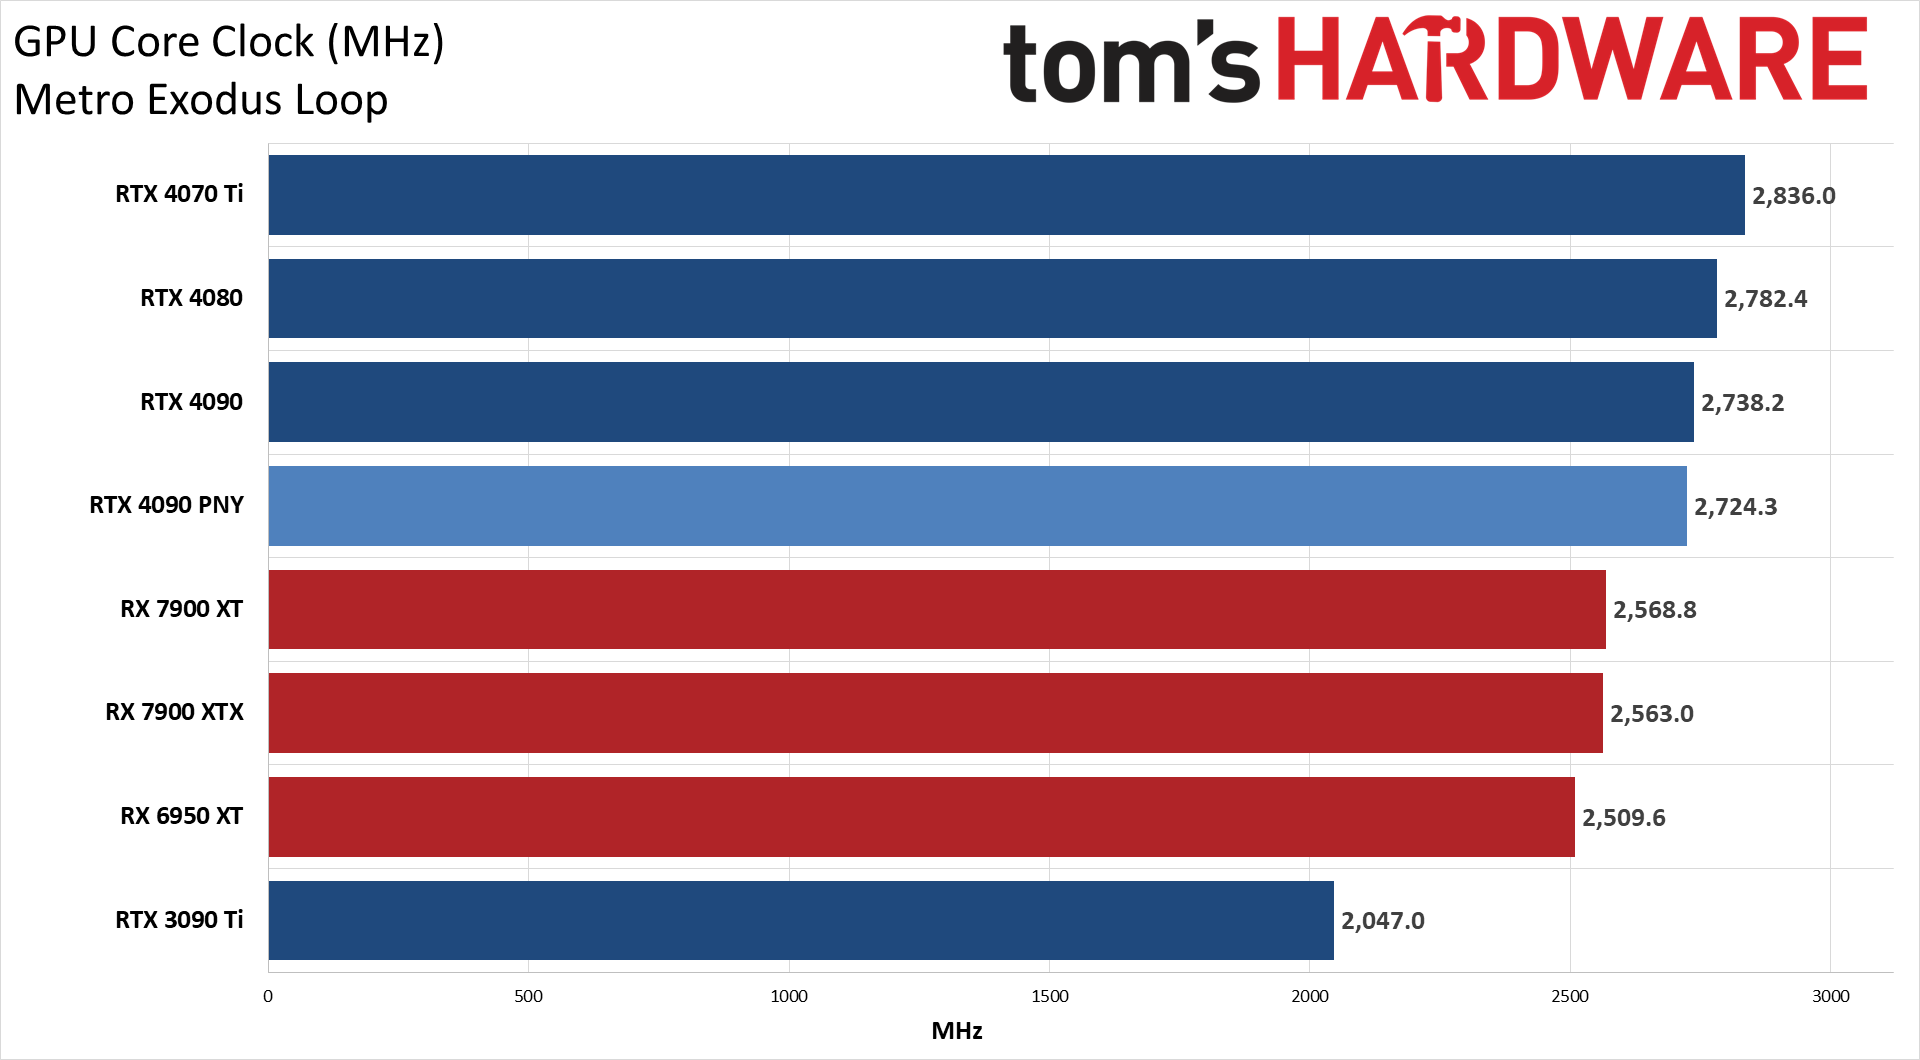
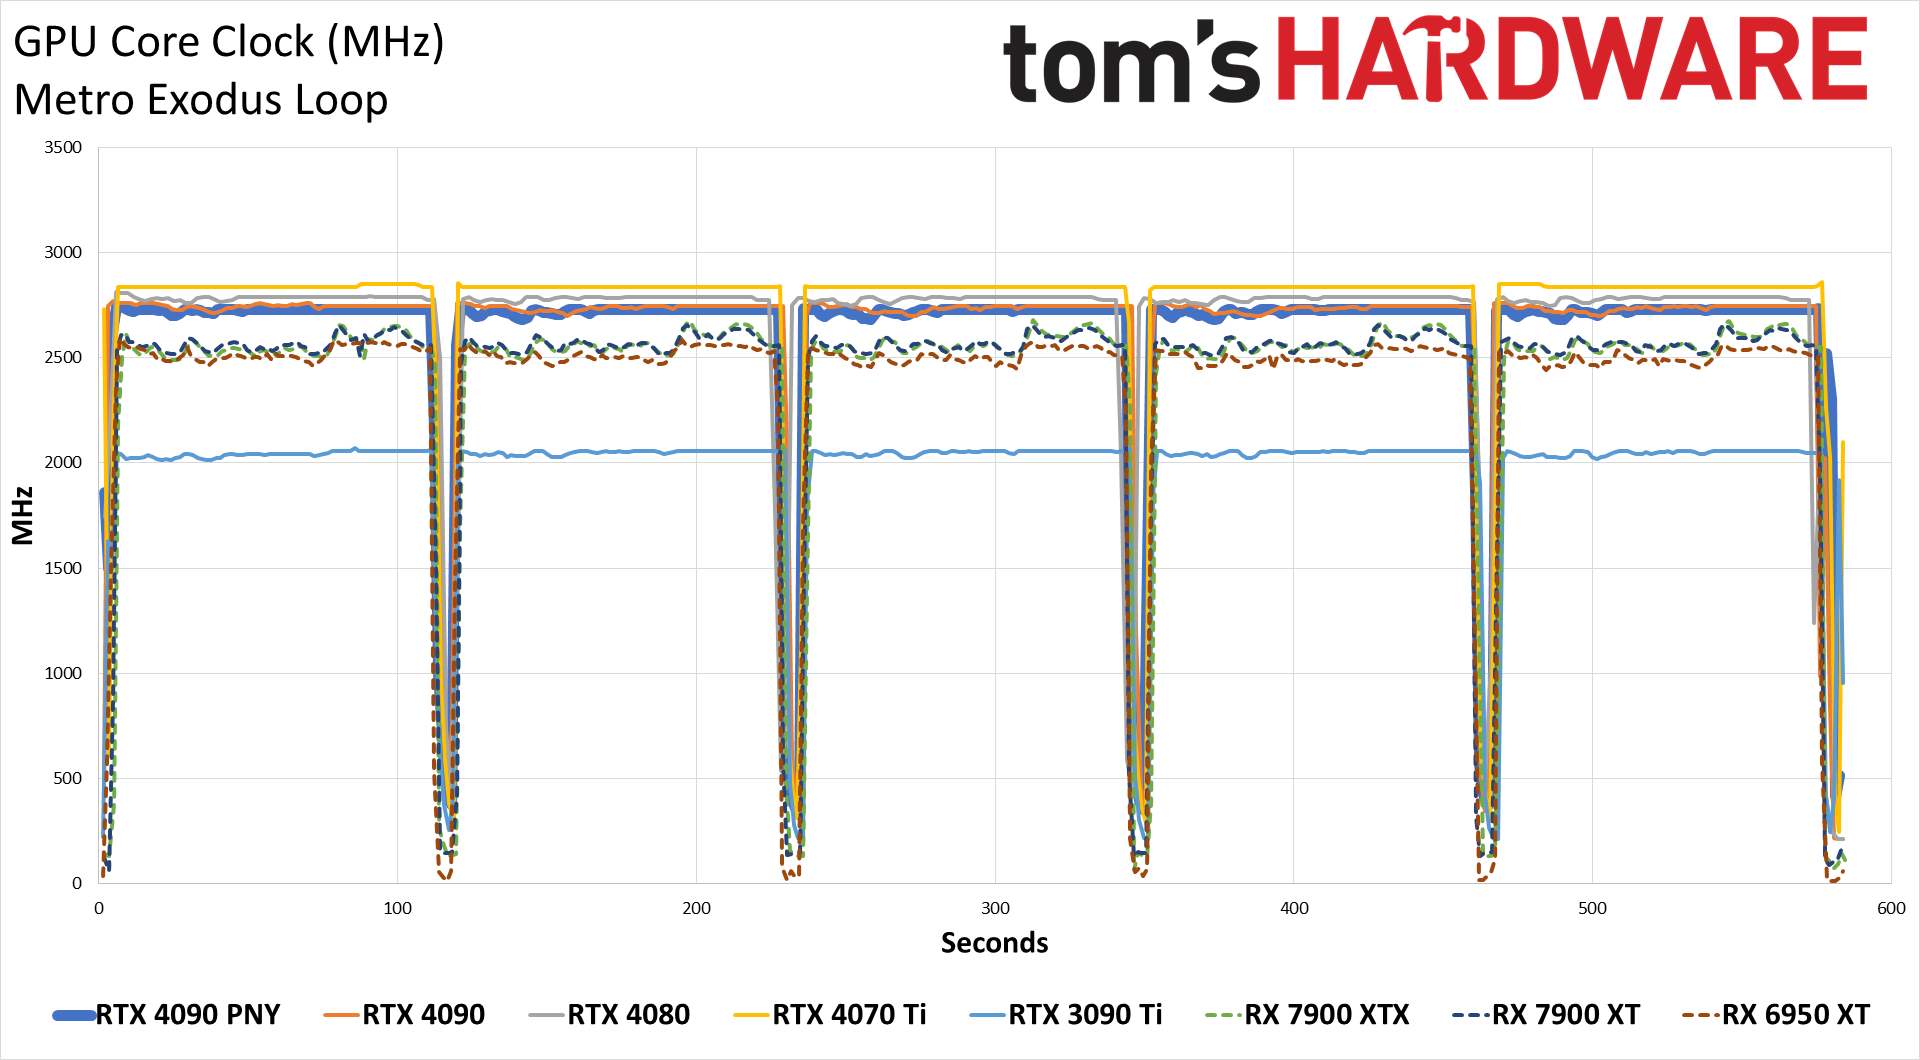
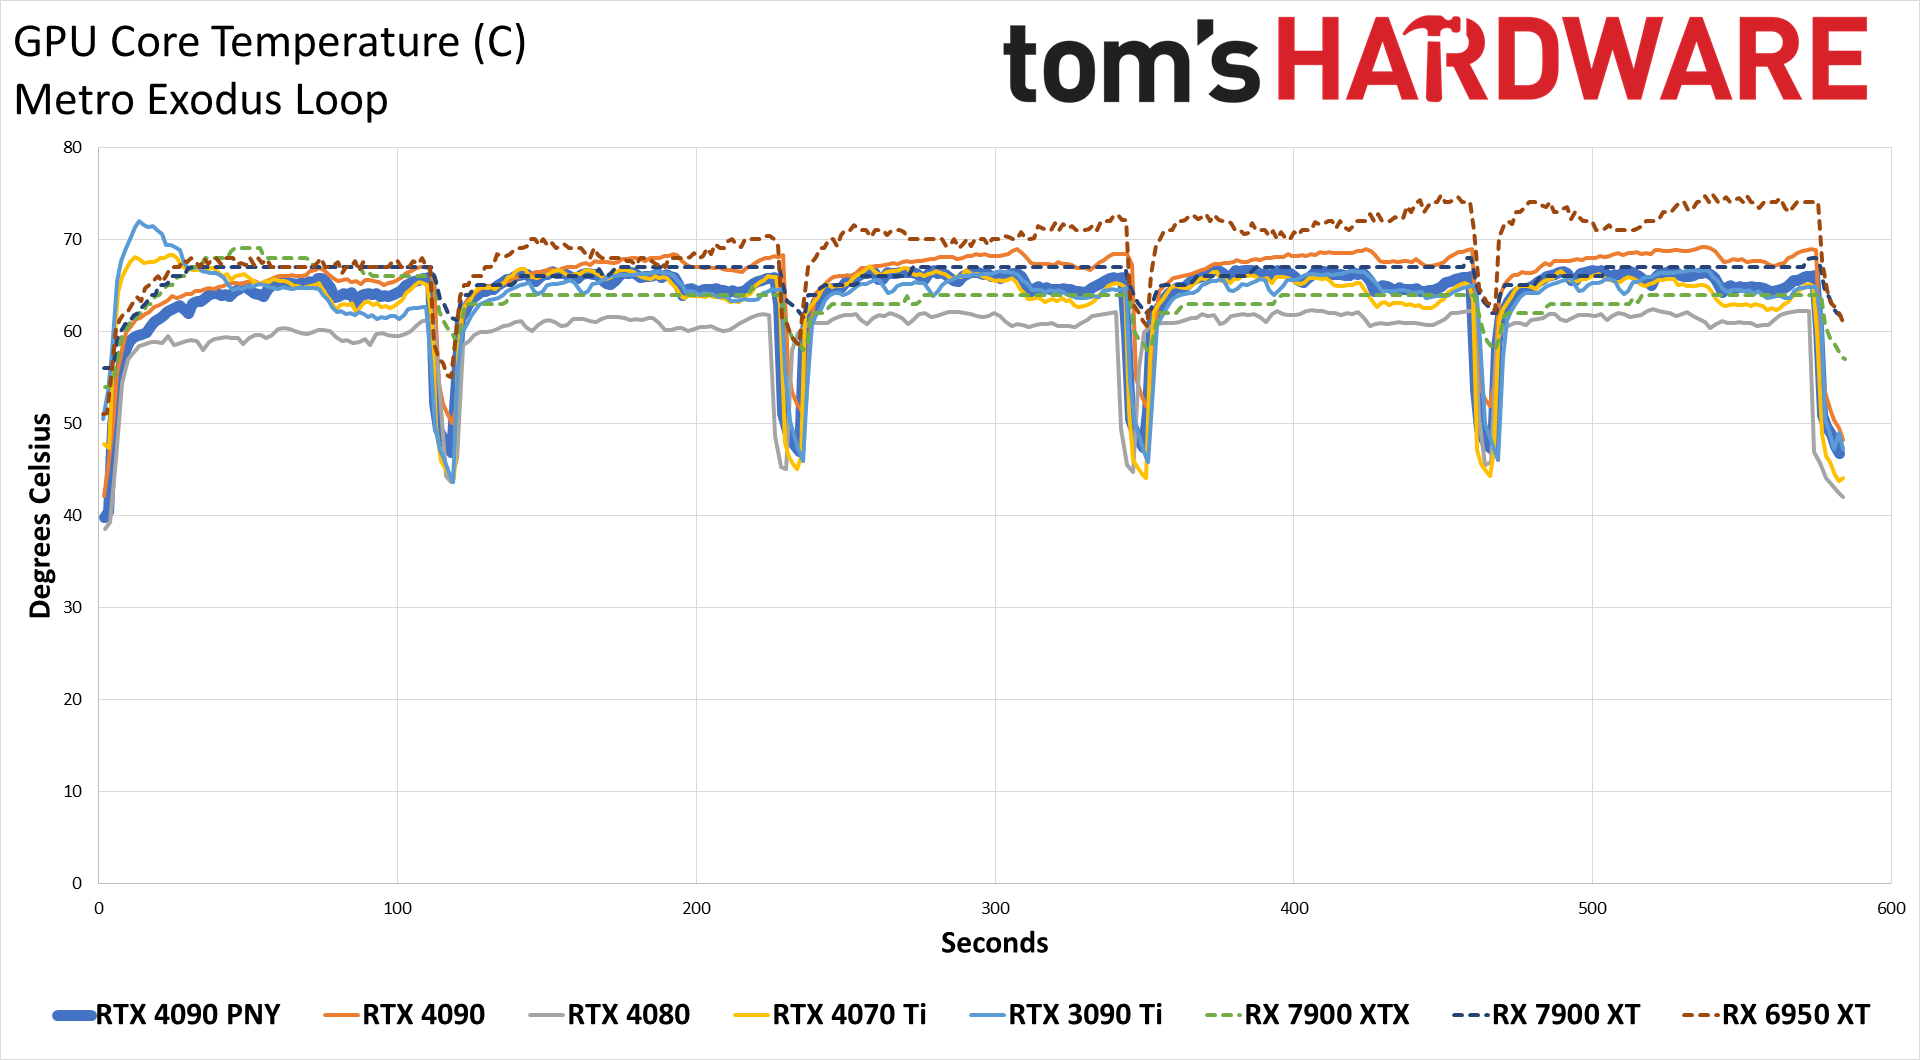
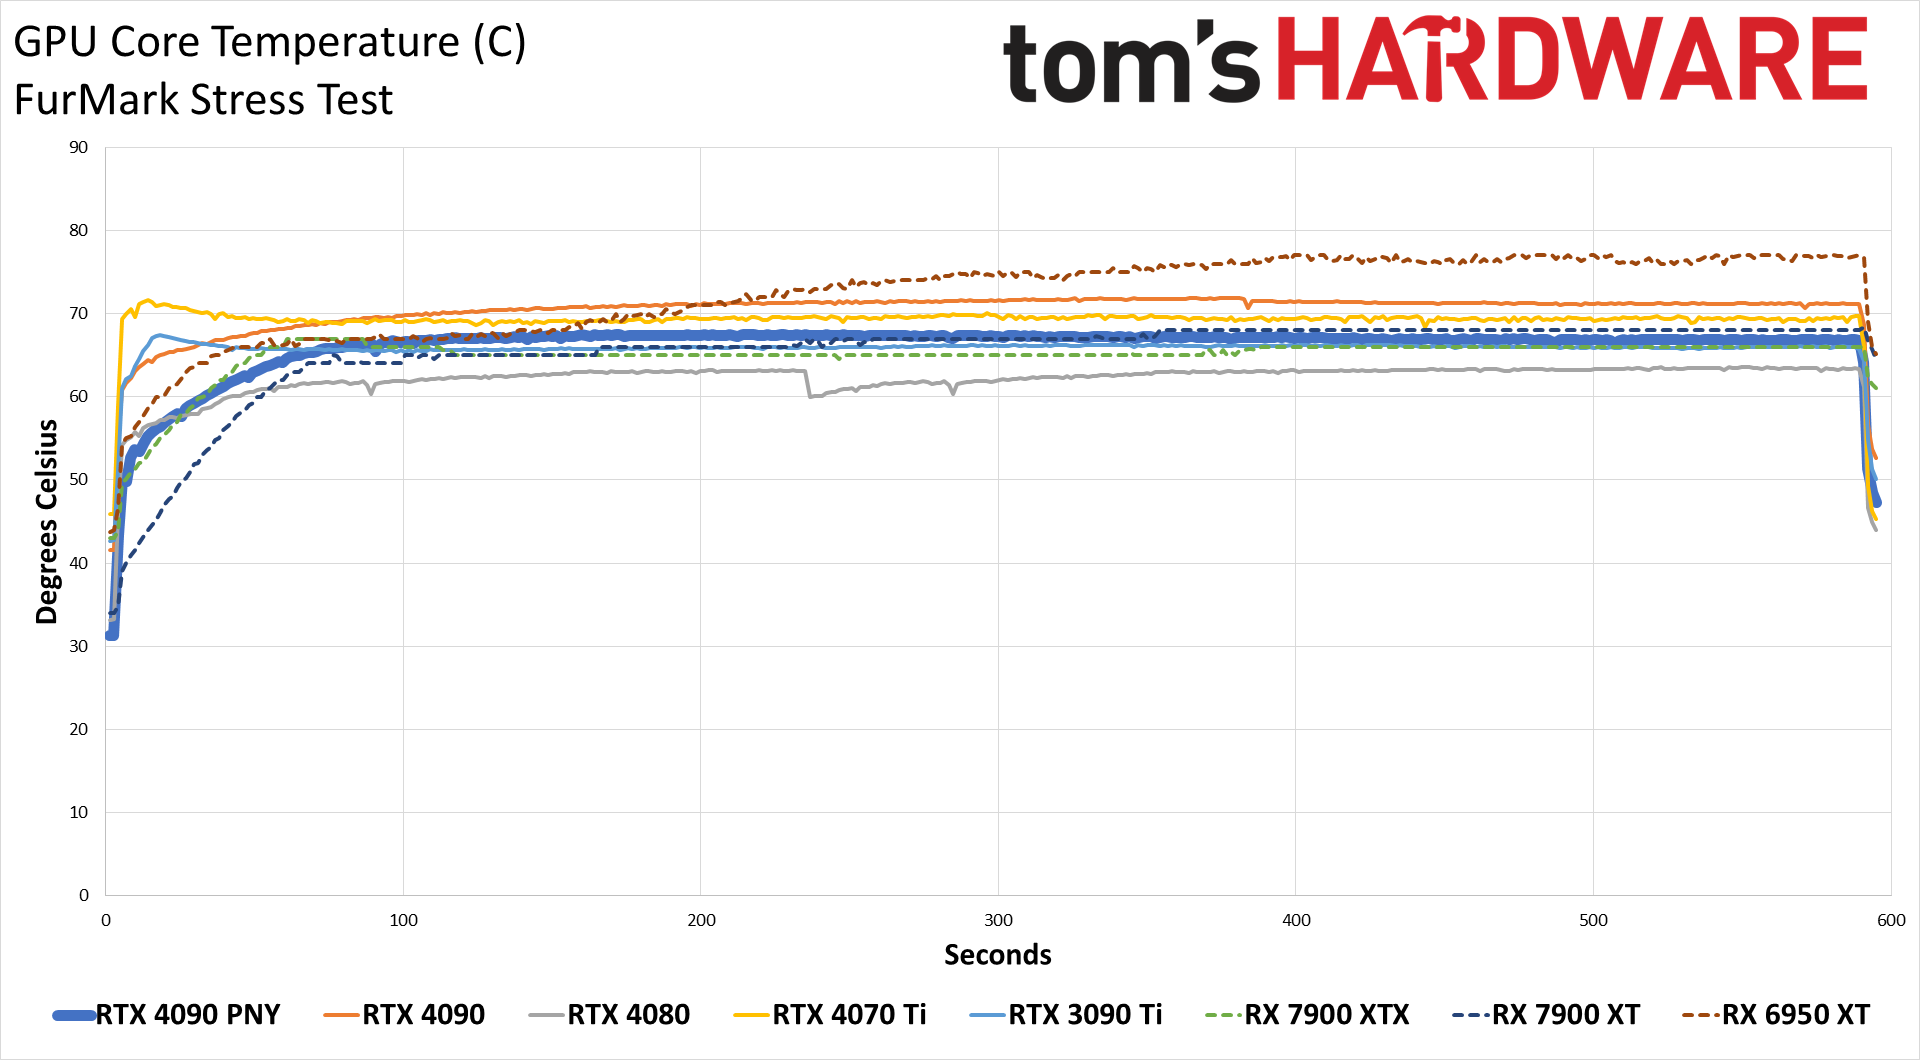
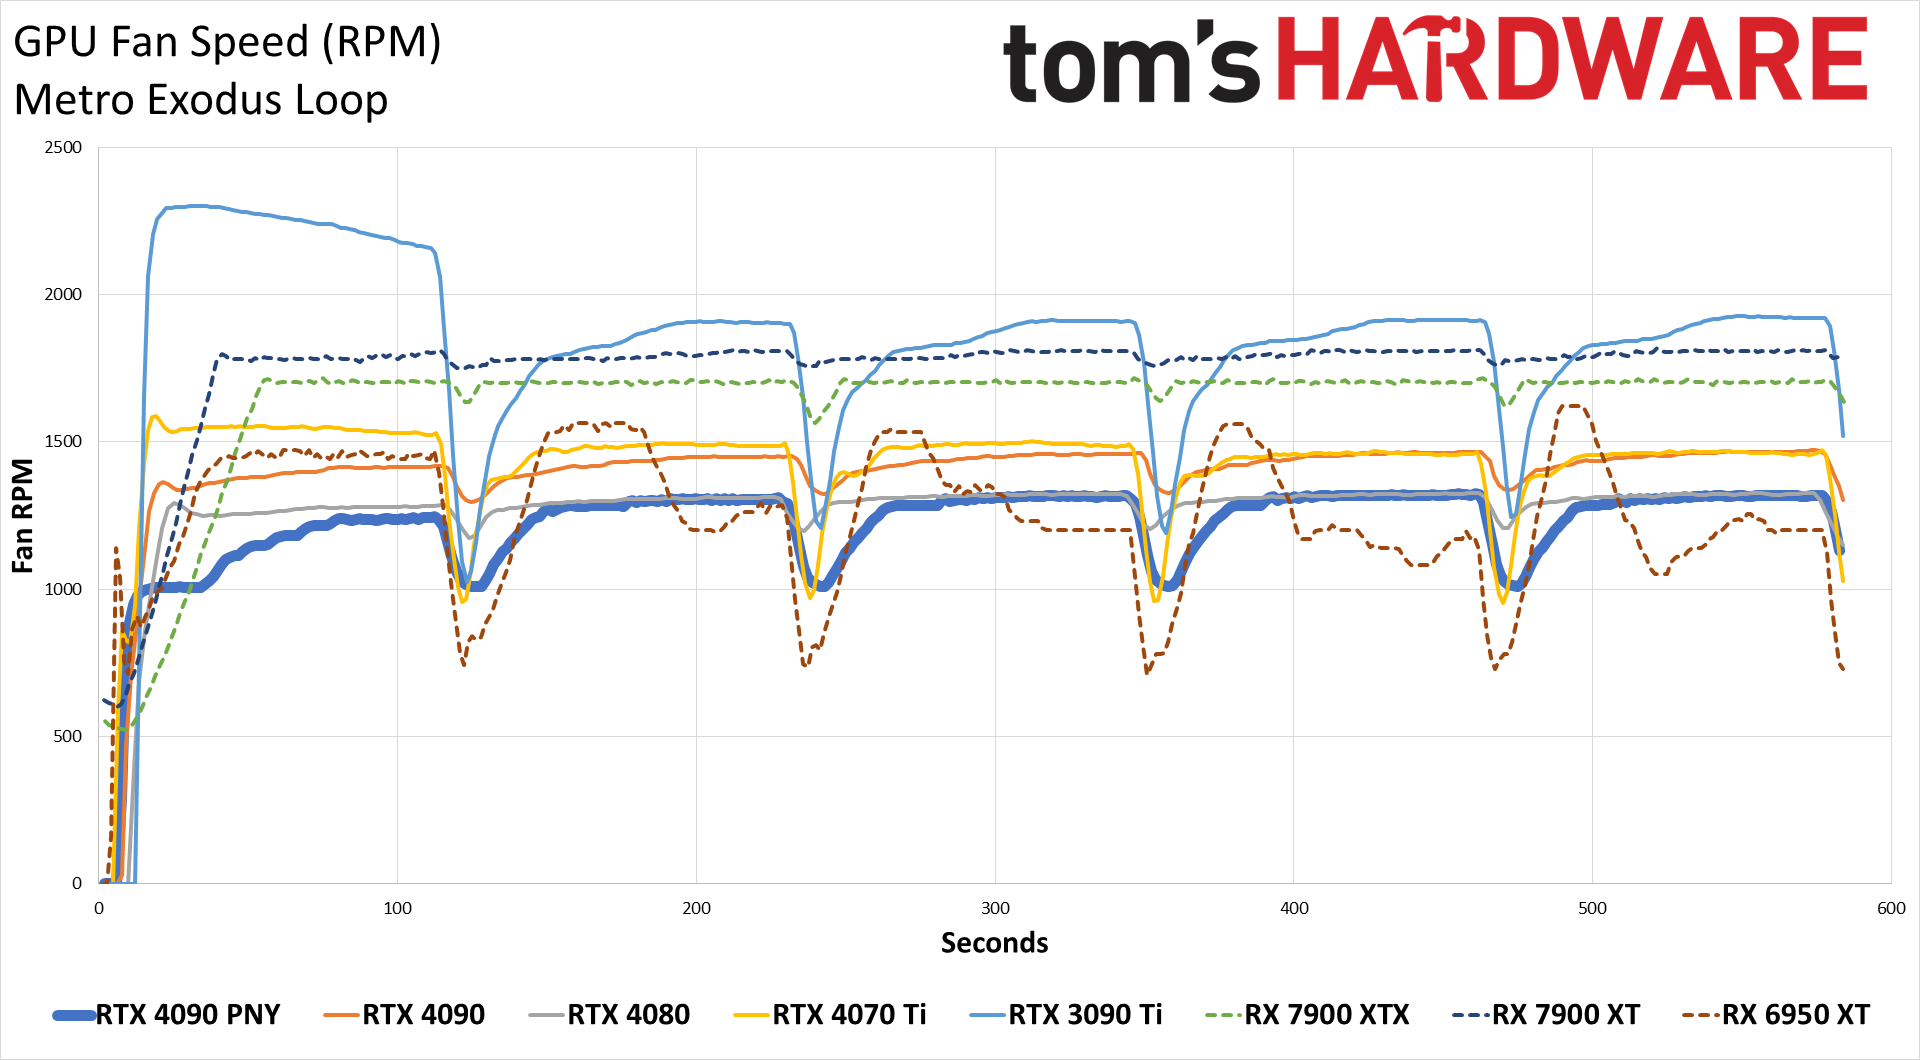
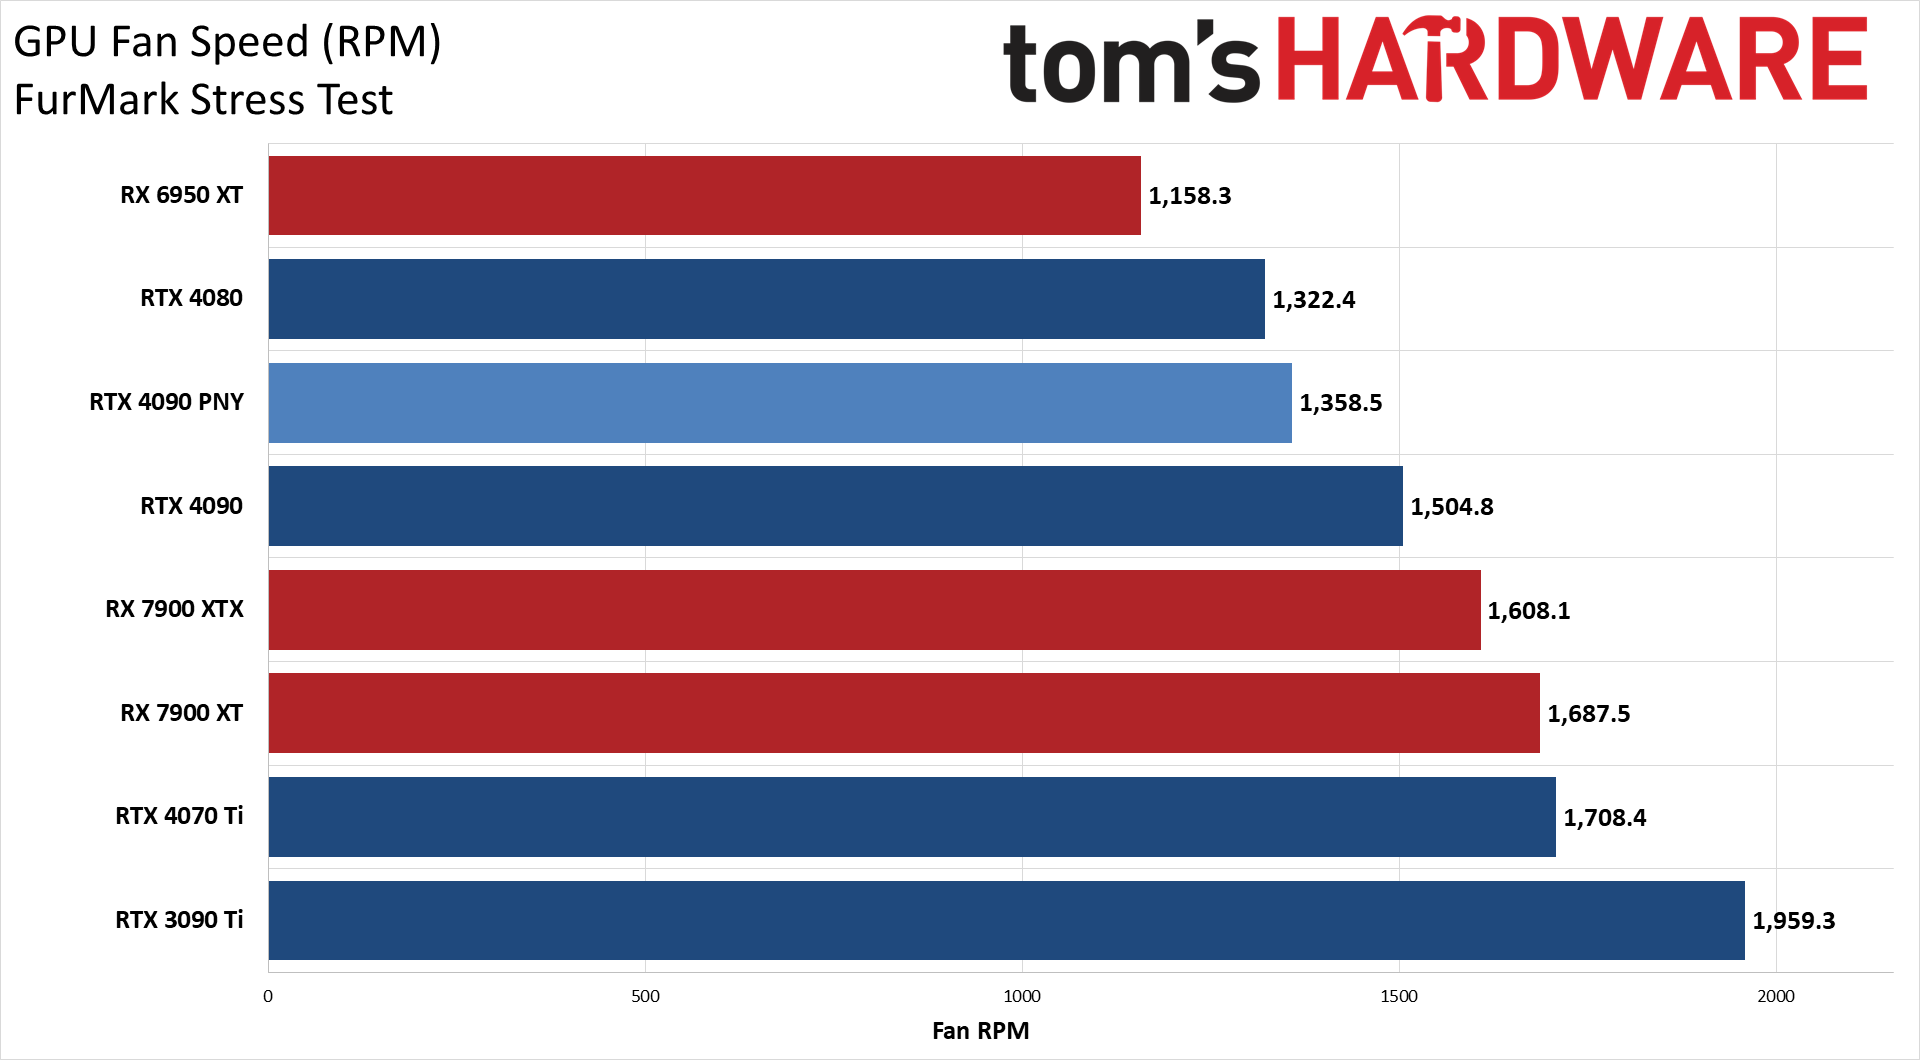
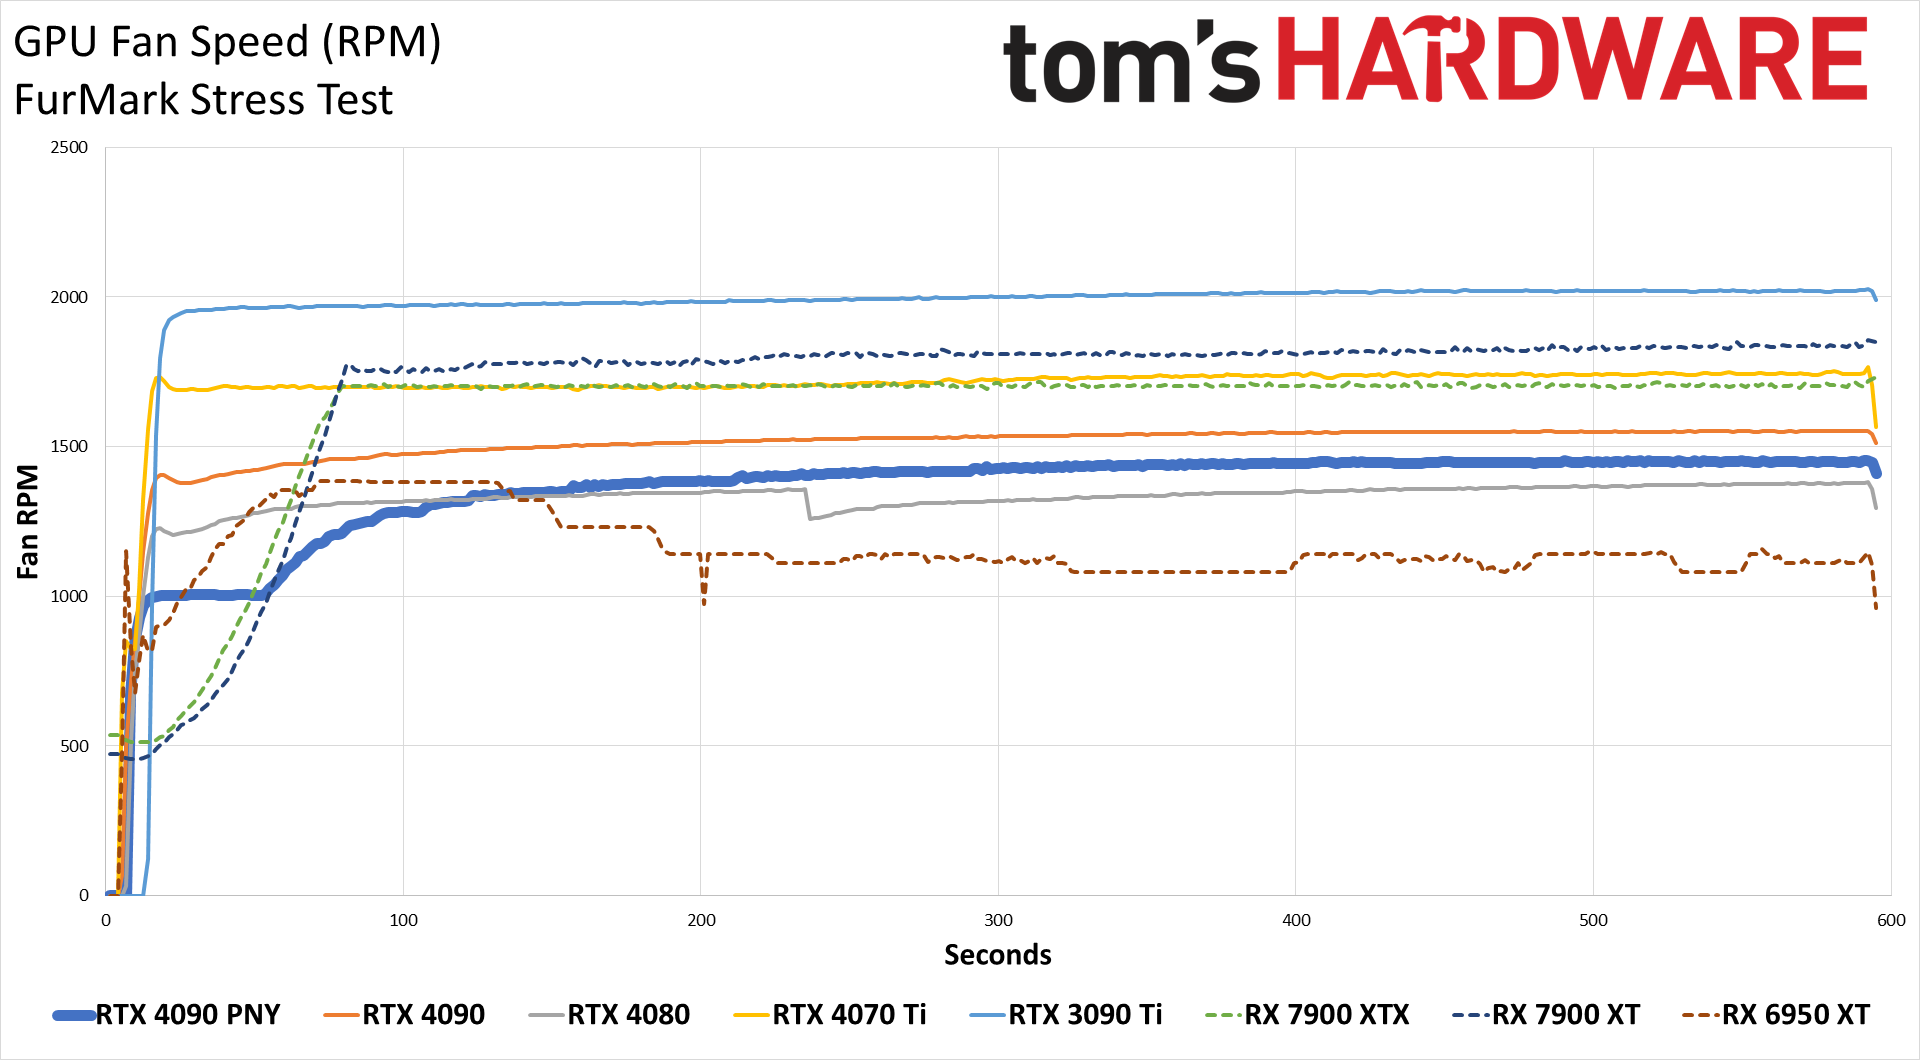
Our previous power testing results are still valid, though they're limited to two scenarios: FurMark and Metro Exodus. Both test scenarios last about 10 minutes, though Metro does have a "break" between loops that allows the GPU to recover slightly.
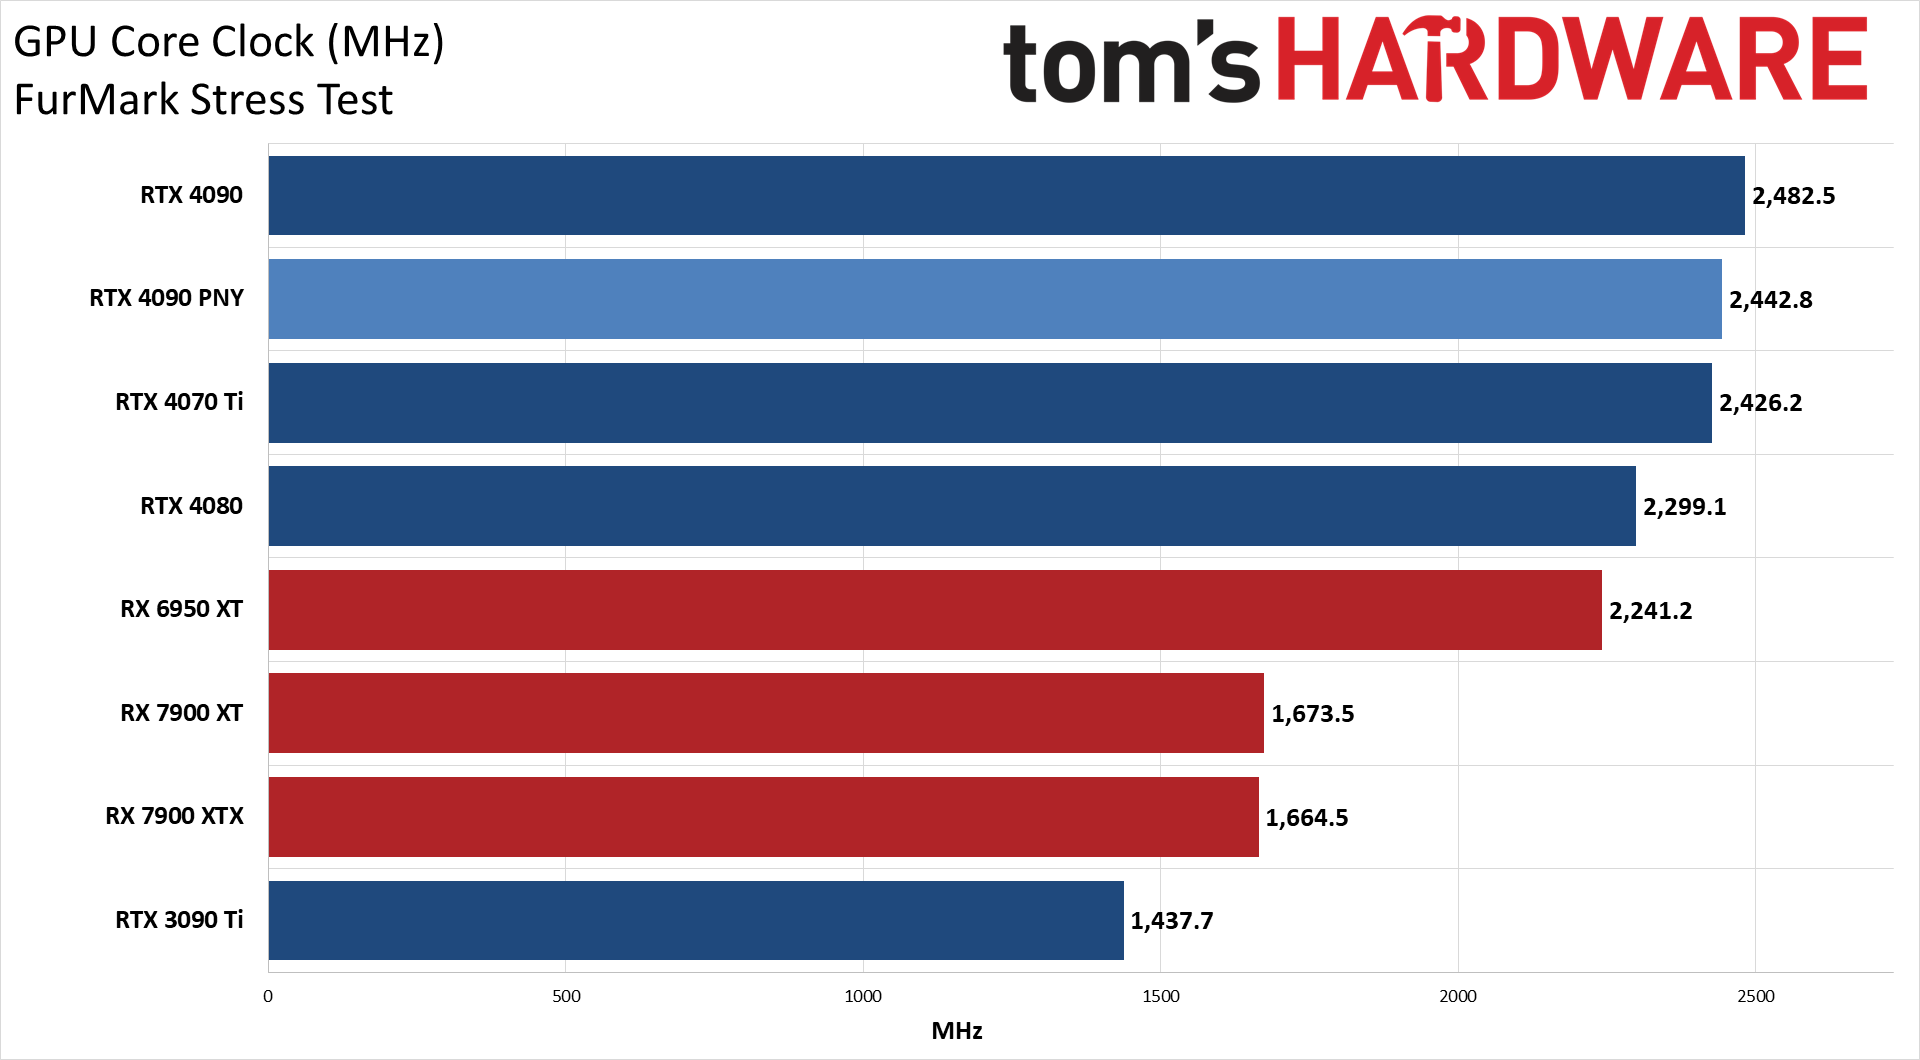
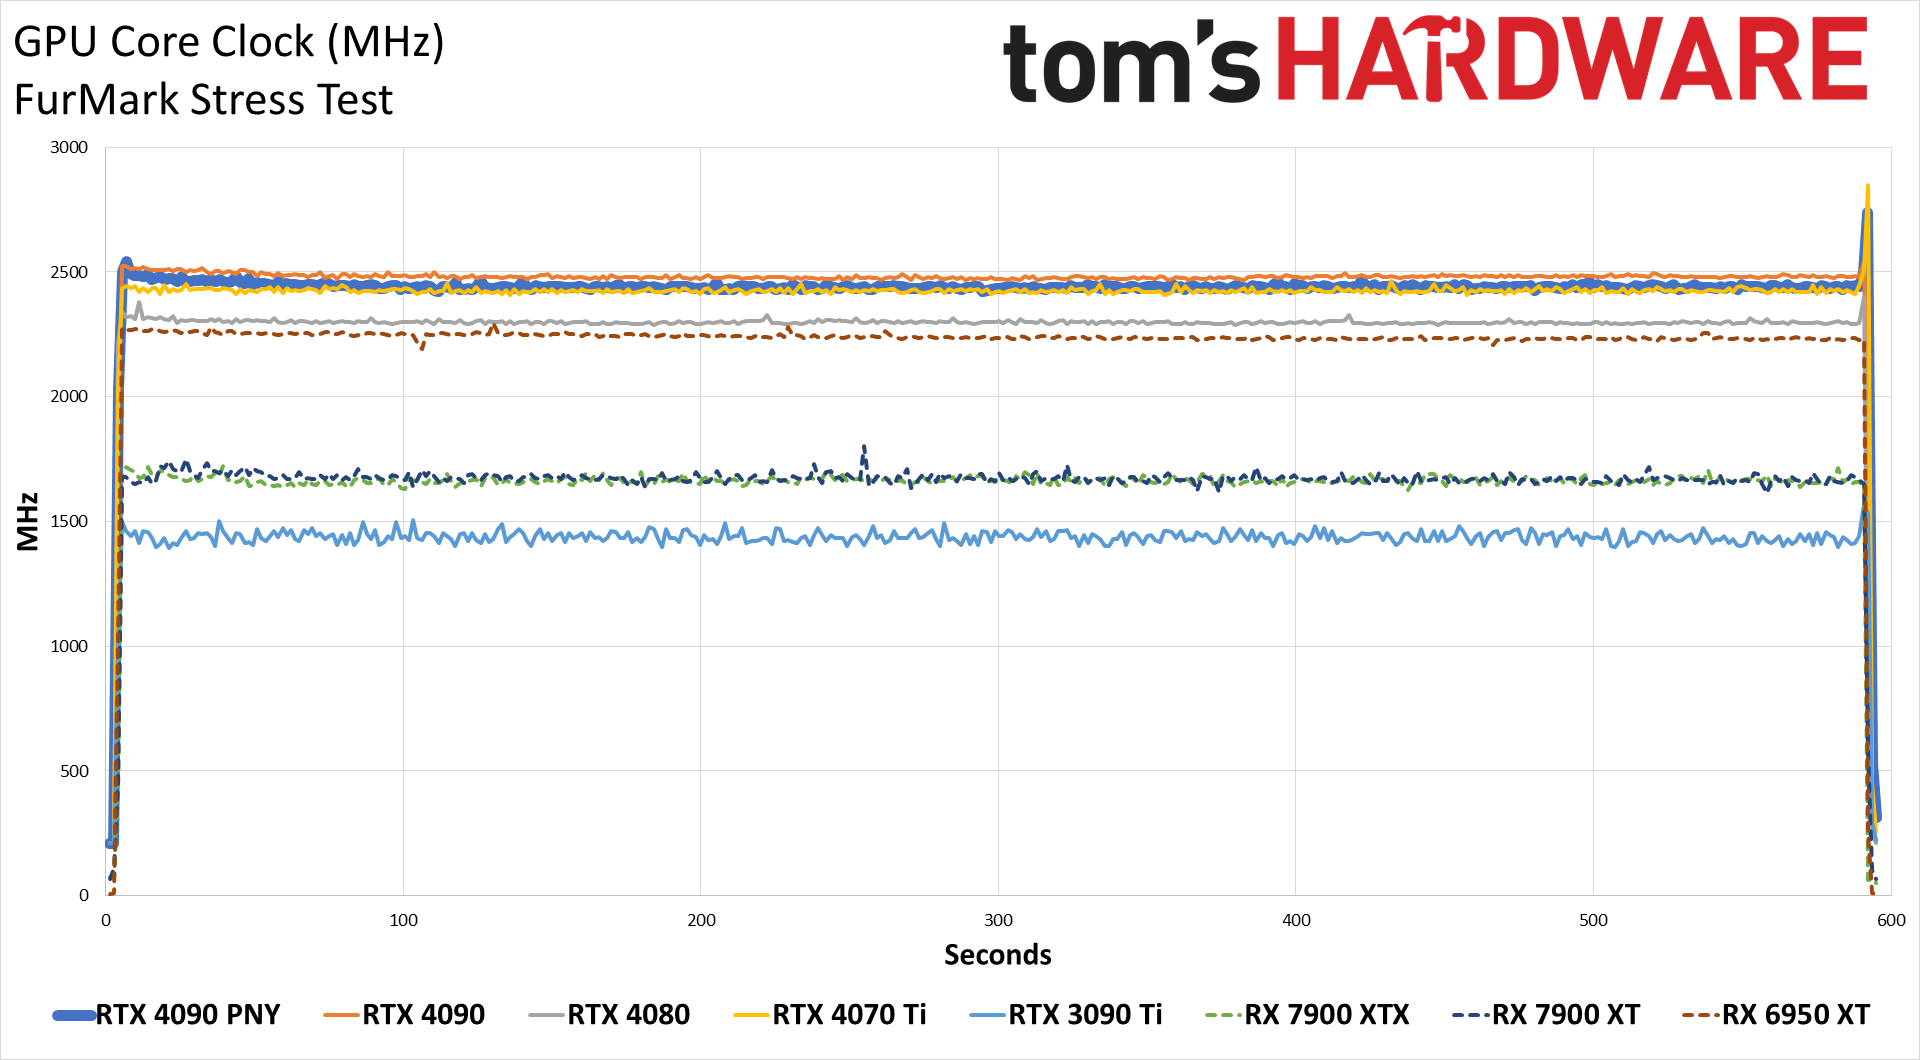
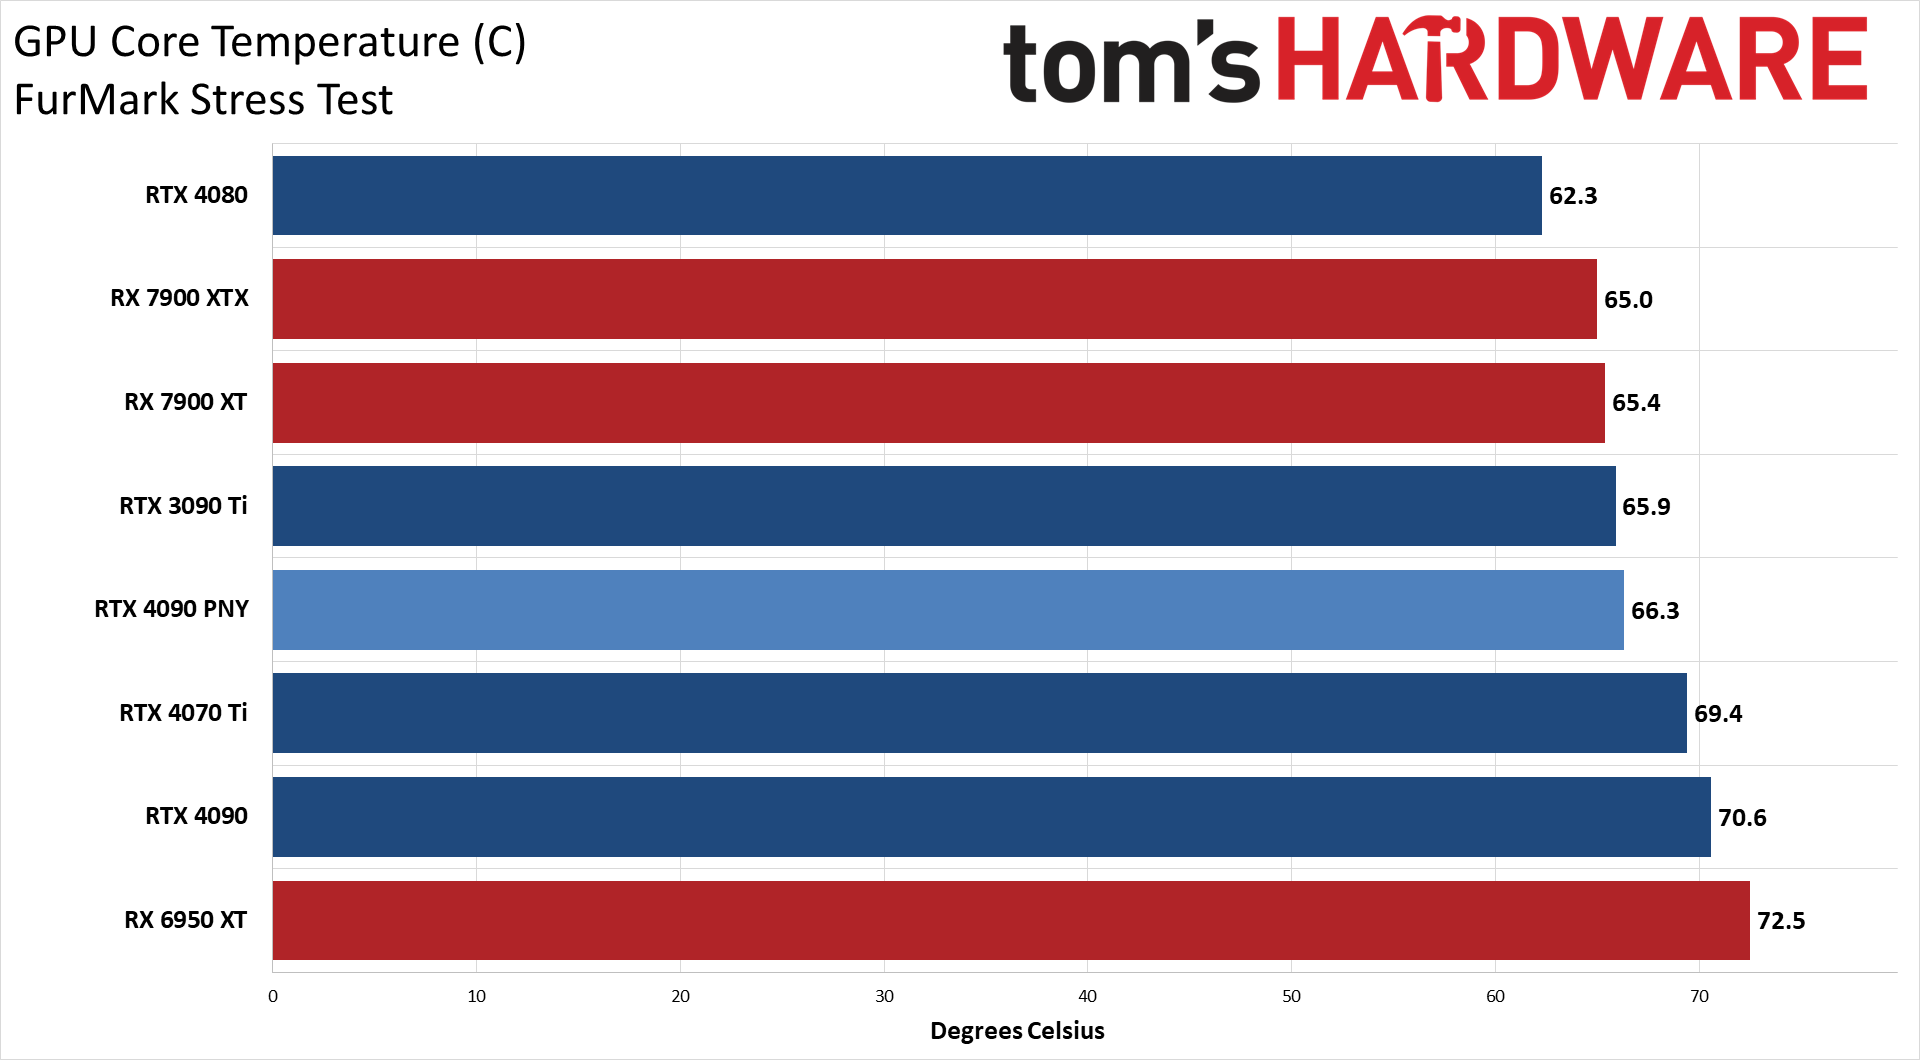
As we've seen elsewhere, PNY's 4090 uses about the same amount of power as the Founders Edition card, coming in about 4W higher on average in Metro Exodus at the 4K extreme setting. In FurMark, the cards are basically tied on power use — no surprise since both exceed the official 450W TBP rating.
Clock speeds tell a similar story, with the Founders Edition averaging just slightly higher clocks in FurMark and Metro. But the real differences are in the temperatures and fan speeds.
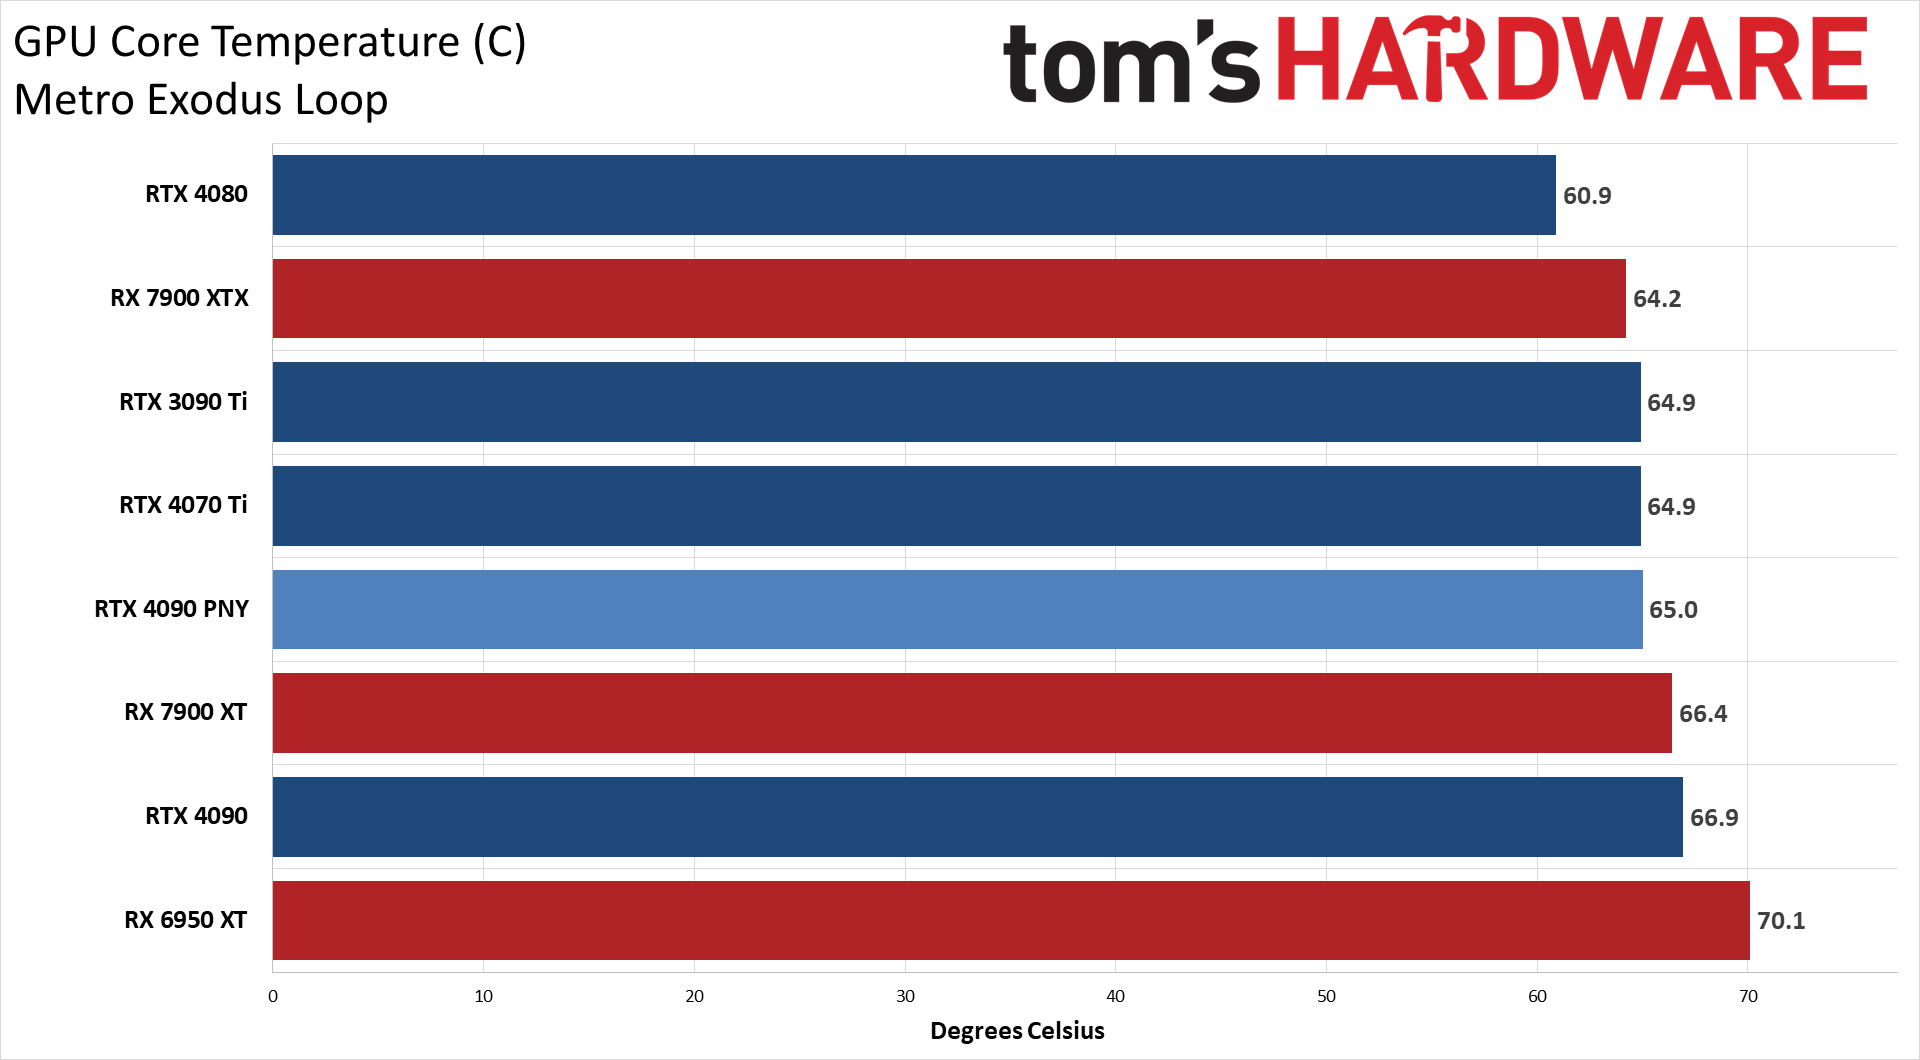
PNY average 65C in Metro on the GPU, and 66C in FurMark. That's not a lot lower than the Founders Edition's 67C and 71C, but it's clearly better. That's especially true when you factor in fan speeds.
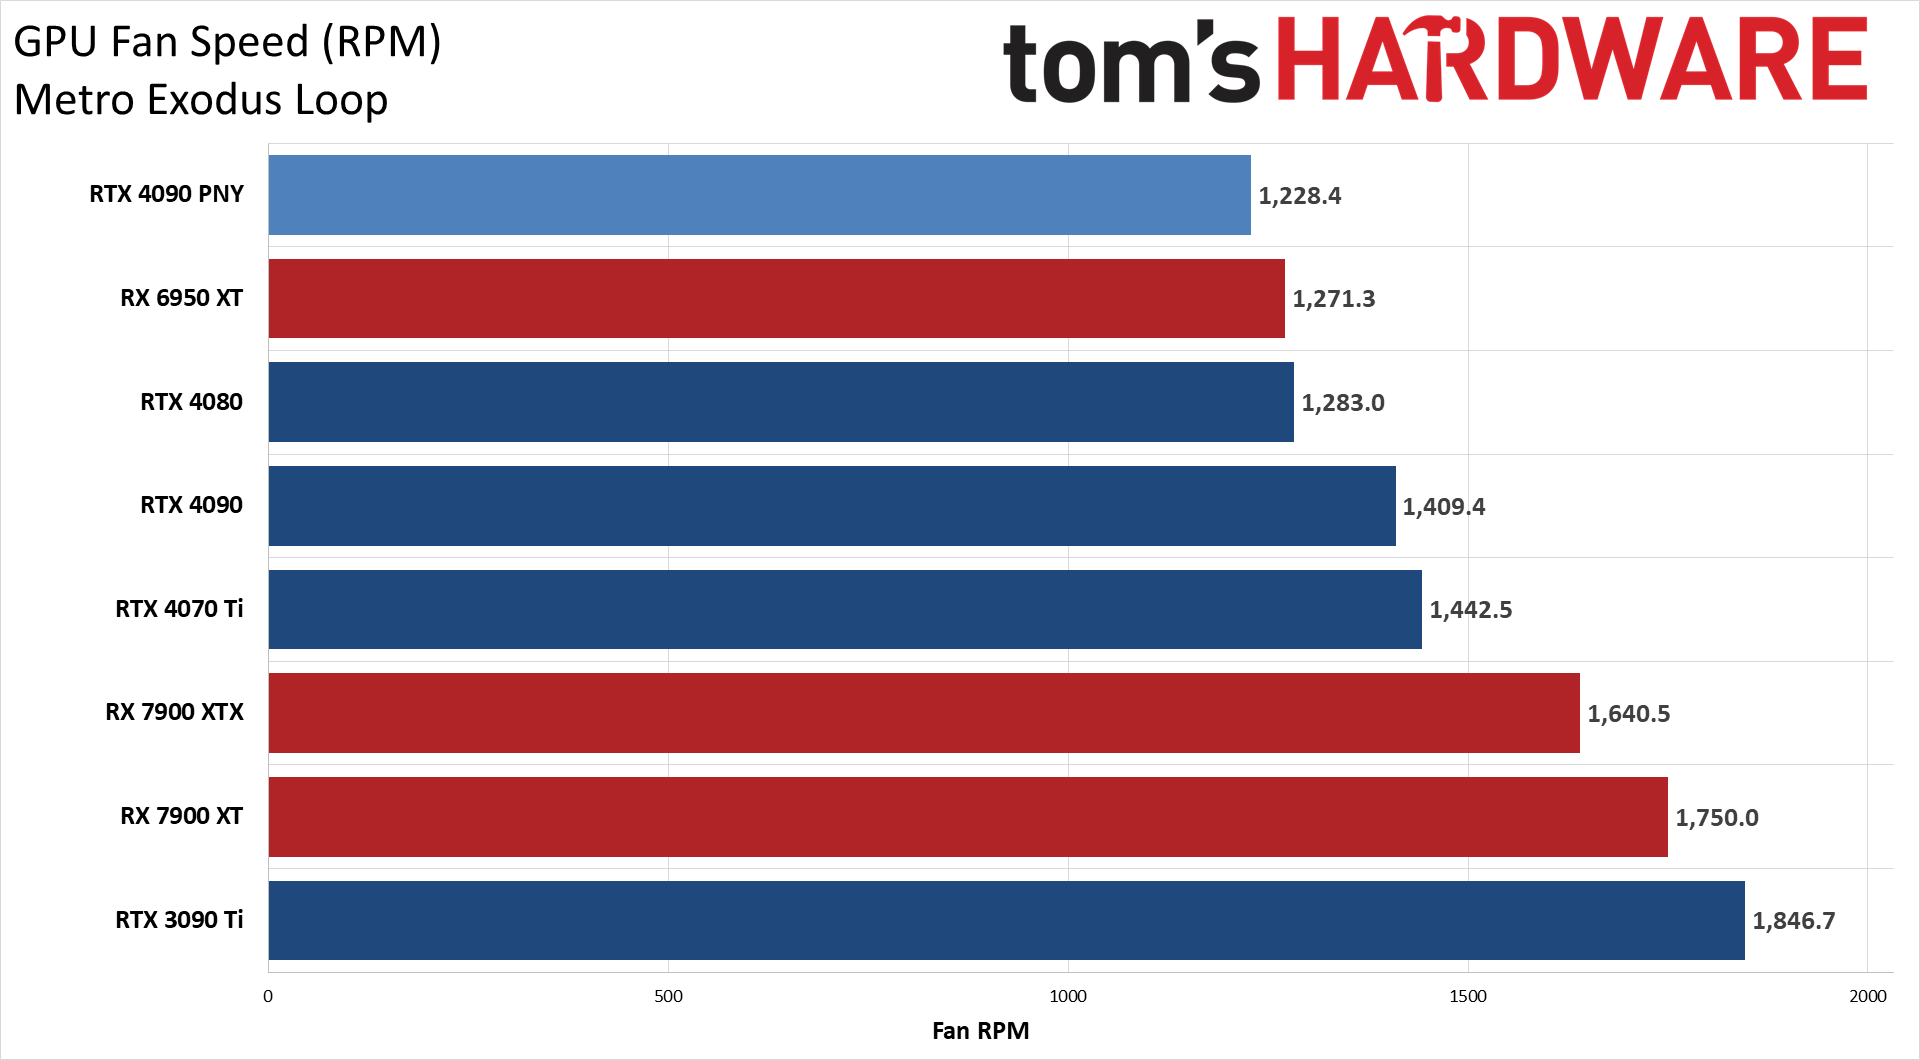
The 4090 Founders Edition already showed a good fan speed result of just 1409 RPM in Metro and 1505 RPM in FurMark, but PNY beats it in both cases. With FurMark, fan speed averaged 1359 RPM while Metro dropped to just 1228 RPM. That's about 37% fan speed, with plenty of room to go higher if needed — which is what we did with our overclocking tests, where fan speeds were in the 70% range.
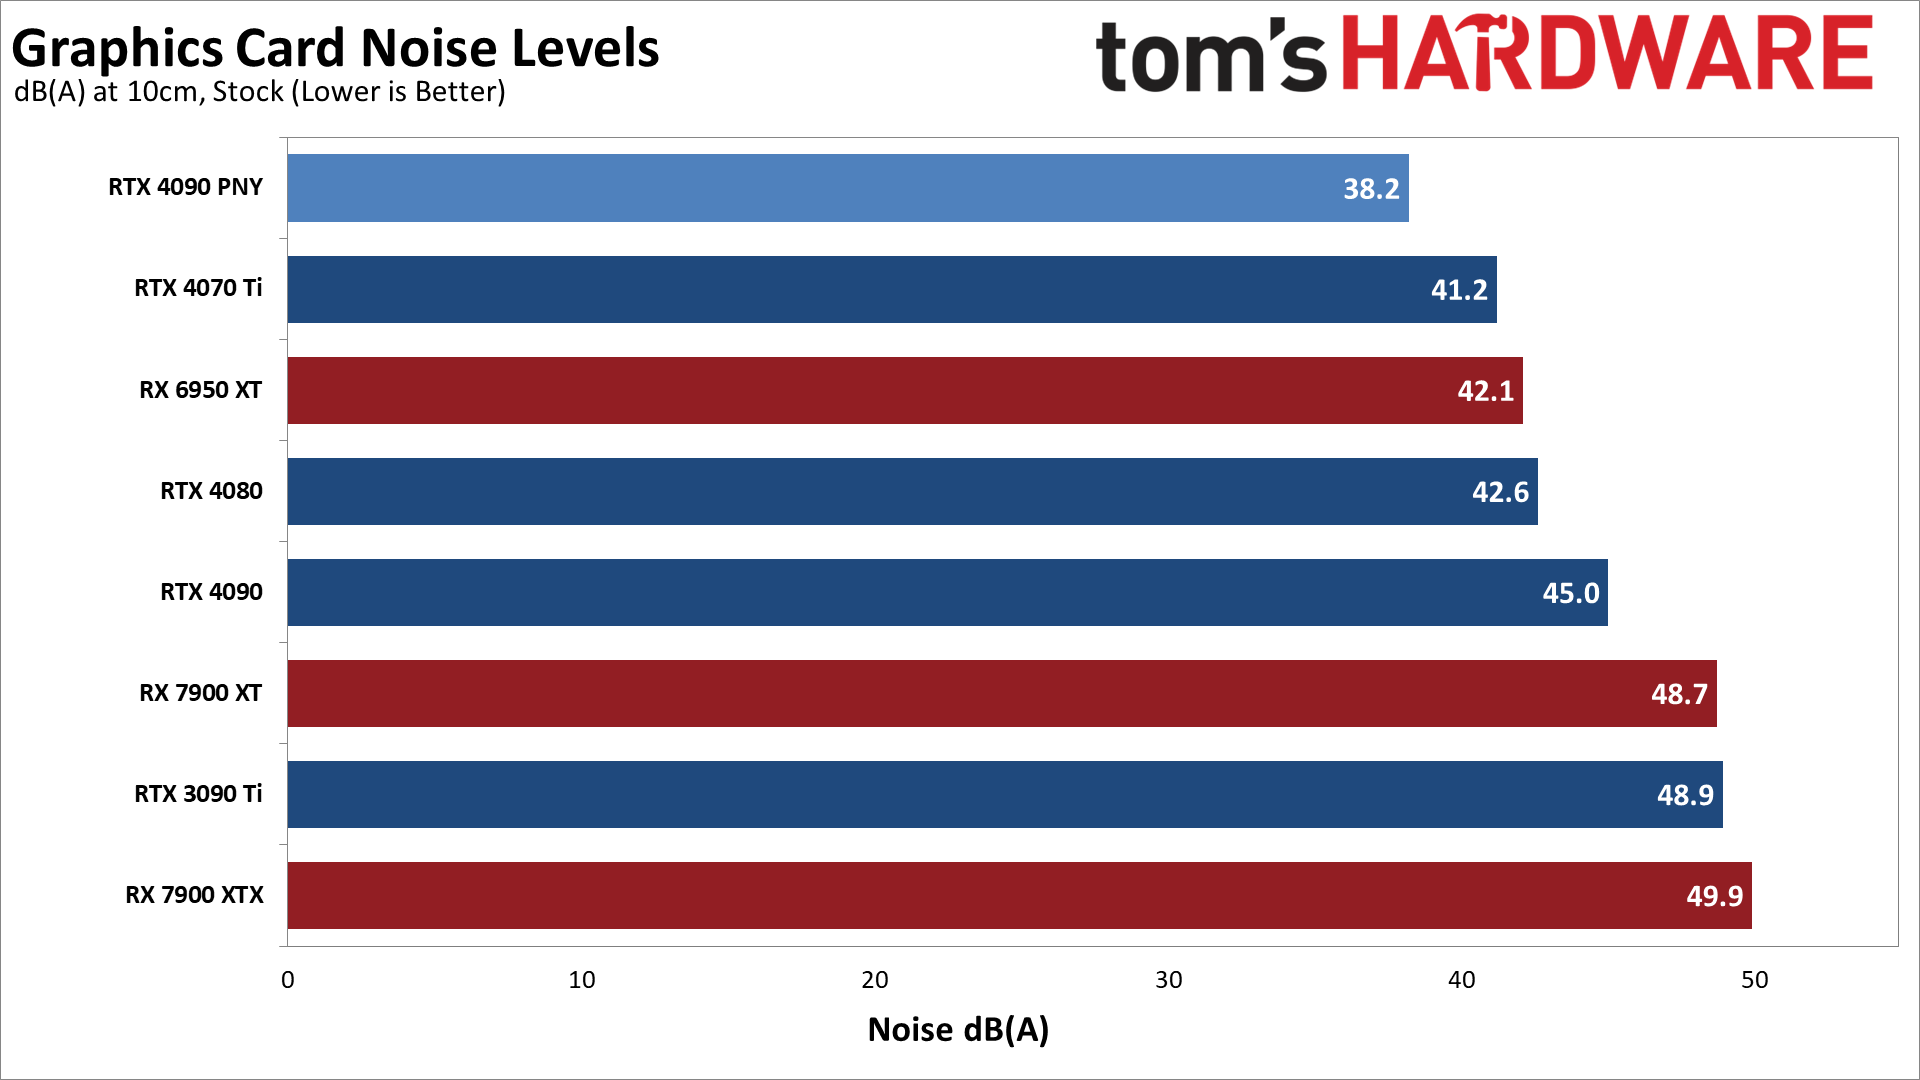
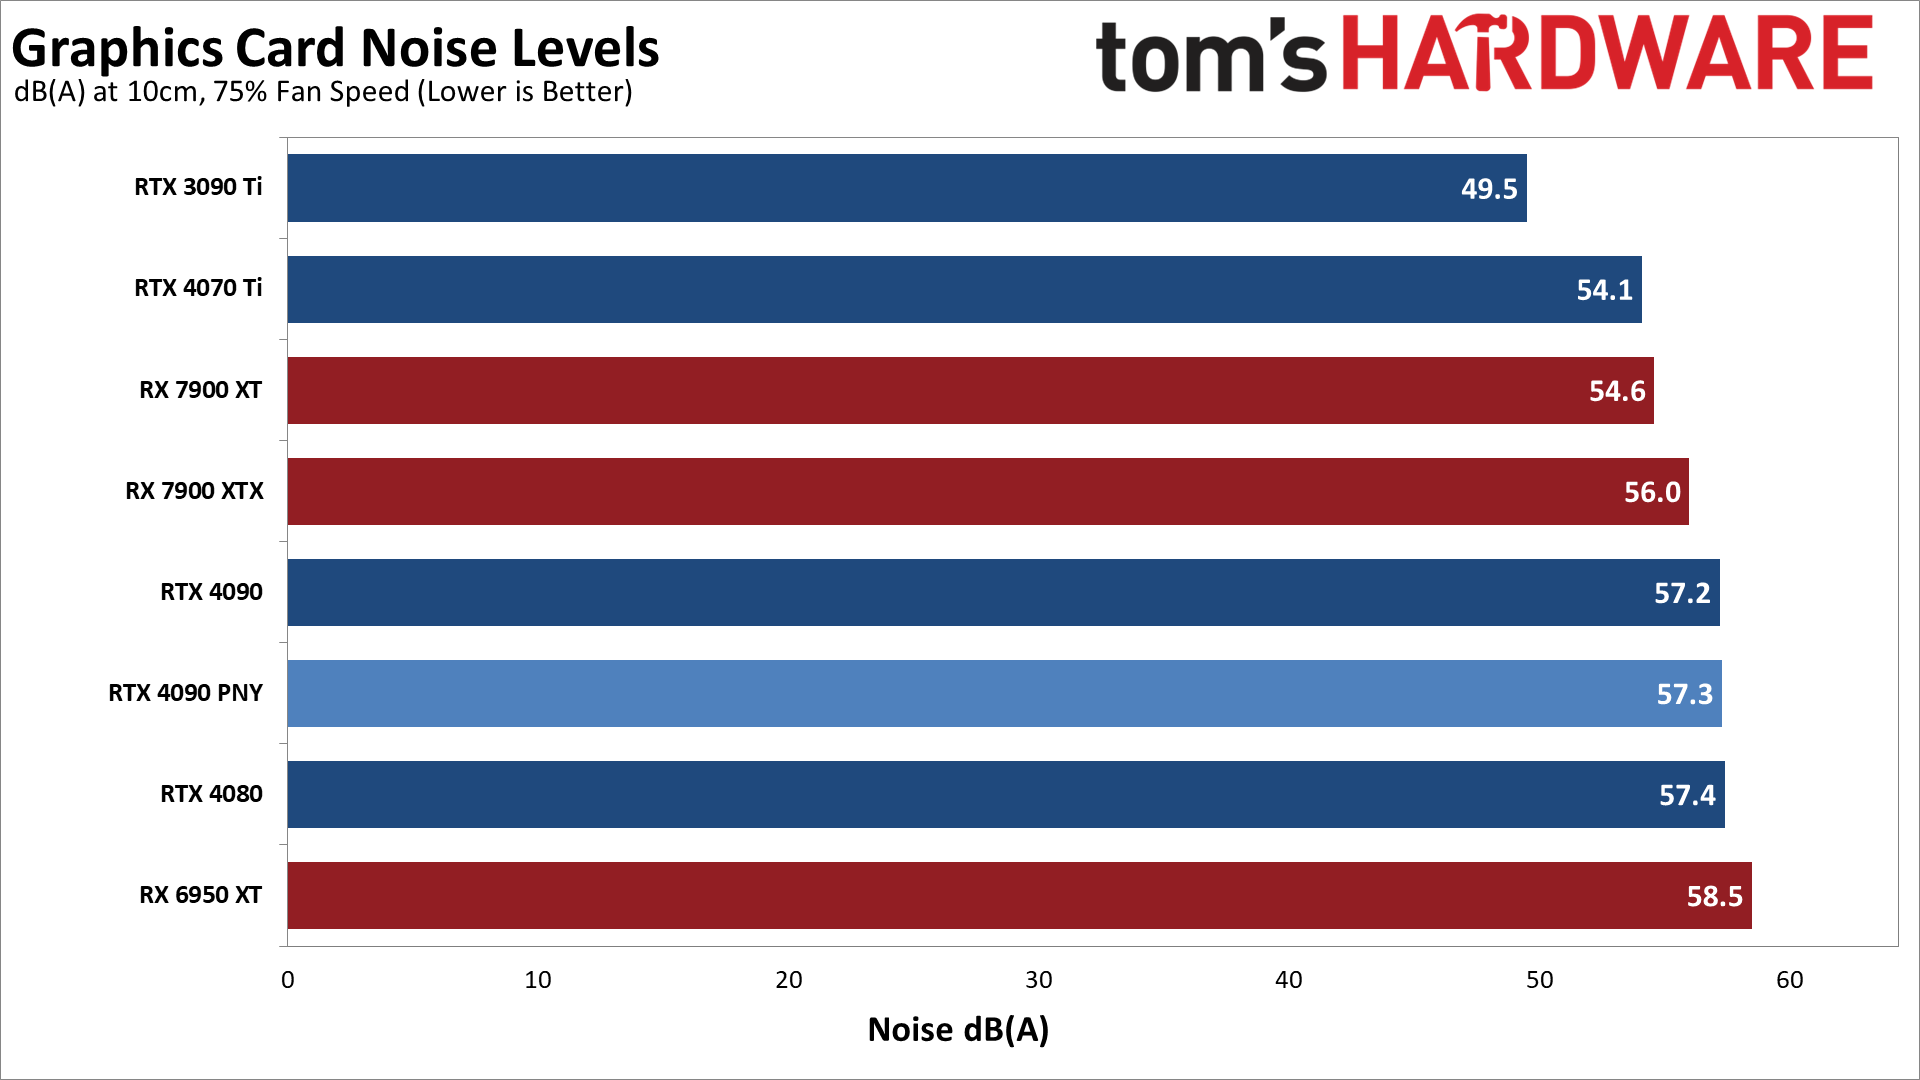
Lower fan speeds mean less noise, and we test noise levels using an SPL (sound pressure level) meter placed 10cm from the card, with the mic aimed right at the center fan. This helps minimize the impact of other noise sources like the fans on the CPU cooler. The noise floor of our test environment and equipment is around 32 dB(A) with the PC powered on (the CPU cooler fans create a small amount of noise).
After running Metro for over 15 minutes, the PNY RTX 4090 settled in at a fan speed of 37% and a noise level of 38.2 dB(A). That's substantially better than the Founders Edition, which measured 45.0 dB(A) in the same test.
We also tested with a static fan speed of 75%, where the PNY generated 57.3 dB(A) of noise, but without overclocking or changing the fan speed curve, it's unlikely you'd ever see such levels. In fact, PNY seems to have tuned the card to stay below 50% fan speed based on our testing.
- MORE: Best Graphics Cards
- MORE: GPU Benchmarks and Hierarchy
- MORE: All Graphics Content
Get Tom's Hardware's best news and in-depth reviews, straight to your inbox.
Current page: PNY RTX 4090 XLR8 RGB: Power, Clocks, Temps, Fans, and Noise
Prev Page PNY RTX 4090 XLR8 RGB: 1440p Gaming Performance Next Page PNY RTX 4090 XLR8 RGB: Better Than Reference
Jarred Walton is a senior editor at Tom's Hardware focusing on everything GPU. He has been working as a tech journalist since 2004, writing for AnandTech, Maximum PC, and PC Gamer. From the first S3 Virge '3D decelerators' to today's GPUs, Jarred keeps up with all the latest graphics trends and is the one to ask about game performance.
-
colossusrage It would be great if you guys could include the RTX 3080 and RX 6800XT when comparing these top tier cards.Reply -
Avro Arrow Reply
I agree. Those are easily the top two high-end cards when it comes to popularity.colossusrage said:It would be great if you guys could include the RTX 3080 and RX 6800XT when comparing these top tier cards.
