Samsung 960 EVO NVMe SSD Review
Why you can trust Tom's Hardware
1TB NVMe SSD Performance Results
Comparison Products
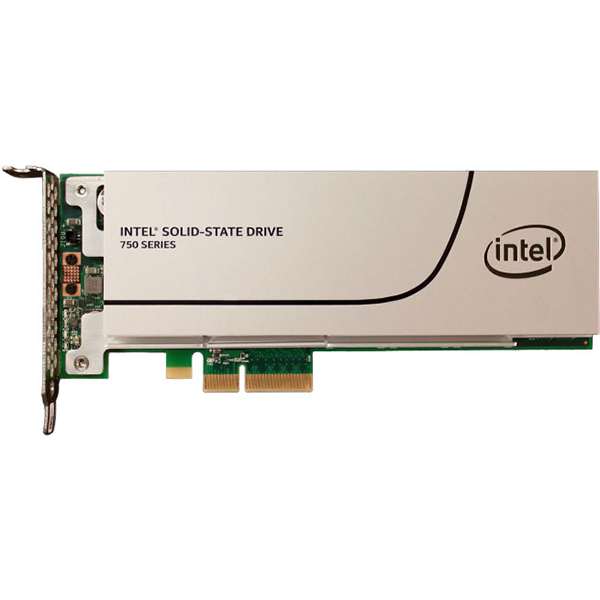
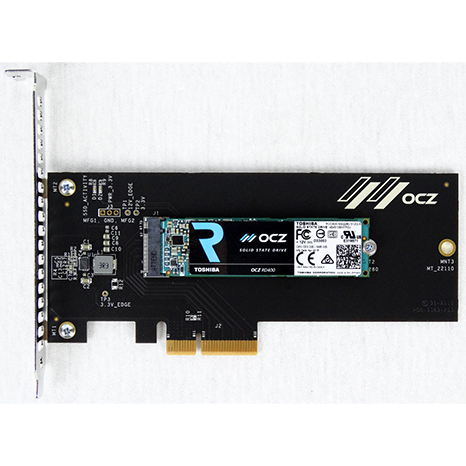
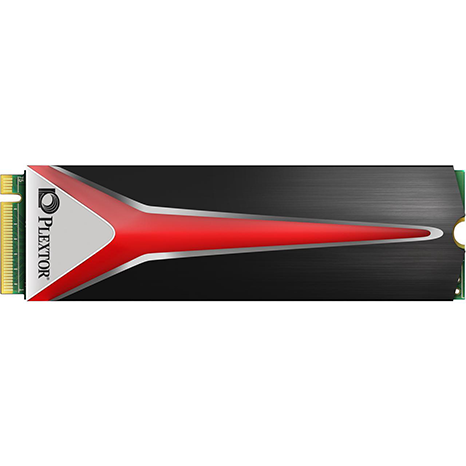
We have the 960 EVO in two capacities for our launch coverage. Samsung supplied us with the high-capacity 1TB and the small 250GB model. The drives couldn't be more different in both performance and how it translates to the user. We tested the 960 EVO products with Samsung's new 2.0 driver, but we didn't have time to run the full test suite on the 960 Pro or SM961 with the new driver.
Our 1TB coverage includes all of the shipping 1TB-class NVMe SSDs except for the 960 Pro. We also include the 960 Pro 2TB. The 960 EVO is the only product sold as a mainstream product, while the rest of the 1TB SSDs fall under the premium banner.
The Plextor M8Pe ships in three configurations that differ by the cooling capacity. We used the M8Pe(Y) add-in card version for all but the notebook tests. The notebook test uses the M8Pe(G) model with a thin heatsink over the M.2 2280 form-factor drive.
Sequential Read Performance
To read about our storage tests in-depth, please check out How We Test HDDs And SSDs. We cover four-corner testing on page six of our How We Test guide.
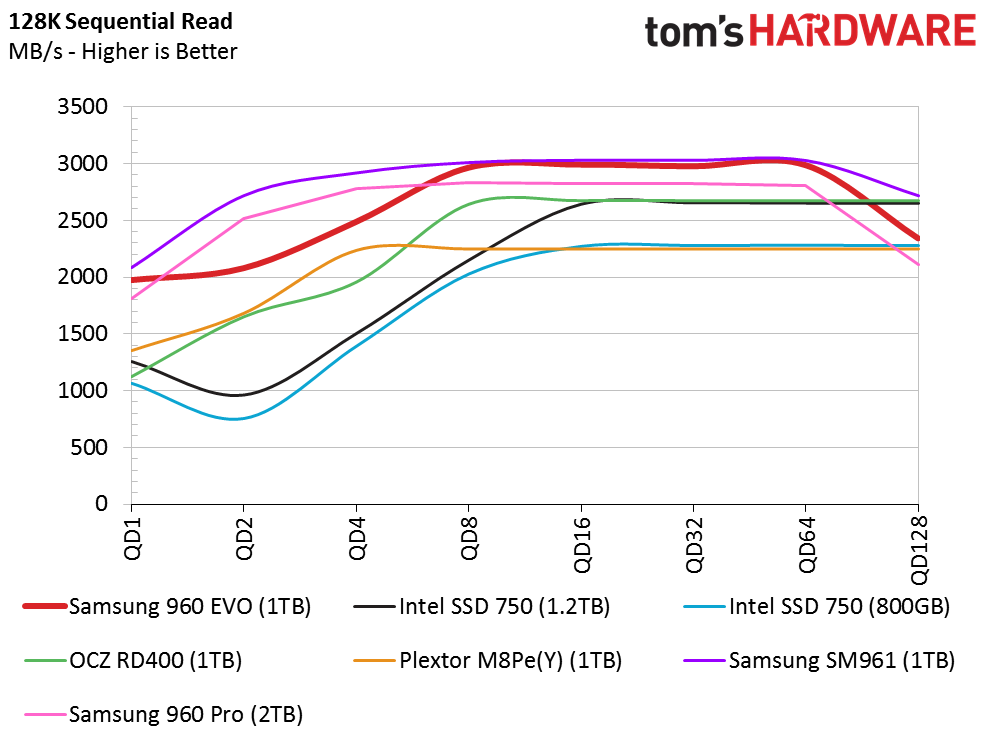
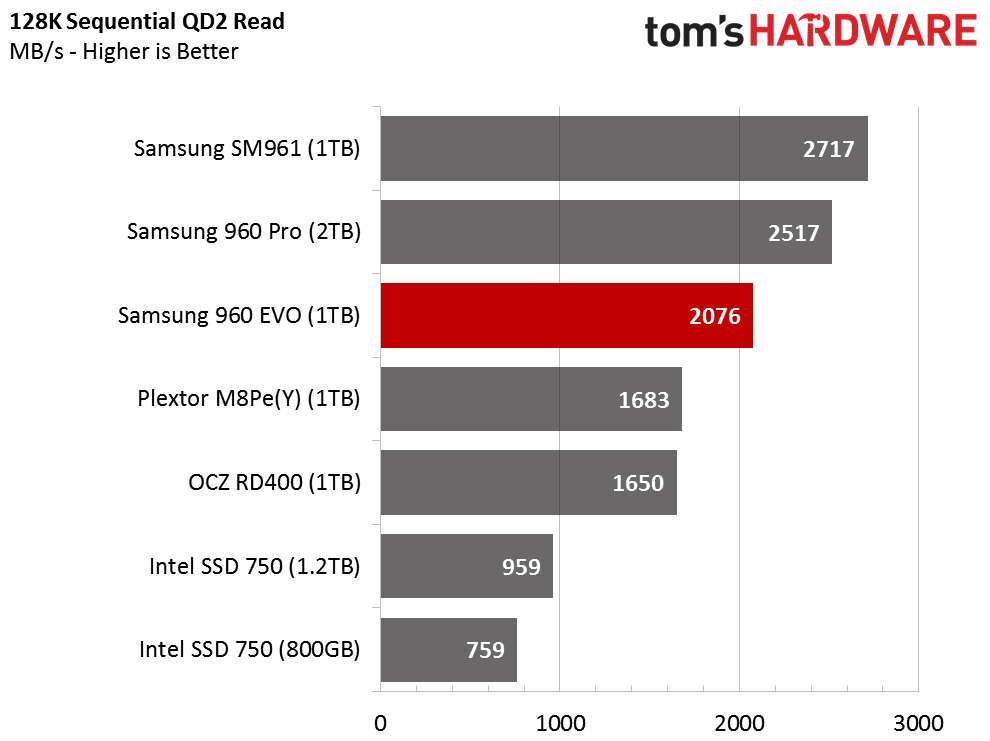
It is easy to spot the Samsung NVMe SSDs. The Samsung SSDs deliver nearly twice the performance at QD1 than the rest of the field. Samsung designed the 960 EVO 1TB for mainstream users, but it’s elevated to the top tier over the rest of the products throughout most of the queue depth range during the sequential read tests.
Sequential Write Performance
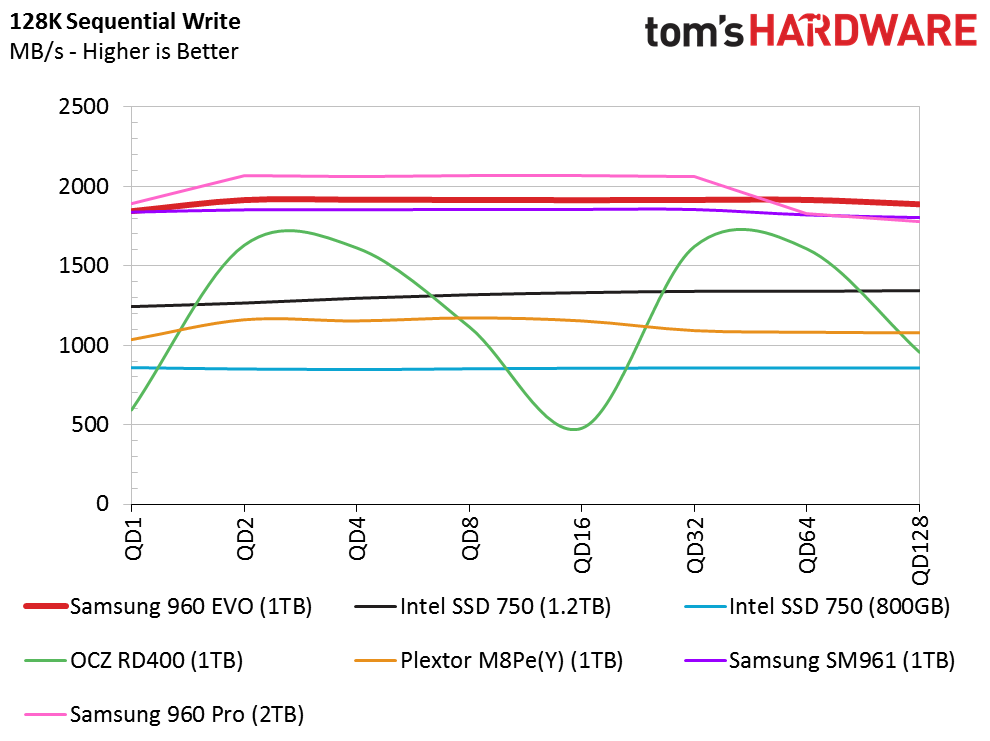
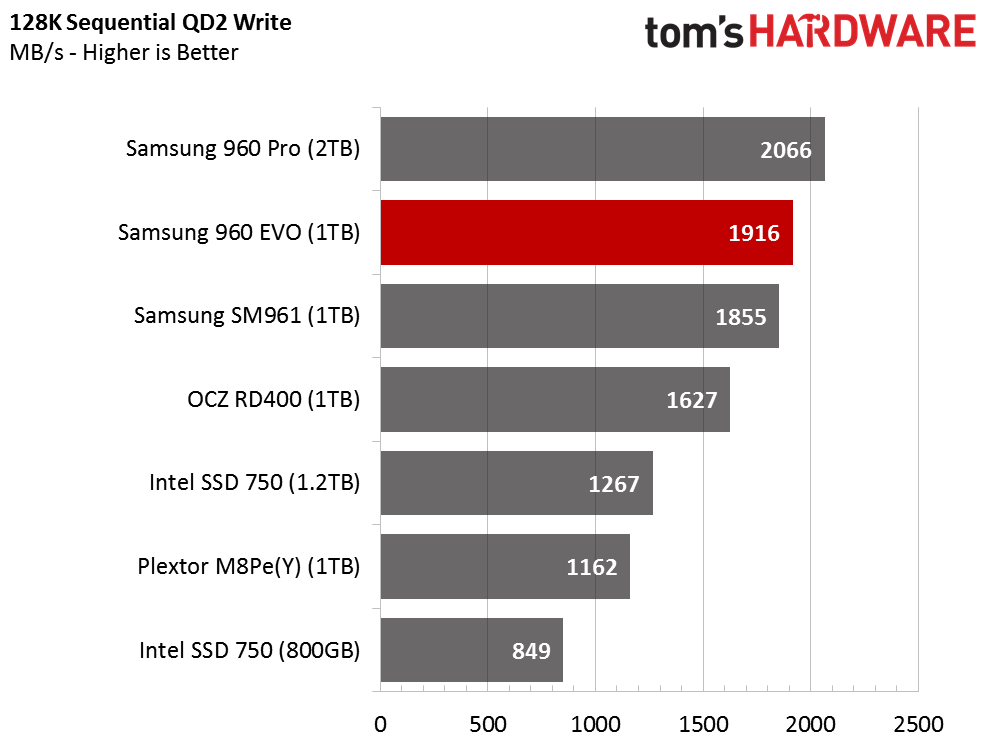
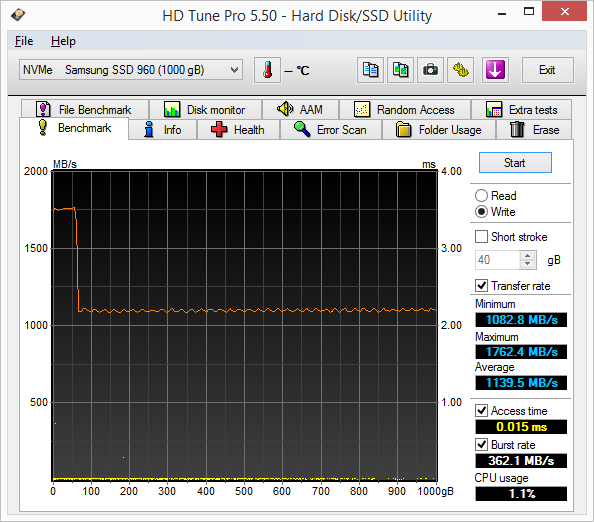
The 960 EVO 1TB features a large SLC buffer thanks to the new Intelligent TurboWrite algorithm. The buffer makes quick work of our custom sequential write test. We didn't observe any signs of thermal throttling with the EVO. Throttling normally appears on the chart as wavy lines, like what you see with the OCZ RD400 1TB NVMe SSD.
Random Read Performance
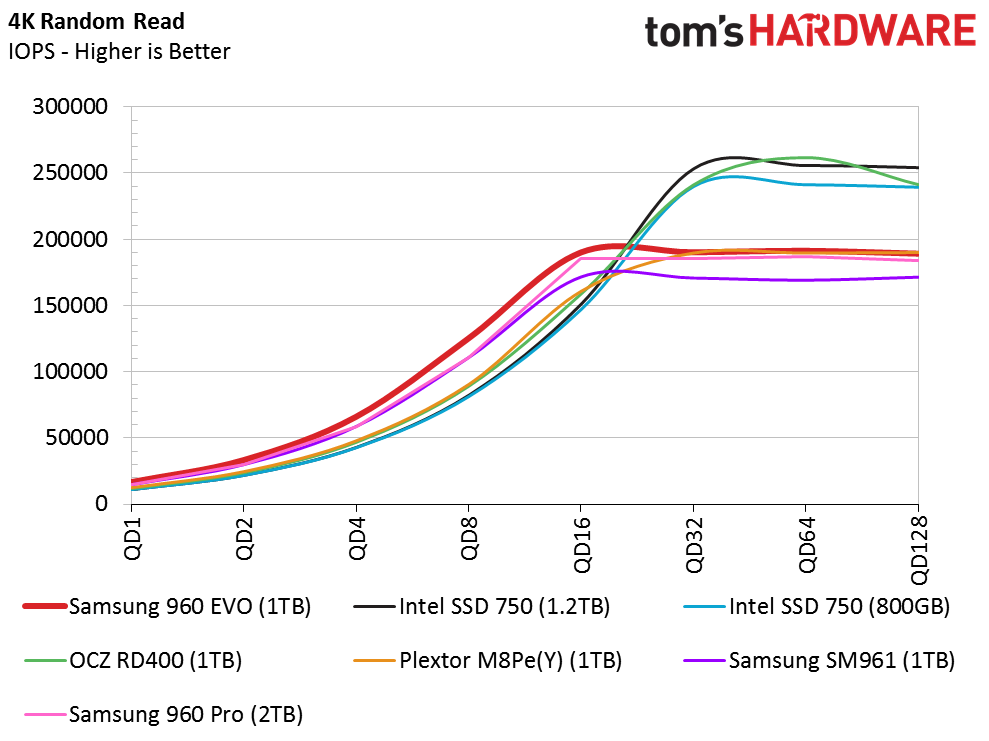
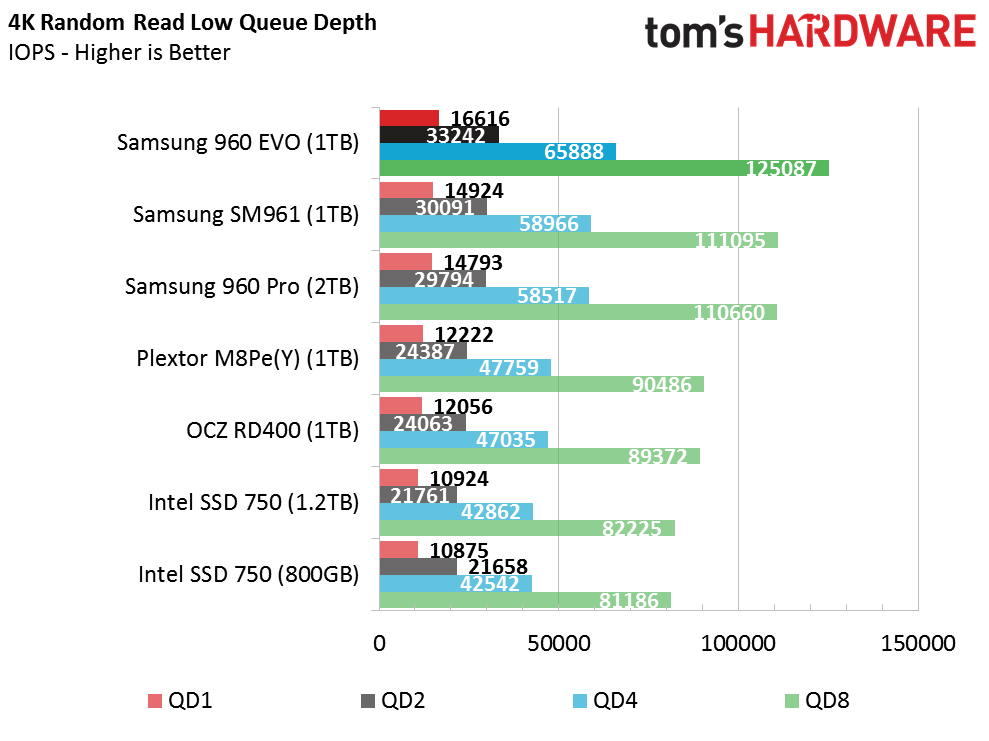
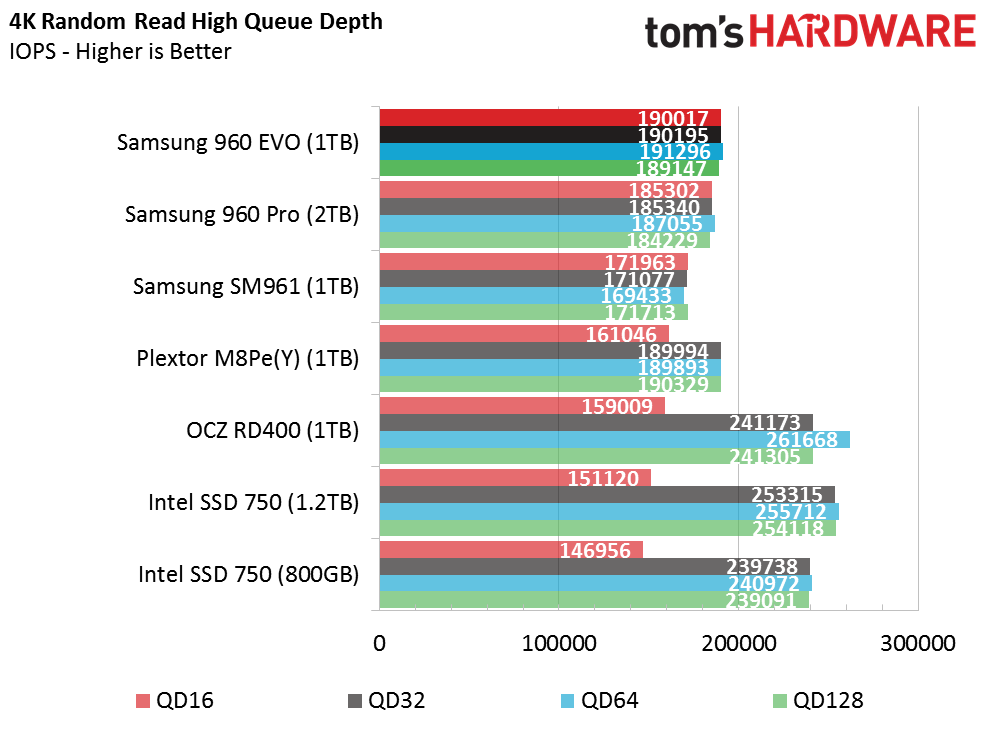
Samsung claims the 960 EVO delivers up to 14,000 random read IOPS at QD1, but we achieved a new record of over 16,000 IOPS with an M.2 slot with a direct connection to the CPU (Asrock Z97 Extreme6). The 960 EVO is faster at QD1 than any other NAND-based client drive that has ever shipped, and it scales well up to 190,000 IOPS with a single worker/thread. It is possible to coax more performance out of NVMe SSDs, but it requires multi-threaded testing. Modern software doesn't take full advantage of NVMe. Until it does, we will continue to use our existing testing methods that are more representative of the user experience.
Get Tom's Hardware's best news and in-depth reviews, straight to your inbox.
Random Write Performance
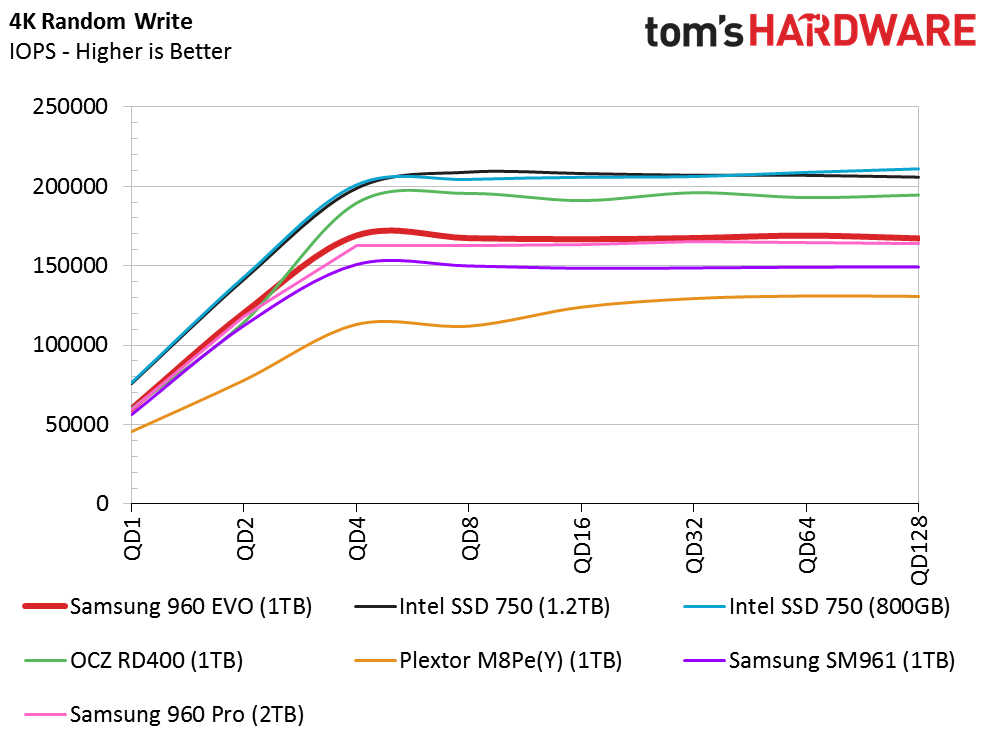
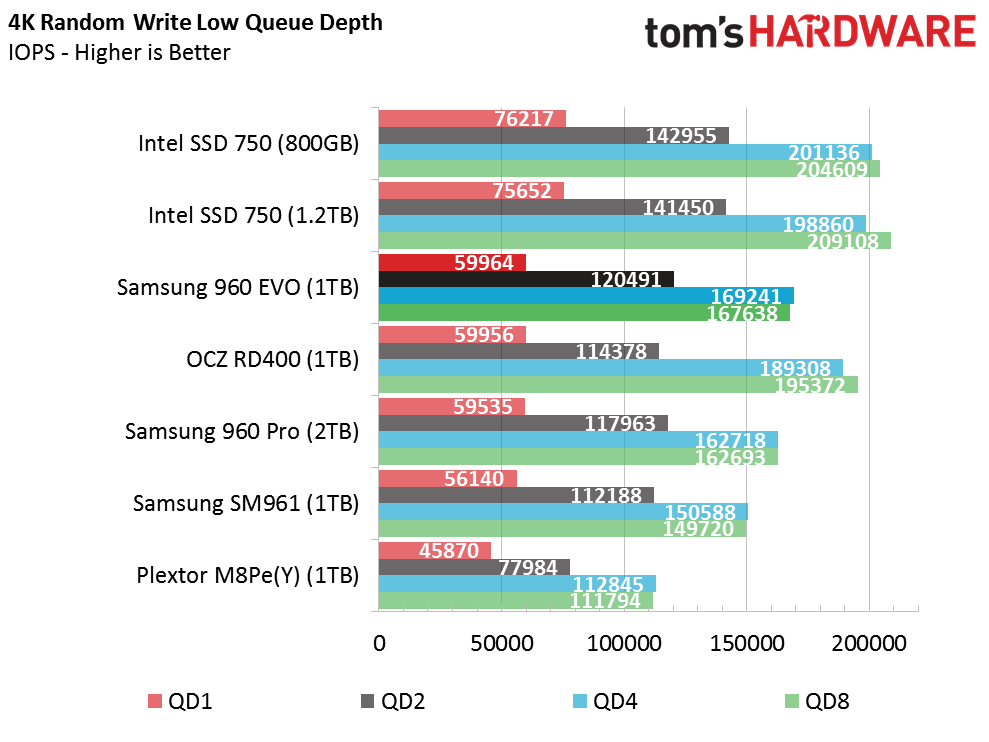
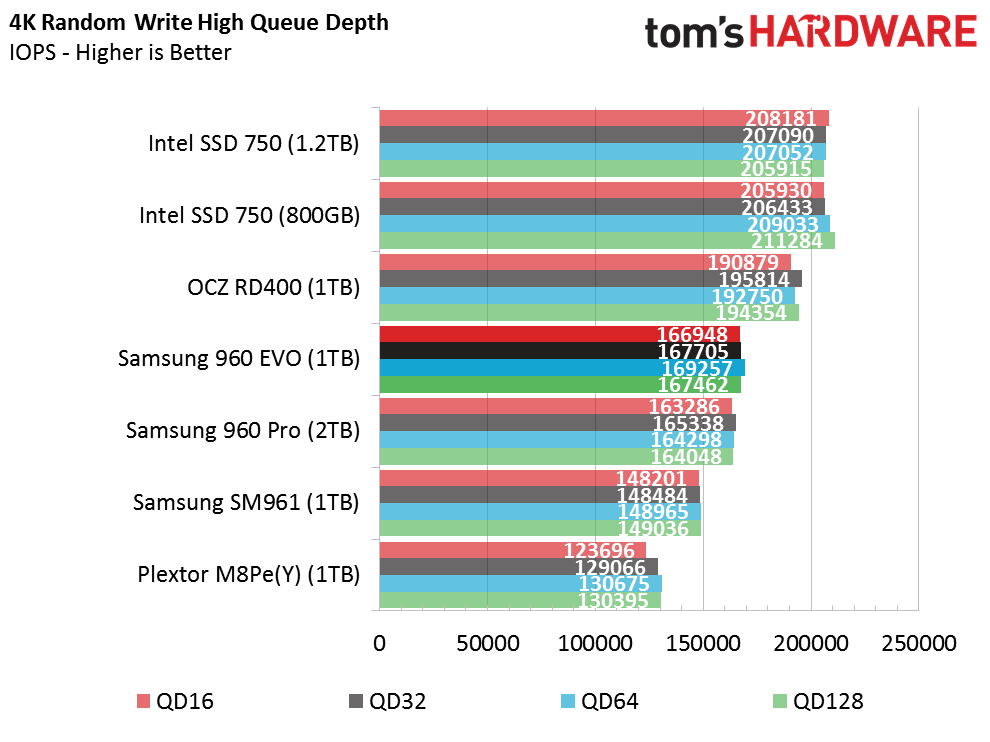
Samsung's random write performance lags behind both Intel and OCZ at low queue depths. Samsung's dominating lead in 75% of the four-corner tests is not too bad, though. The 960 EVO with TurboWrite delivers the highest random write performance of the three Samsung NVMe SSDs in the tests, but only by a small margin.
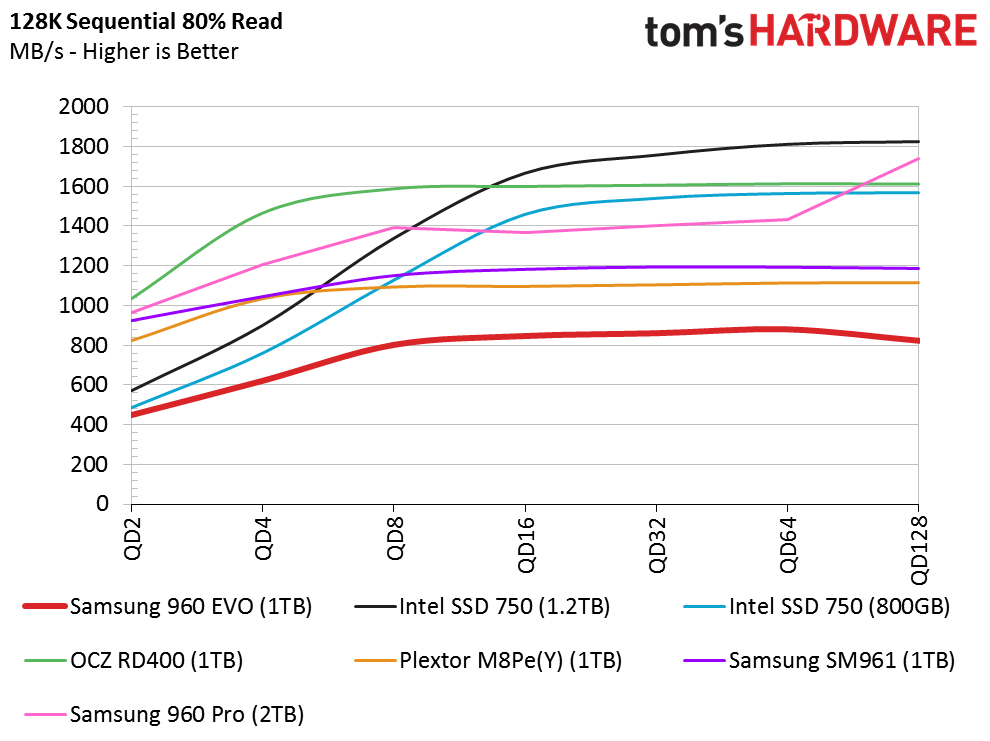
80 Percent Sequential Mixed Workload
We describe our mixed workload testing in detail here and describe our steady state tests here.
So far the 960 EVO looks like a solid competitor to every NVMe SSD shipping, including the flagship 960 Pro. The mixed workload results start to tell the rest of the story, though. TLC flash takes longer to write because the programming cycle requires increased latency compared to MLC flash. Switching back and forth between read and write cycles is difficult for TLC to handle, even with four of the five ARM processor cores dedicated to flash management.
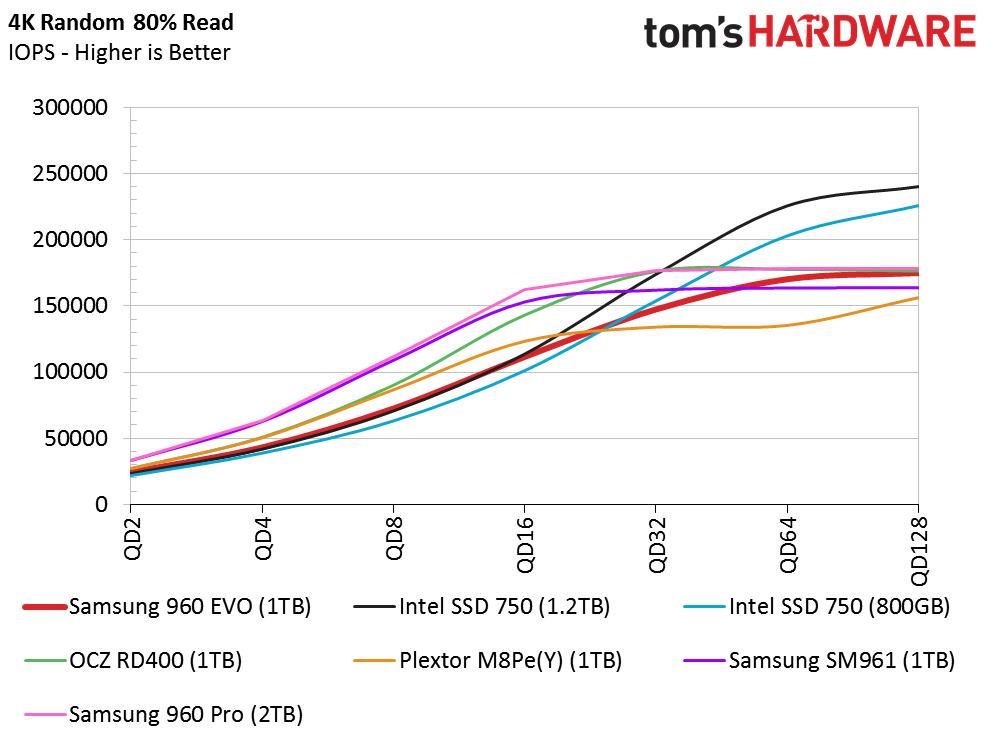
80 Percent Random Mixed Workload
The TurboWrite SLC buffer helps the EVO perform like an MLC-based NVMe SSD during the mixed random workloads. The drive performs almost the same as the Intel SSD 750 drives until QD32. After testing the PM961 (the OEM version of the 960 EVO), the performance doesn't surprise us.
Sequential Steady-State
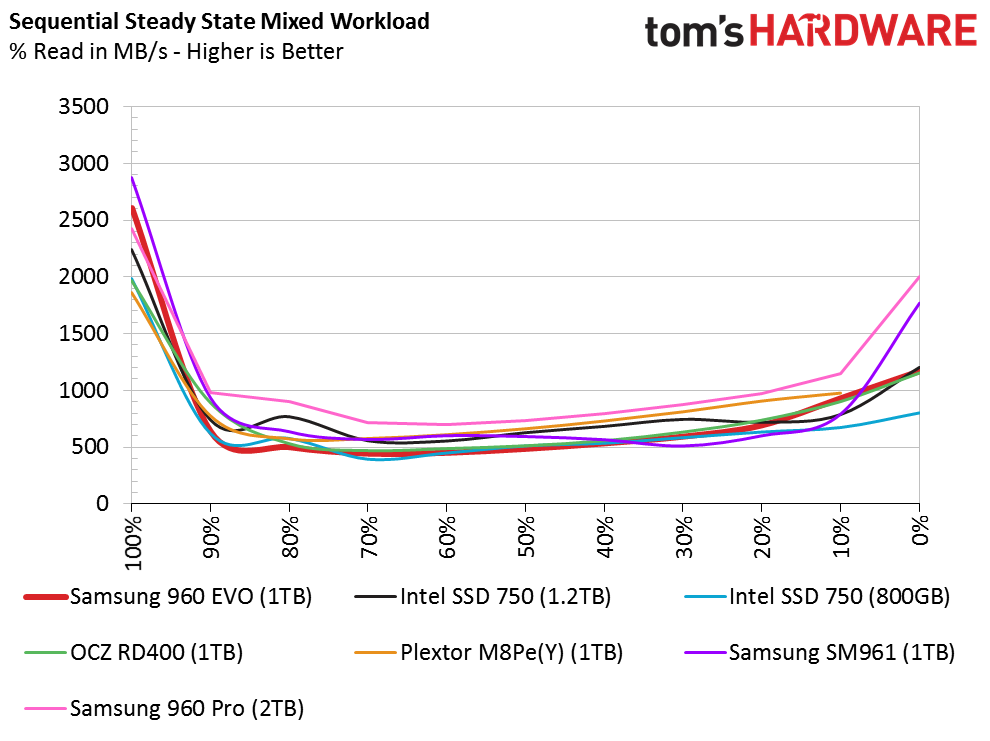
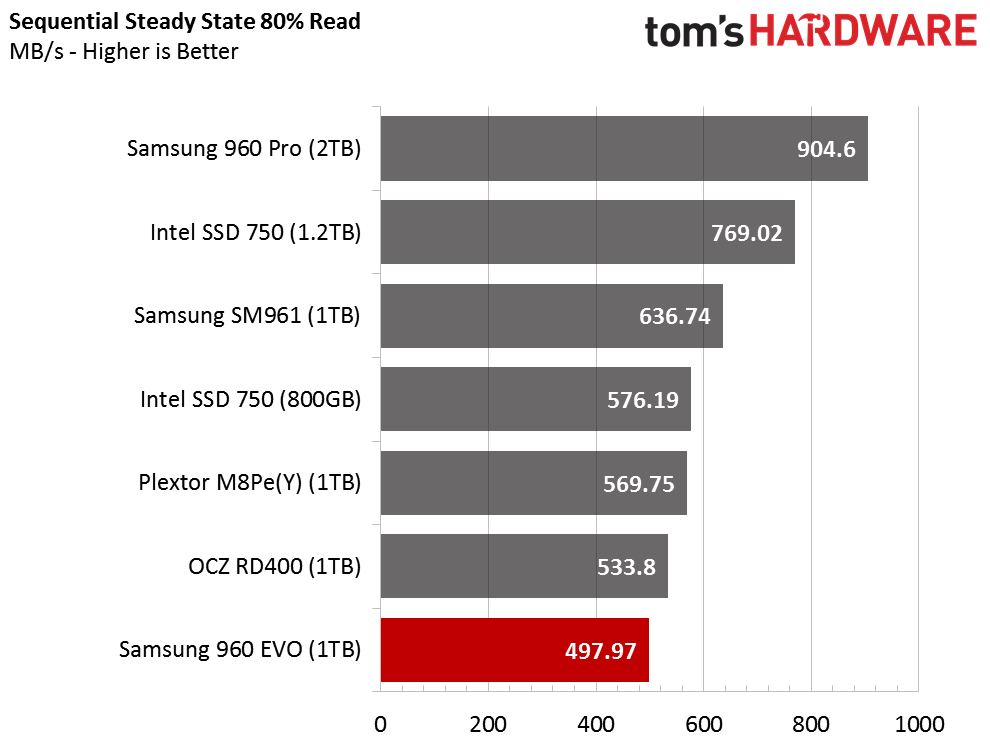
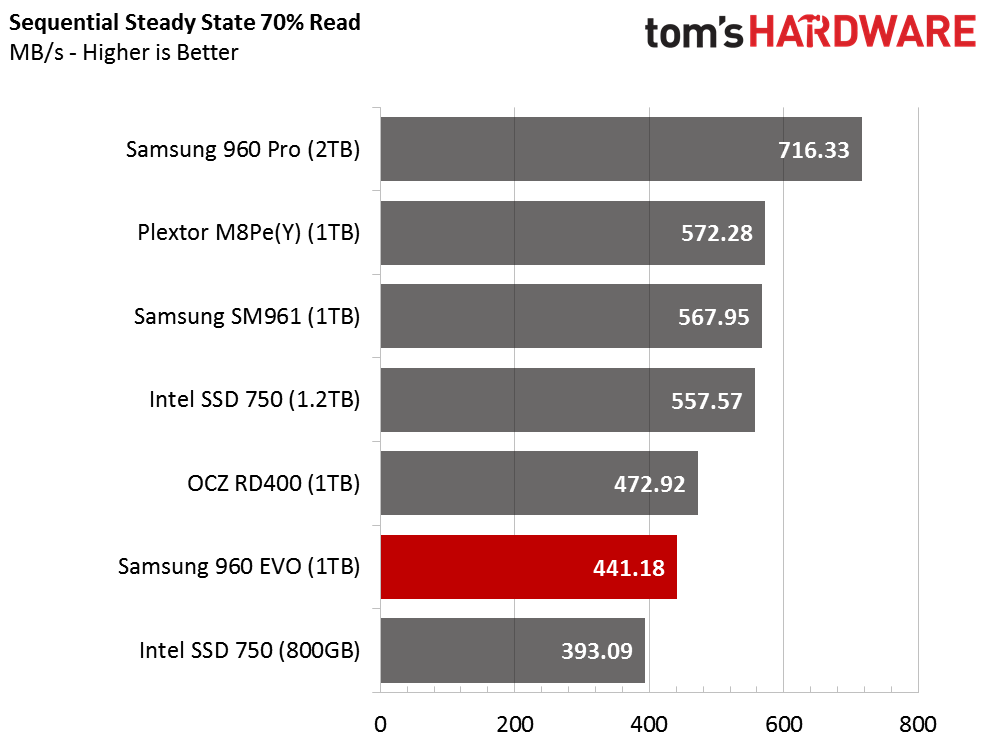
The 960 EVO 1TB performs well in the sequential steady-state test. It didn't light up the scoreboard, but it wasn't the slowest SSD throughout the entire test as we normally see when a TLC SSD goes up against a pack of high-performance MLC-based products.
Random Steady-State
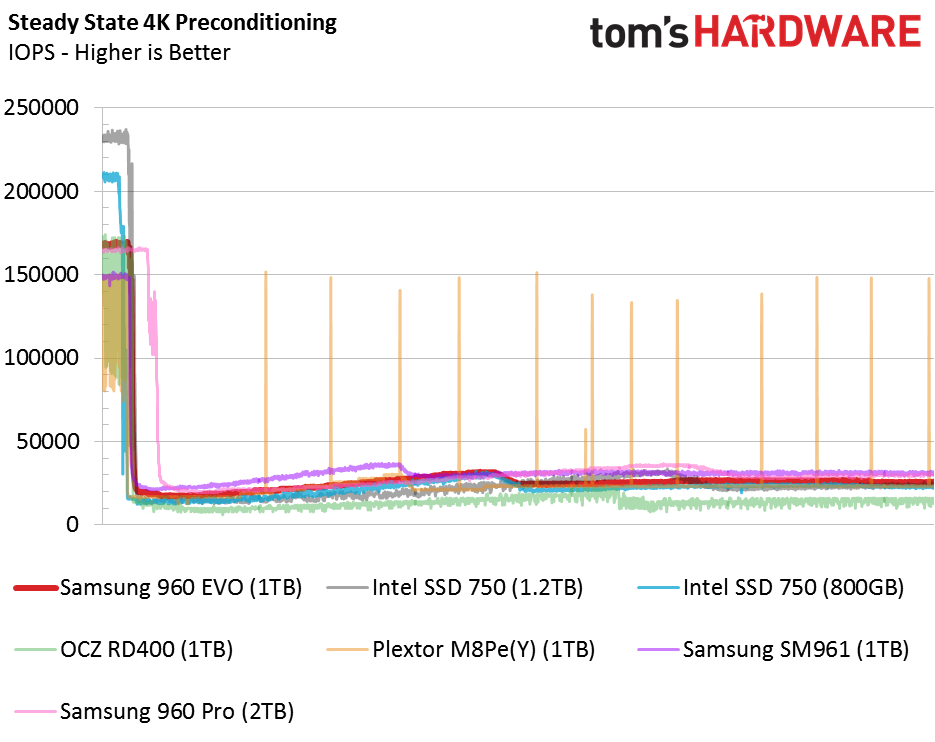
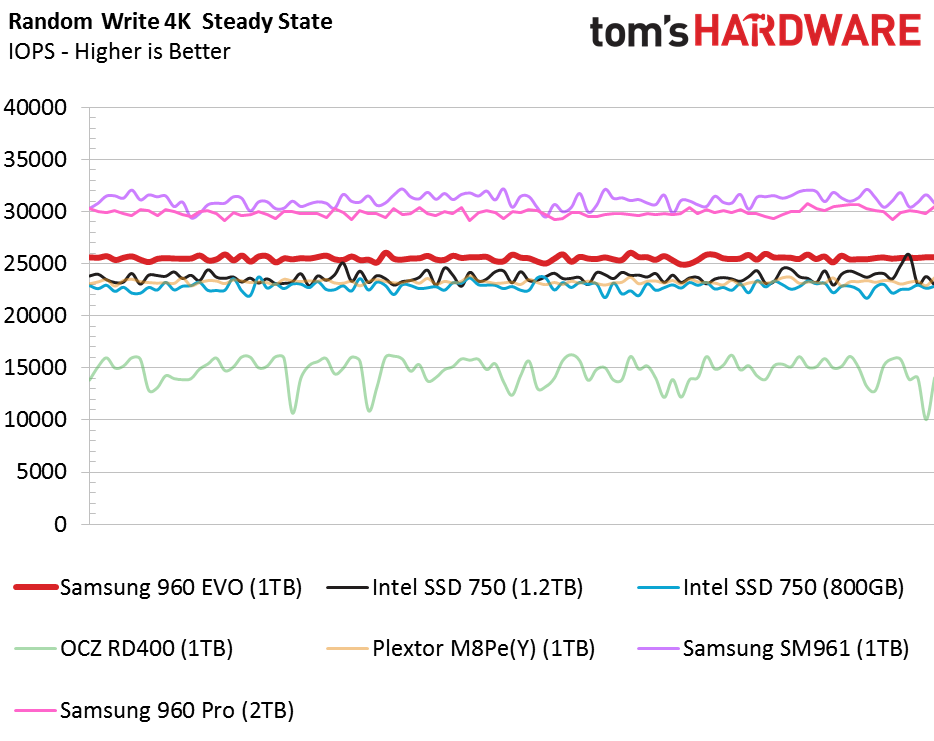
Of all the charts, the second in this series is by far the most impressive. The 960 EVO doesn't deliver the higher random steady-state performance because of its TLC flash, and it shouldn't. We just want to know how Samsung's TLC SSD managed to outperform every non-Samsung drive using MLC flash, which is an impressive feat.
The 960 EVO's Polaris processor utilizes five optimized ARM cores, and four of them are dedicated to flash management. It is important to understand that this test fills the entire user-available space before it records a single measurement. The SSD is armed with a dynamic buffer and a 6GB spare area, so it must have an excellent management flash system. We've seen enterprise SSDs with much more overprovisioning that couldn't achieve this level of consistency or high performance.
PCMark 8 Real-World Software Performance
For details on our real-world software performance testing, please click here.
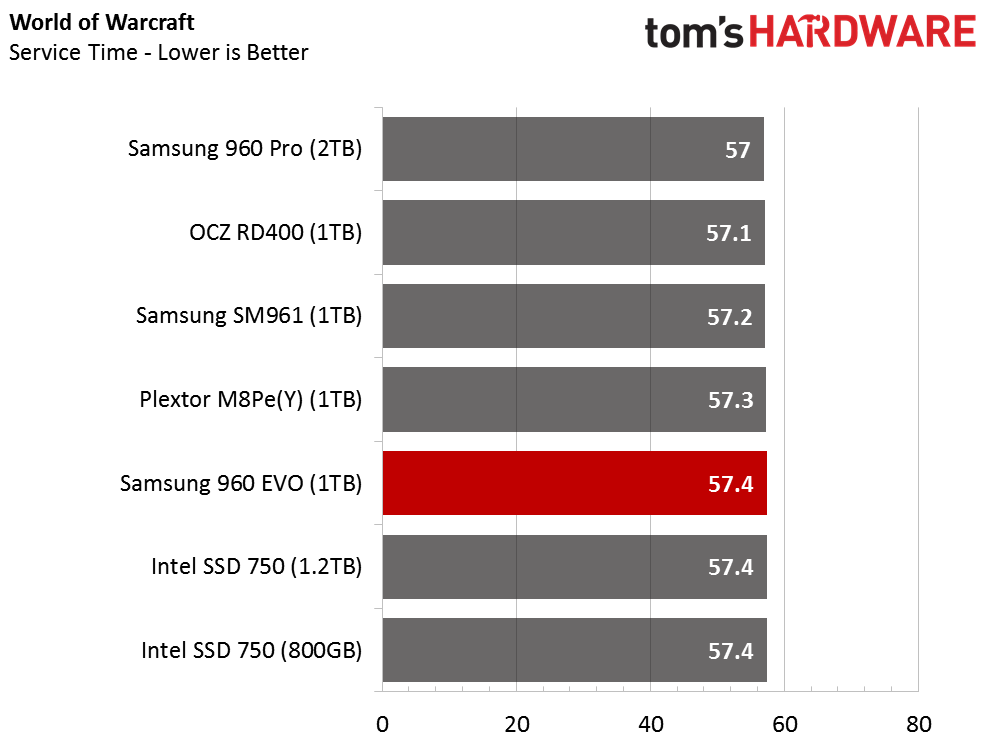
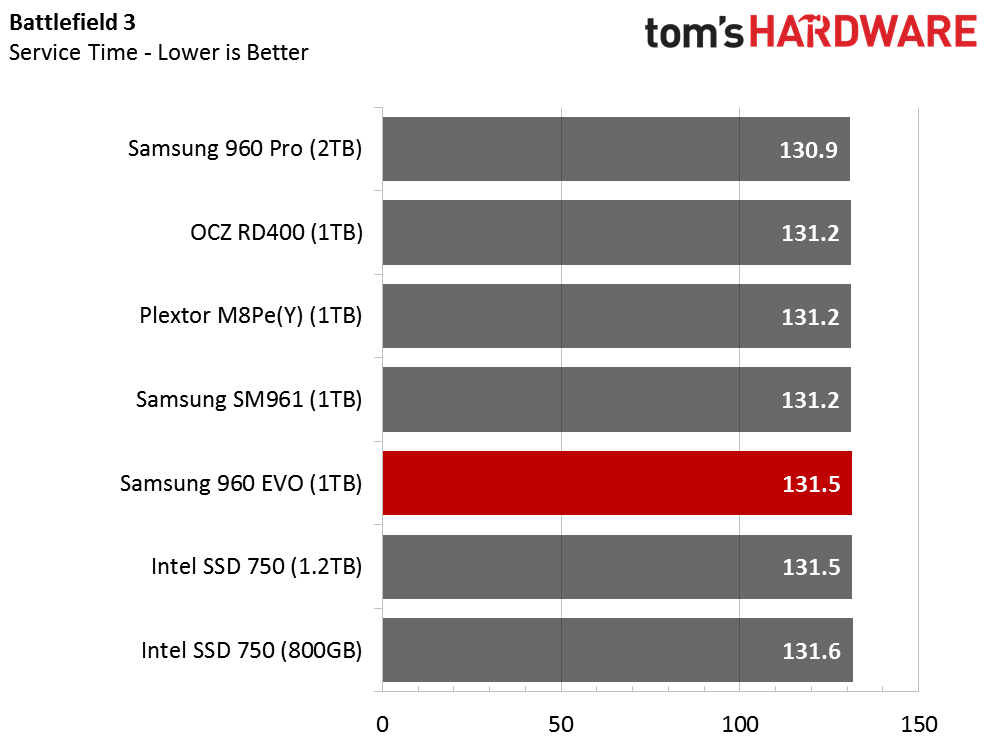
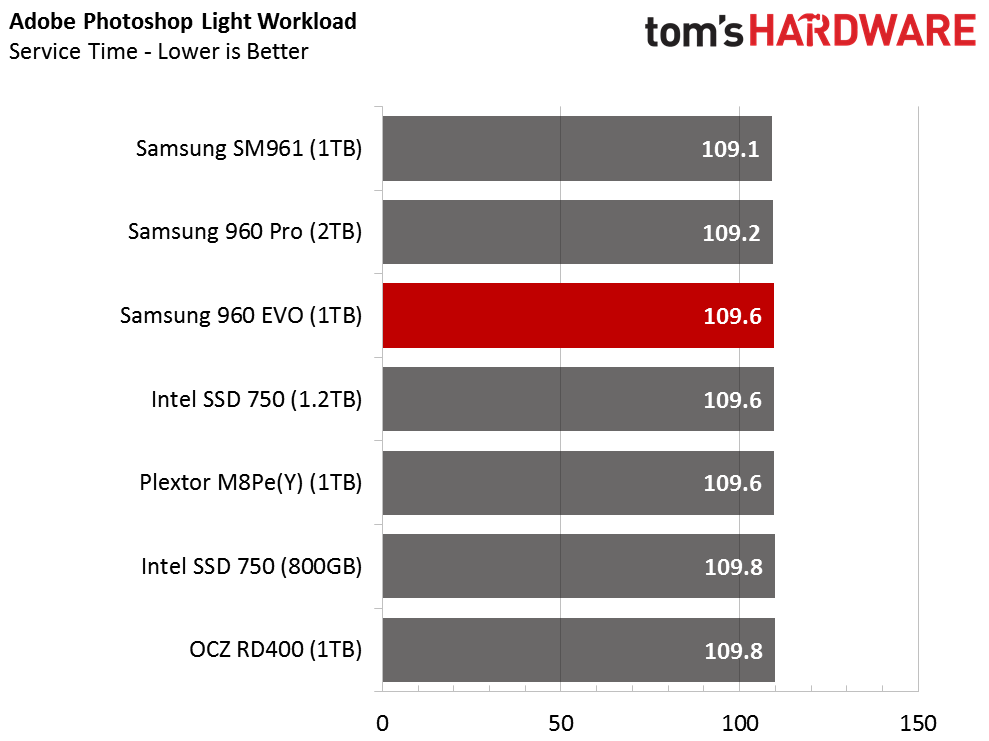
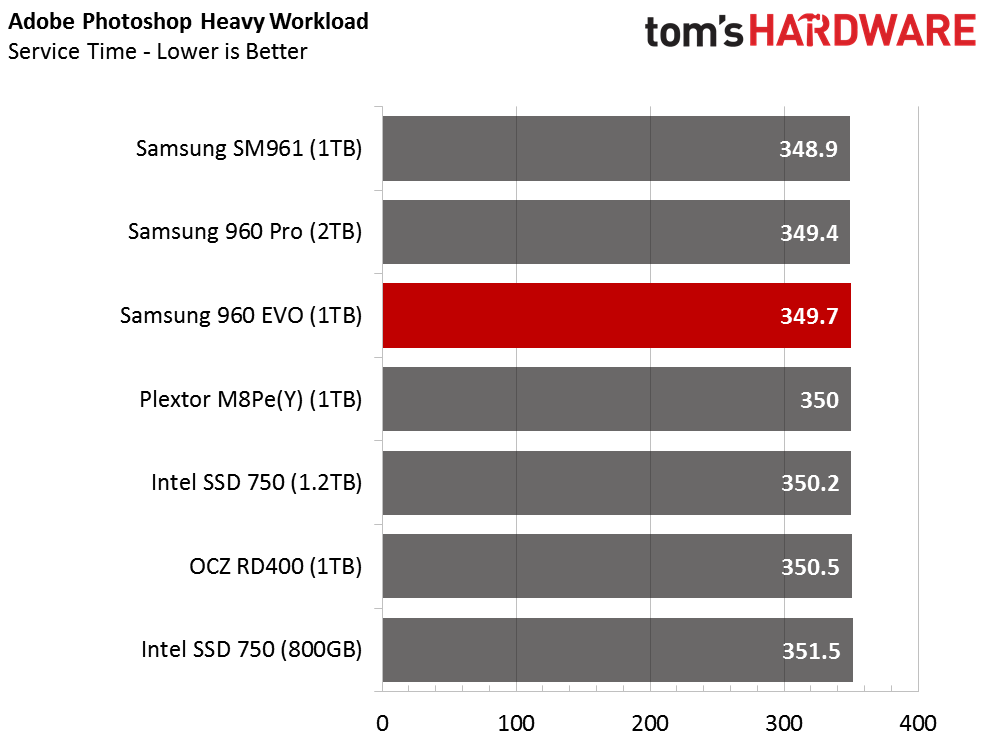
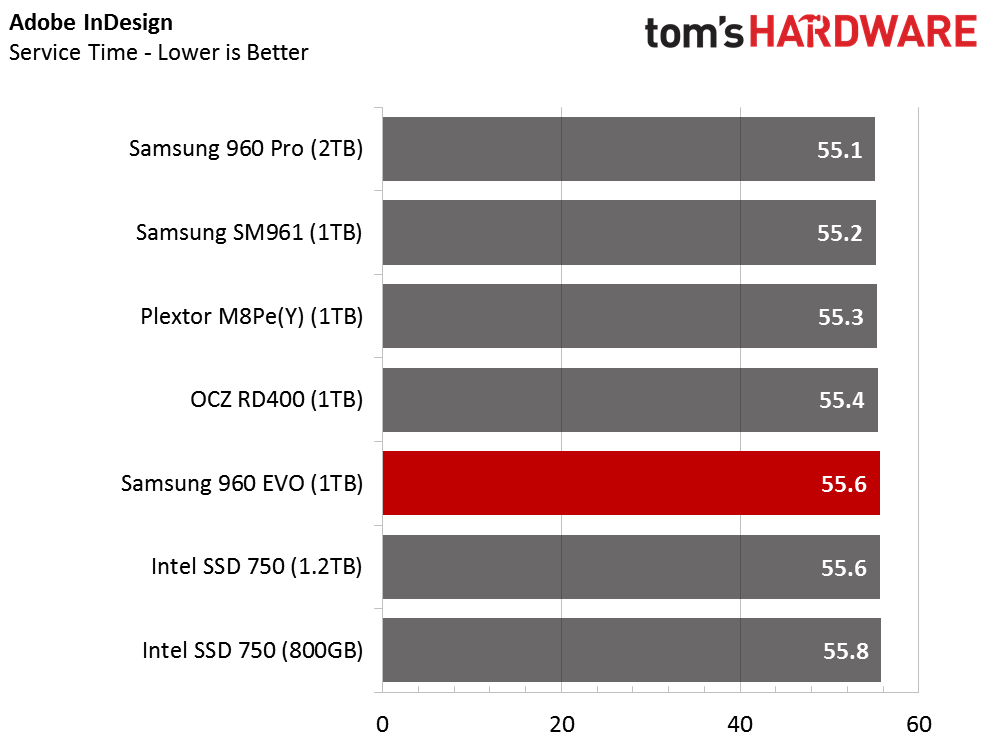
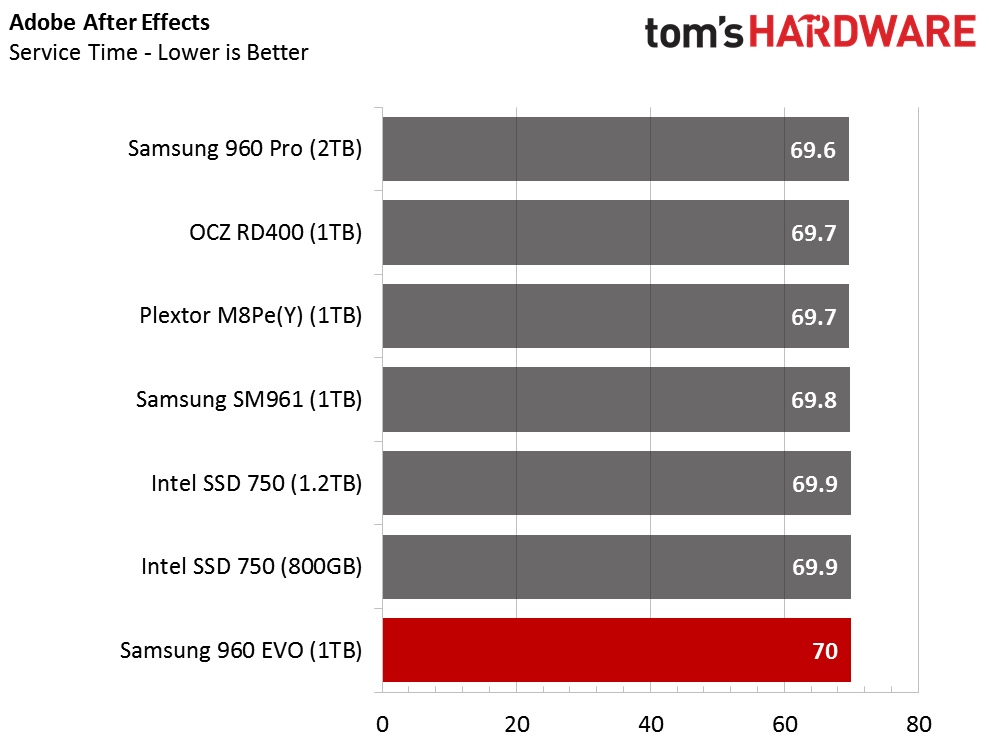
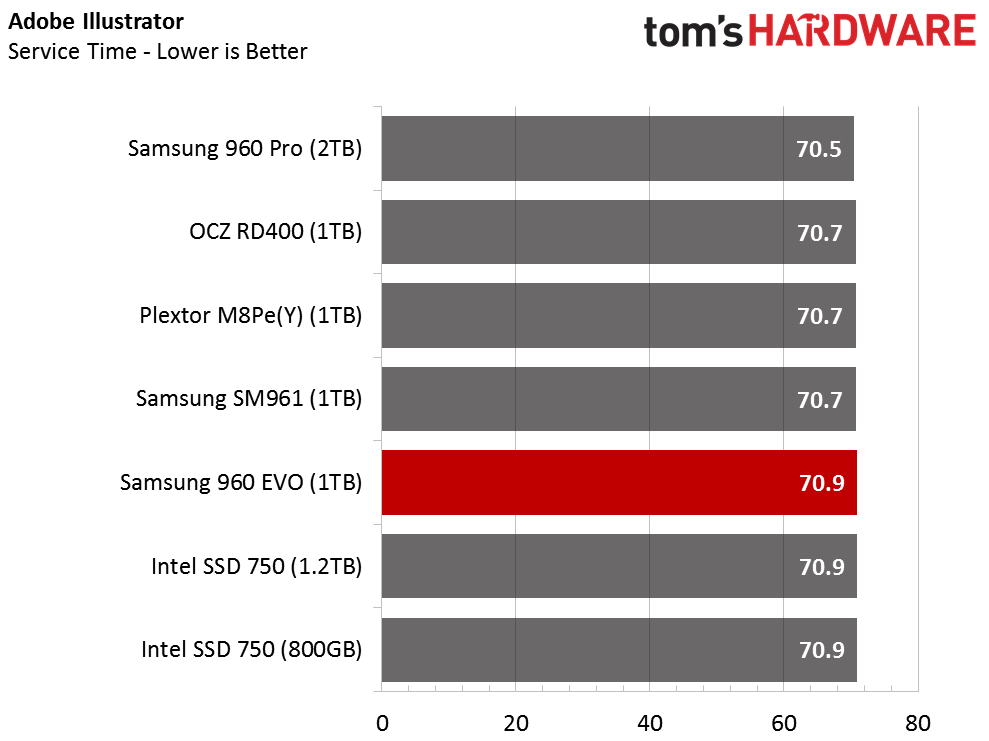
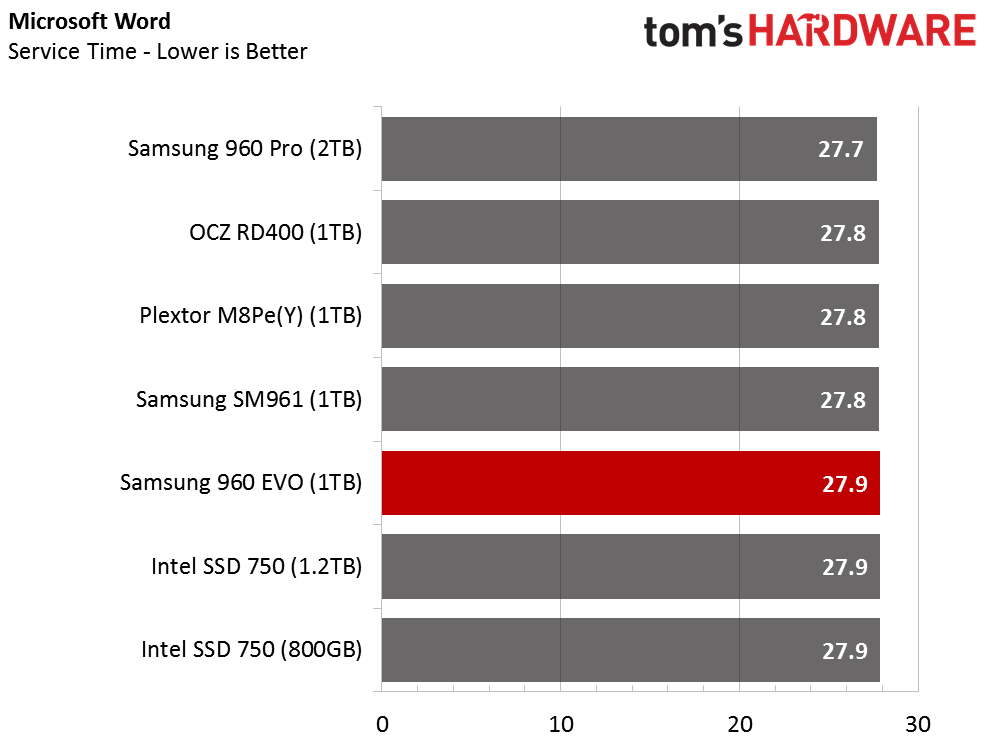
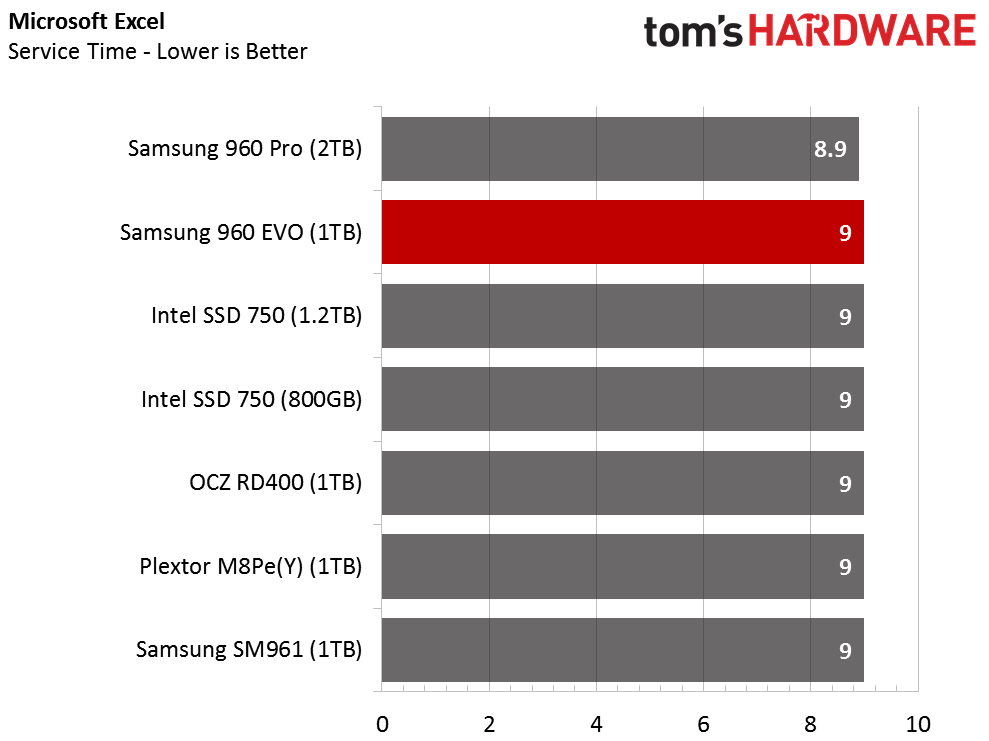
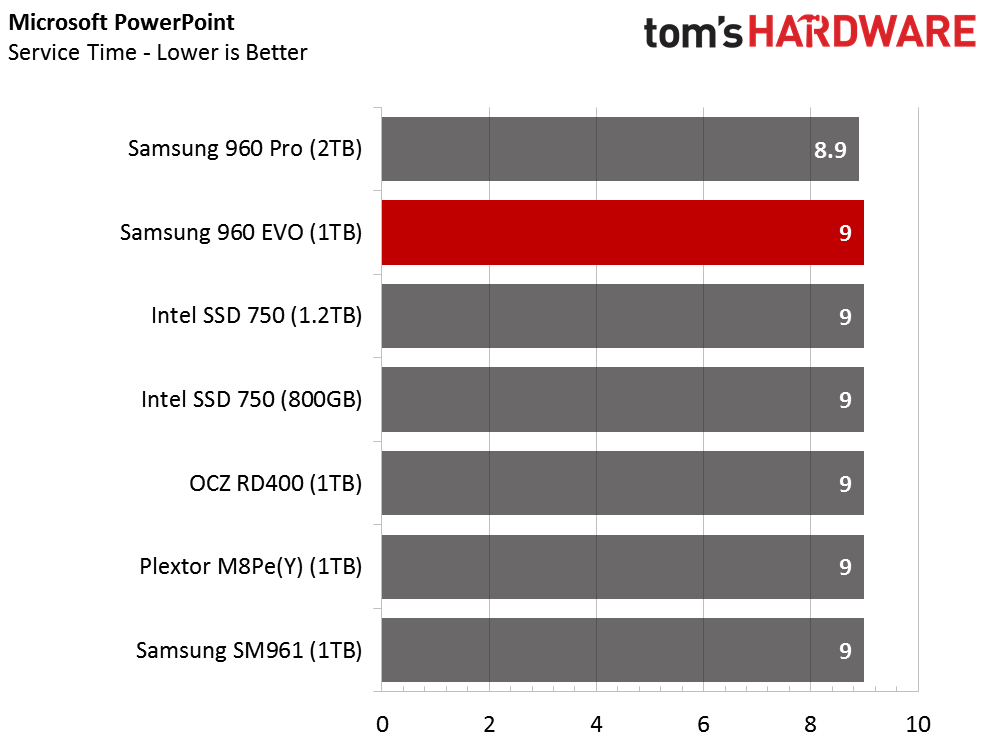
The application results reveal why mixed workload performance is so important. If you just examine the 4-corner test results, you would expect the 960 EVO to be in the top three for each application test, and never drop below that. The 960 EVO is a very good SSD that makes the best of TLC, and it is the fastest TLC-based SSD we've ever tested, but the mixed workload results show that the 960 EVO is not perfect.
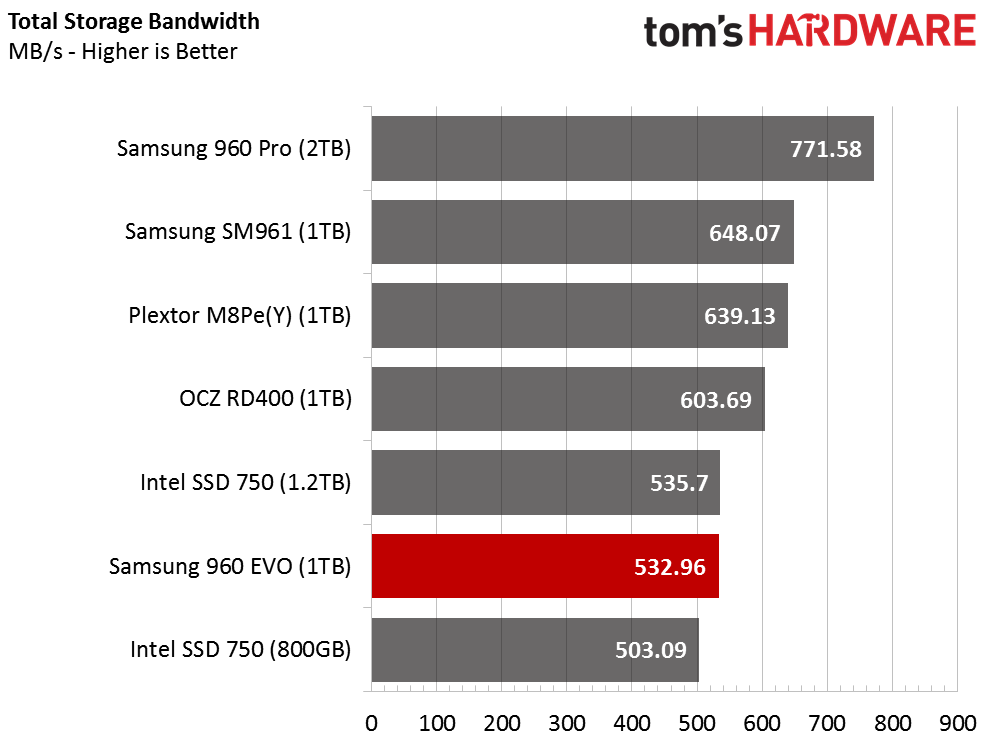
Application Storage Bandwidth
With the results bundled together and then averaged into an easy-to-digest throughput number, we see how the 960 EVO compares to the other NVMe 1TB SSDs. The 960 EVO scored a solid 533 MB/s, which is double what we achieve with many modern high-performance SATA SSDs.
PCMark 8 Advanced Workload Performance
To learn how we test advanced workload performance, please click here.
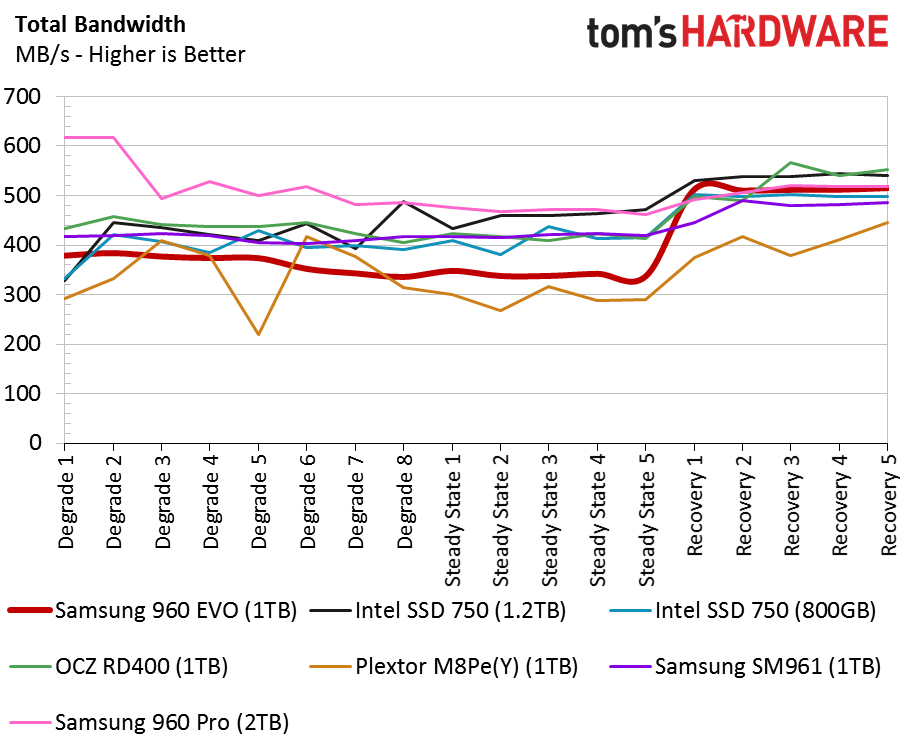
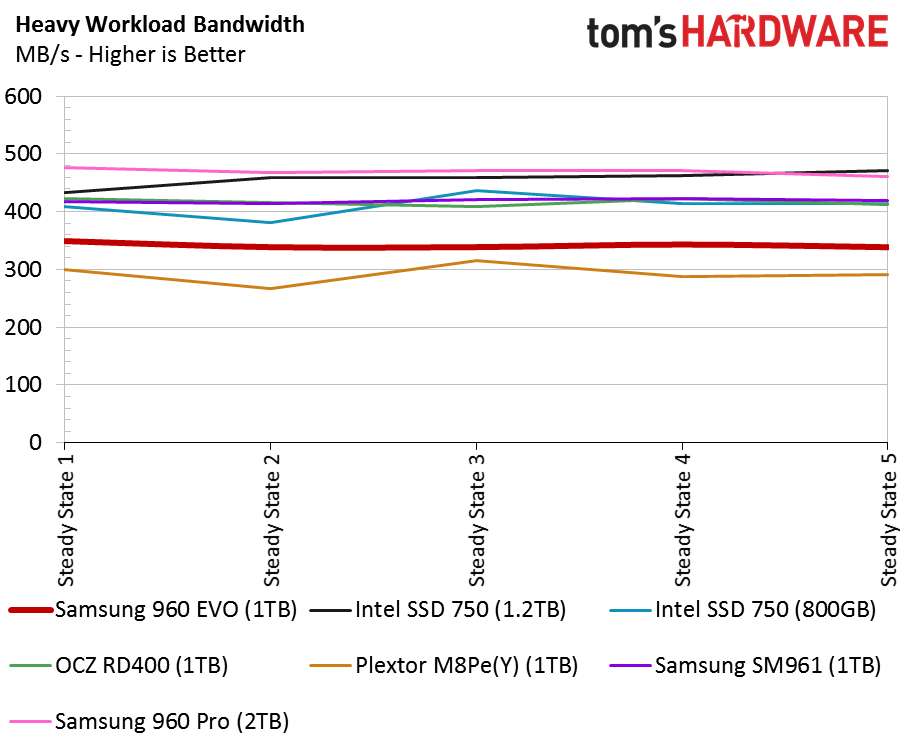
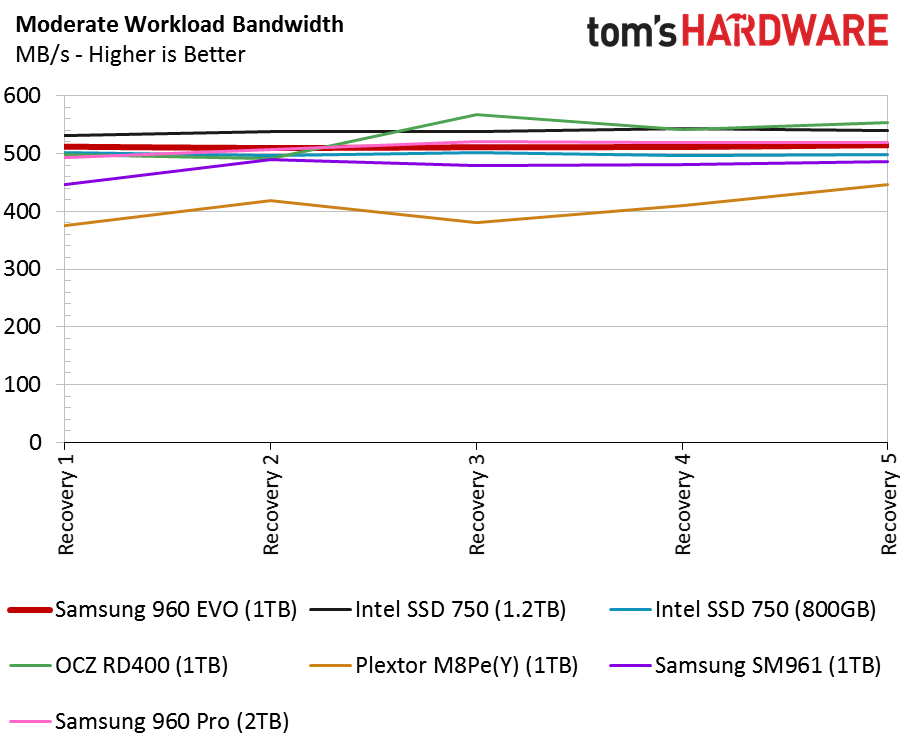
The 960 EVO 1TB trails the other NVMe SSDs during heavy workloads. Samsung didn't design the EVO series for that type of stress. With a little idle time added to the workload, the EVO picks itself up and marches on. The drive doesn't outperform the rest of the competition like we see with the SATA-powered 850 EVO. It does blend in with the group of SSDs that cost more, and in some cases, much more.
Total Service Time
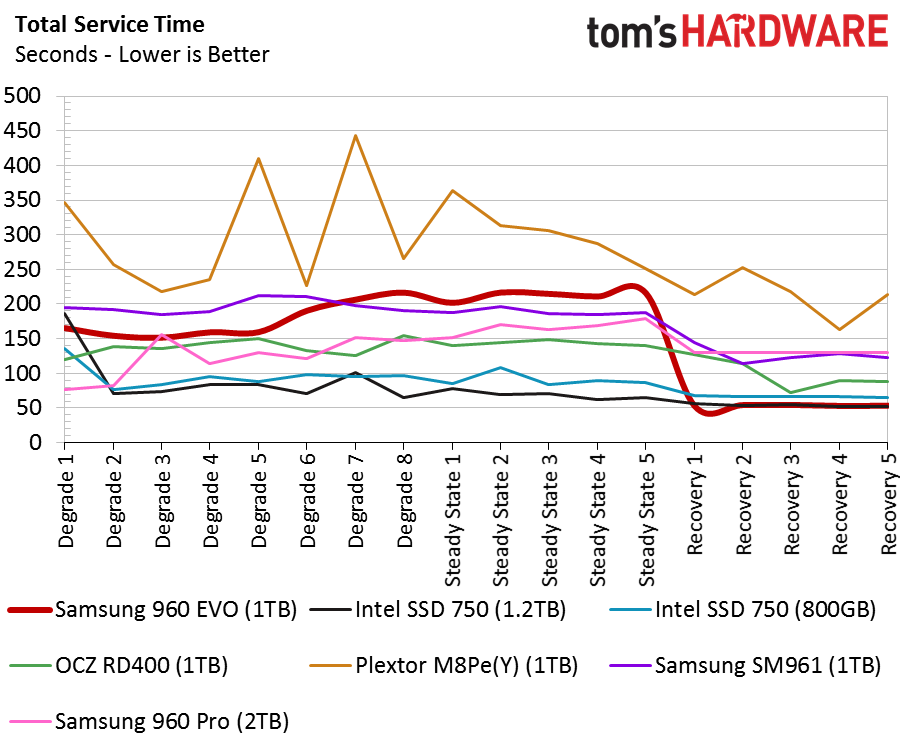
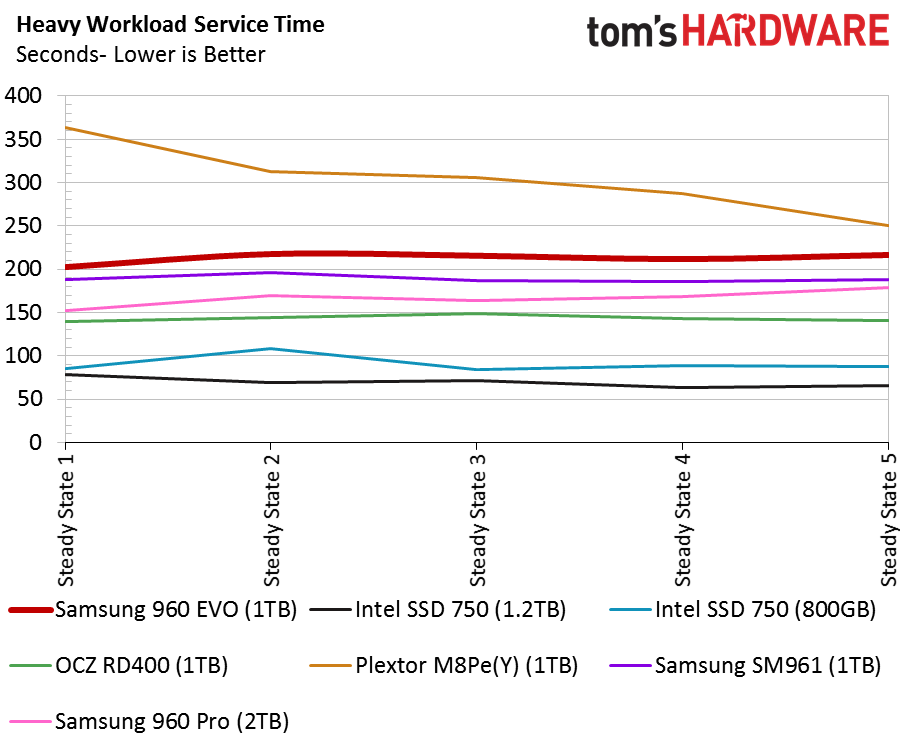
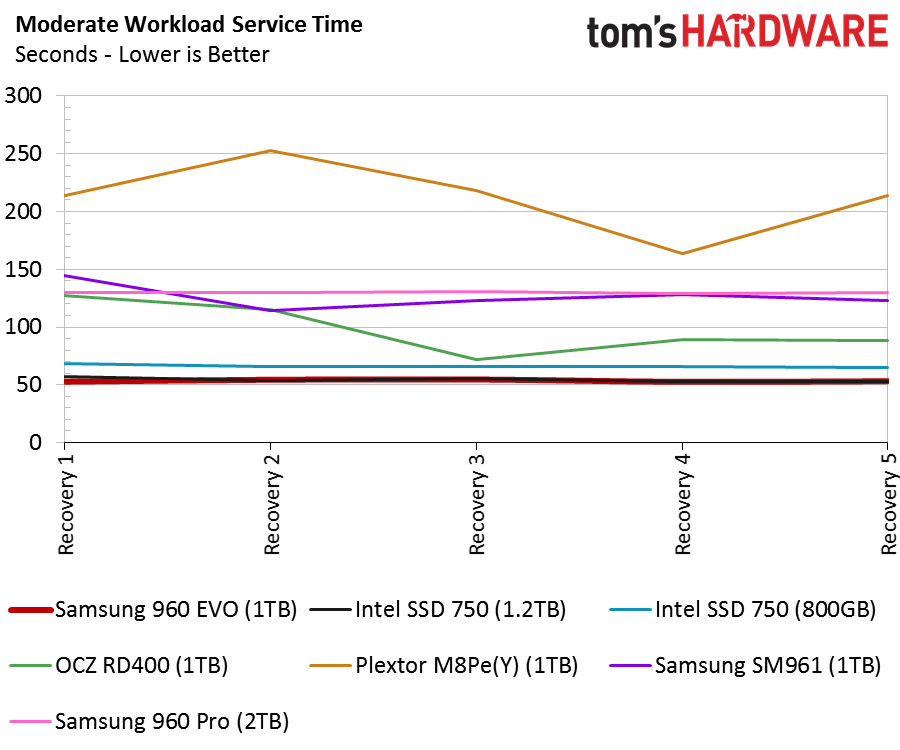
The service time results show us what we expect to see and help to explain the low performance during heavy workloads. The 960 EVO's latency builds up during the heavy workload, and that slows future IO transactions. When the test introduces idle time into the workload, the drive recovers and takes advantage of the advanced SLC buffer to clear a path of fresh flash for incoming data.
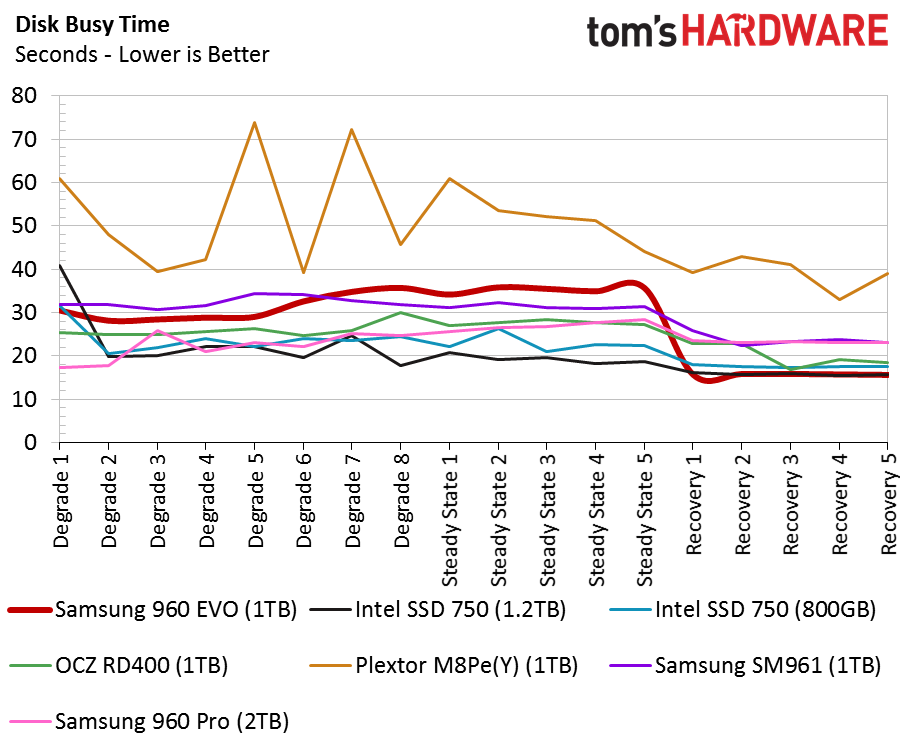
Disk Busy Time
The disk busy time test shows that the 960 EVO has to work very hard during heavy workloads. Once the buffer becomes effective during recovery time, the data passes through the controller and to the NAND flash almost effortlessly.
Notebook Battery Life
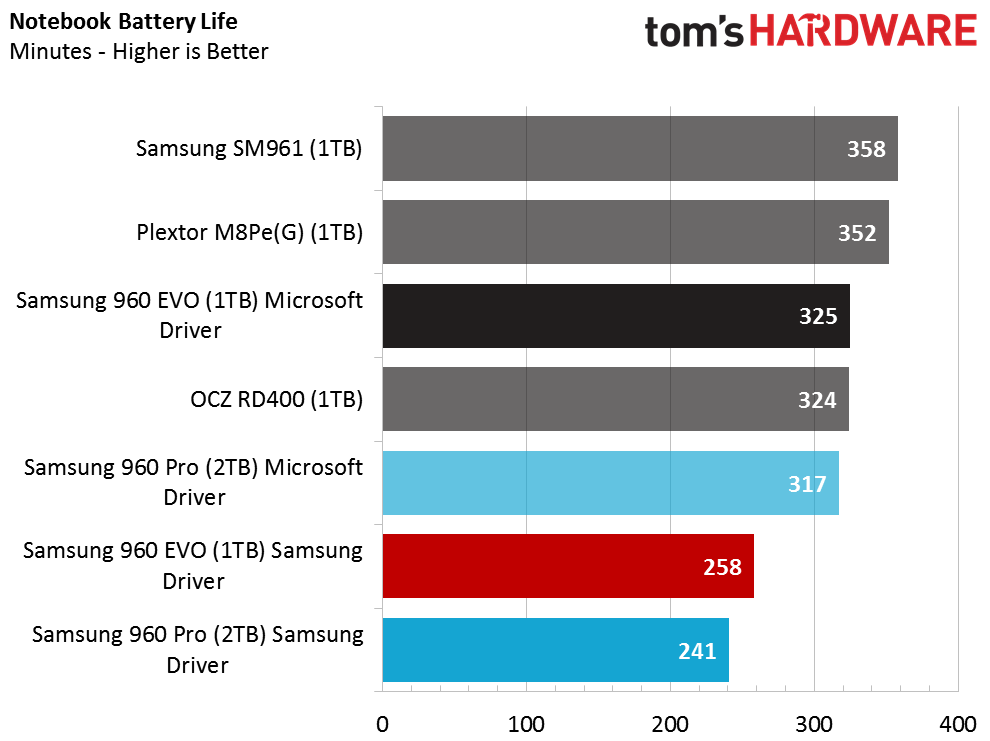
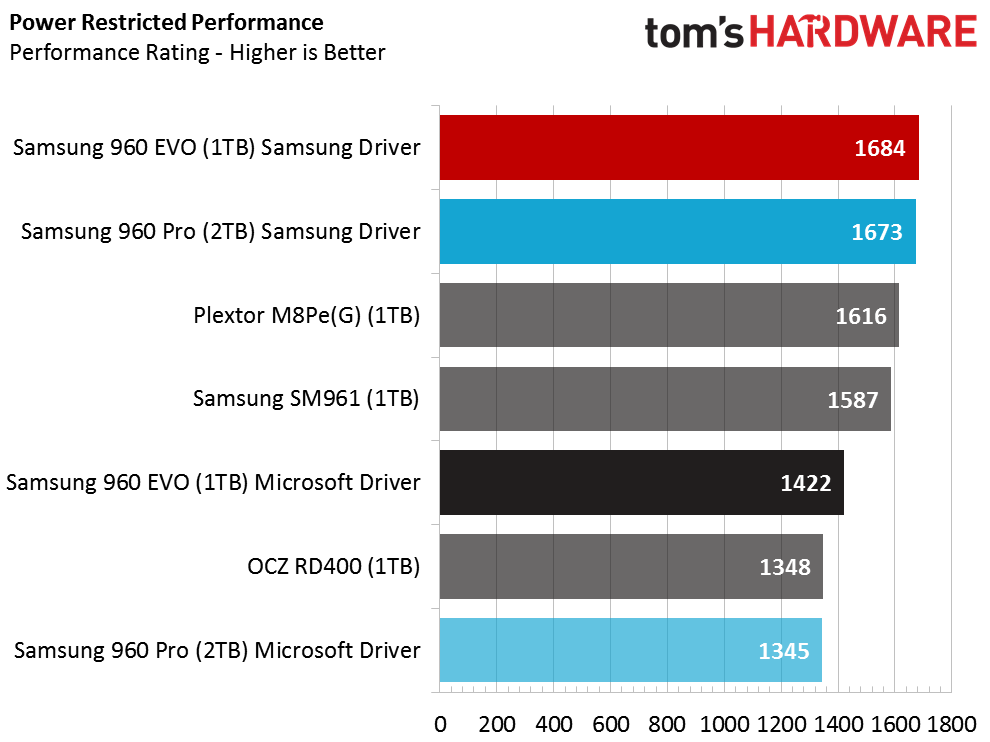
We ran a few different tests with the new 960 series in our notebook battery life test. We focus on two different SSDs in this test; the previously reviewed 960 Pro (blue color) and the new 960 EVO. The 960 Pro with the new Samsung 2.0 NVMe driver delivers just 241 minutes of on-battery time. The result is much lower than the 317 minutes we achieve with the same drive tested with the Windows 8.1 NVMe drive from Microsoft. The 960 EVO 1TB SSD also shows a similar drop-off and a wide gap between the Samsung and Microsoft driver.
We reached out to Samsung to report our findings, and the company plans to investigate the issue. We will report if a power-optimized driver comes to market.
The new Samsung 2.0 NVMe drive might not be power optimized, but it does deliver higher performance compared to the Microsoft NVMe driver. The notebook performance chart under battery power also shows a wide gap. The good thing is that the driver does increase performance and the SSD doesn't just generate heat while soaking up the valuable electrons.
Current page: 1TB NVMe SSD Performance Results
Prev Page Specifications & Overview Next Page 500GB Benchmark Results
Chris Ramseyer was a senior contributing editor for Tom's Hardware. He tested and reviewed consumer storage.
-
shrapnel_indie While I agree power hungry SSDs are problematic in the mobile sector, they are usually not a problem in the desktop sector (other than potential heating issues which exist for any market.)Reply
Glad to see Samsung finally have working parts to show off though. While taking time to make sure its good, is good, it isn't so good if price/performance isn't. However, since it is a Samsung, people will buy... and that could hurt if it actually fails expectations. (Remember the 840 EVO issues that left a bad taste in the mouth of some.) -
logainofhades For that price, they can keep them. Can get a 1.1tb MX300, for a similar cost to that 500gb 960 evo.Reply -
2Be_or_Not2Be Reply18870825 said:For that price, they can keep them. Can get a 1.1tb MX300, for a similar cost to that 500gb 960 evo.
However, the MX300 consistently is a worse performer than the 960 Pro/EVO. So I guess you have to weigh what's more important to you - better performance or the additional capacity. -
songer121 pre ordered the pro... cannot wait for that beast to come in. the speeds of those new 960's are crazy fastReply -
elbert The 250GB for $129 looks pretty sweet. I be picking one of those up in my build early next year.Reply -
logainofhades Just look at the application performance, which is more of a real world usage scenario.Reply
http://www.tomshardware.com/reviews/crucial-mx300-ssd-review,4723-3.html
vs
http://www.tomshardware.com/reviews/samsung-960-evo-nvme-ssd-review,4802-2.html
The worst benchmark was the heavy adobe workload. Still less than 10s, on the service time. Every other benchmark was a good deal closer than that. 10s is not worth double the cost.
-
Game256 Glad I decided not to wait for the reviews/release and bought SM961 for the same price as EVO.Reply
It's more risky, there is no official support, but the difference in performance turned out to be huge.
I don't agree with Chris that Samsung is not considering 250 Gb version to be bestselling drive.
It looks like they want to begin full transition to the NVMe SSDs with this exact model, because absolute majority of users can spend up to 150$ on the new drive, up to 180$ max (capacity doesn't matter). And Samsung even removed 256 Gb version of Samsung 960 PRO so that it doesn't interfere with this model.
Yes, the performance of 960 EVO is not so great, but pretty significant compared to SATA. And low price together with highly popular brand should do their job. -
sillynilly I will grab the 1Tb - will be my first one. I had lustily eyed the intel for quite some time, now I can finally grab something similar for more than half the price.Reply -
trifler After reading this article, I want to know how the 960 EVO compares with the 850 EVO at 250-256GB. Should I go ahead and get an 850 EVO then?Reply
