Samsung 970 EVO SSD Review: The 64-Layer Refresh
Why you can trust Tom's Hardware
2TB And 1TB Performance
Comparison Products
There are very few 2TB SSDs on the market, so we chose to include our two high-capacity EVOs in these charts. This also allows us to compare Samsung's 256Gbit die to the new denser 512Gbit die that stores twice the amount of data.
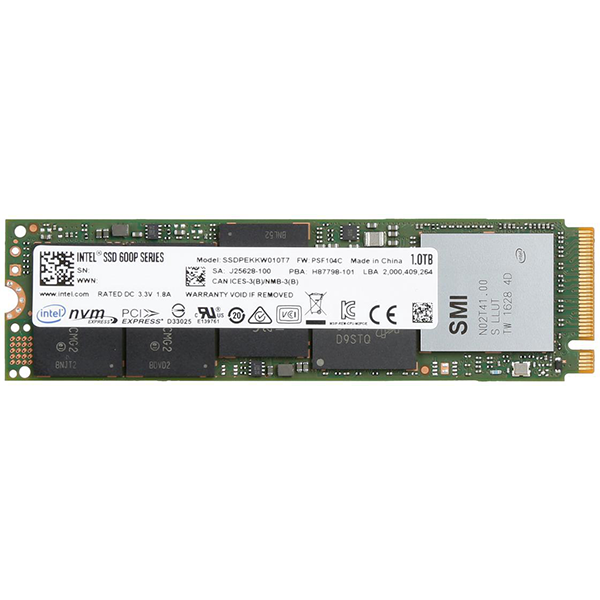
The story would not be complete without Samsung's previous-gen 960 EVO. We also include Samsung's new 970 Pro and the 960 Pro, both of which come with MLC flash. The Intel 600p represents Intel's previous-gen NVMe SSD with 32-layer flash. Intel has yet to release the new 760p at 1TB, but that product should be on the market soon.
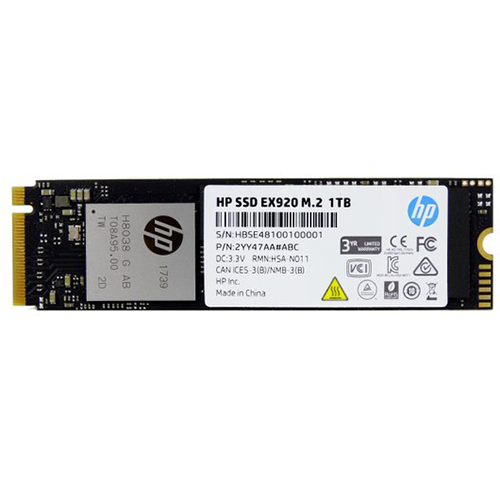
We also added the new HP EX920 1TB that comes with 64-layer Intel Micron Flash Technologies (IMFT) flash and the SMI SM2262 controller. This NVMe SSD offers a great blend of price and performance. It lacks Samsung's high endurance rating, but it makes up for that shortfall with its low $369.99 price point. We also included the Plextor M9Pe and SanDisk Extreme Pro NVMe 3D with Toshiba/SanDisk 64-layer flash.
Testing Details
We tested the 970 EVO SSDs with the new NVMe 3.0.1802 driver, but some of our results were lower than we expected. In the past, Samsung's custom NVMe driver has been faster during random workloads than the in-box Windows driver. In this case, the Windows driver is faster, which Samsung might address in a future NVMe driver update.
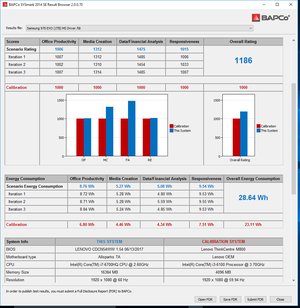
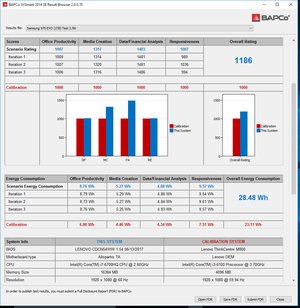
The Samsung driver (left) notched a 1007 responsiveness score in the BAPCO SYSmark 2014 SE test, while the Microsoft driver (right) landed at 1015. In this test, just a few points indicate a much larger change than we see in many of our other tests.
We also noticed another abnormality. Each test runs three times and the scores for each run are usually nearly identical. That's not what happened here. The Samsung driver scored 989, 1036, and 994, while the Microsoft driver scored 1006, 1033, and 1007. For comparison, the new WD Black scores 1009, 1007, and 1008.
The results suggest the current firmware has consistency issues. SYSmark uses real applications for performance measurements, so we know the issue is not limited to synthetic benchmarks.
Get Tom's Hardware's best news and in-depth reviews, straight to your inbox.
256Gbit vs. 512Gbit NAND Die
As we've stated, all EVO models come with 64-layer flash, but Samsung uses two different die. The 1TB 970 EVO has 256Gbit (32GB) die while the 2TB model has new 512Gbit (64GB) die, so we expect at least some difference in performance. Samsung is the first company to ship a consumer SSD with a 64-layer 512Gbit die, but Micron will follow later in 2018.
This is our first time testing an SSD with Samsung's 512Gbit die, and we couldn't have asked for a better comparison. The 1TB and 2TB drives both use 32 dies spread across two packages. The 2TB EVO also has twice the amount of DRAM to keep the flash-to-DRAM ratio consistent.
Samsung lists the 2TB EVO with slightly faster sequential read and random write performance than the 1TB EVO, but that wasn't the case in our testing.
Sequential Read Performance
To read about our storage tests in-depth, please check out How We Test HDDs And SSDs. We cover four-corner testing on page six of our How We Test guide.
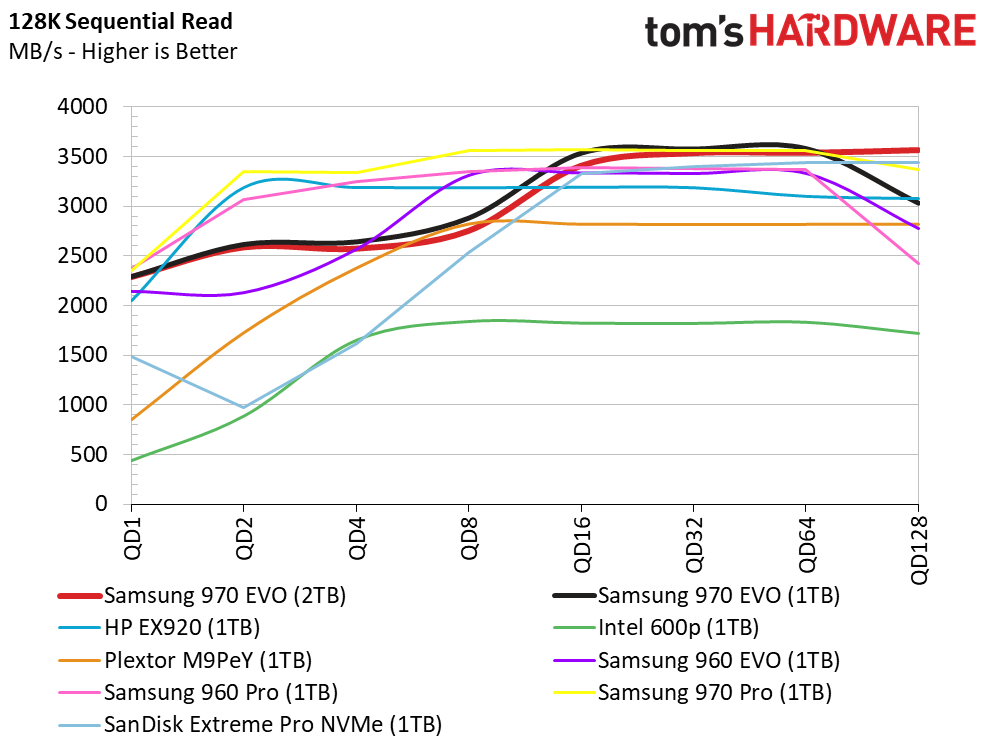
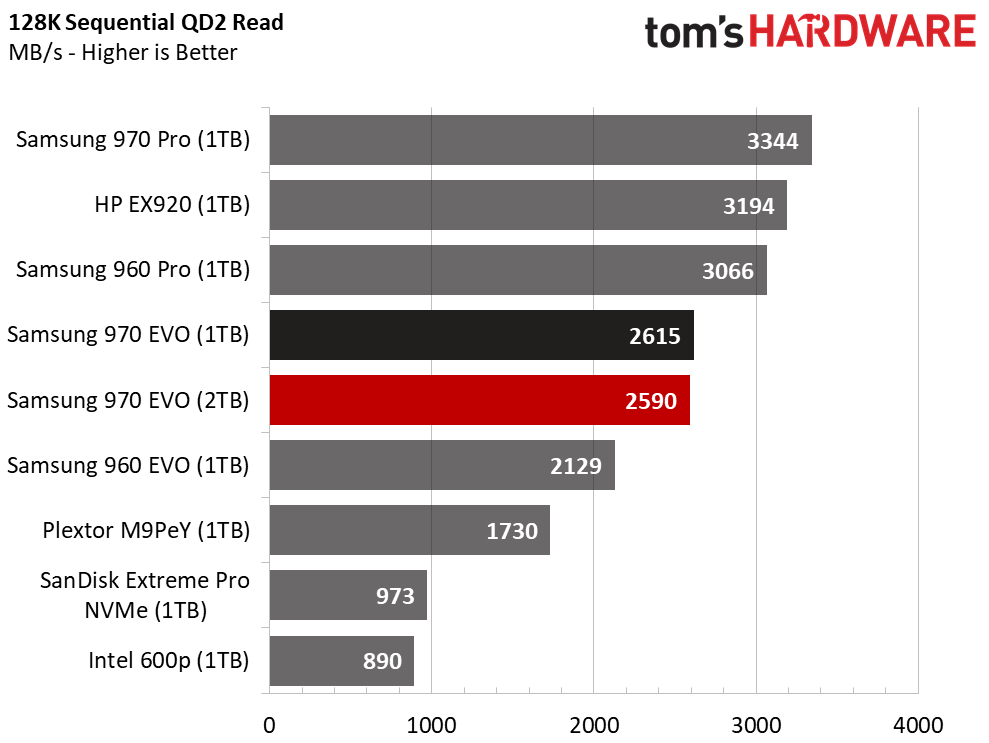
You'll notice the 970 EVO SSDs have a different performance curve as we ramp up the workload. They still have great QD1 performance, but they don't scale as well as the previous-gen models from QD2 to QD4. In contrast, the 970 Pro scales just like the older models.
Sequential Write Performance
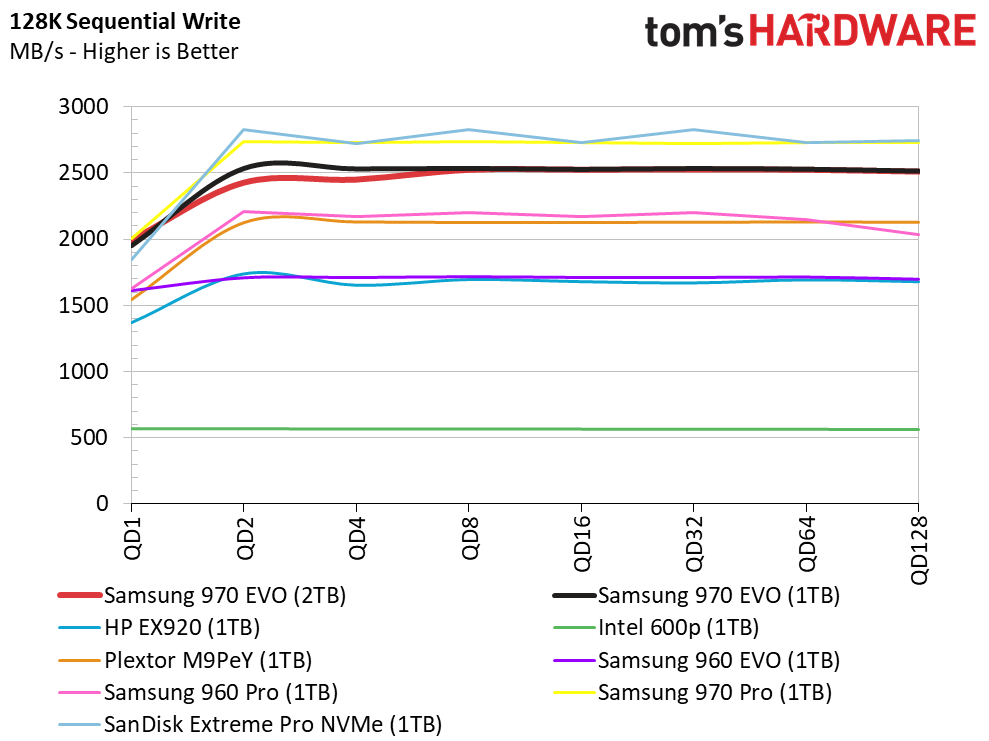
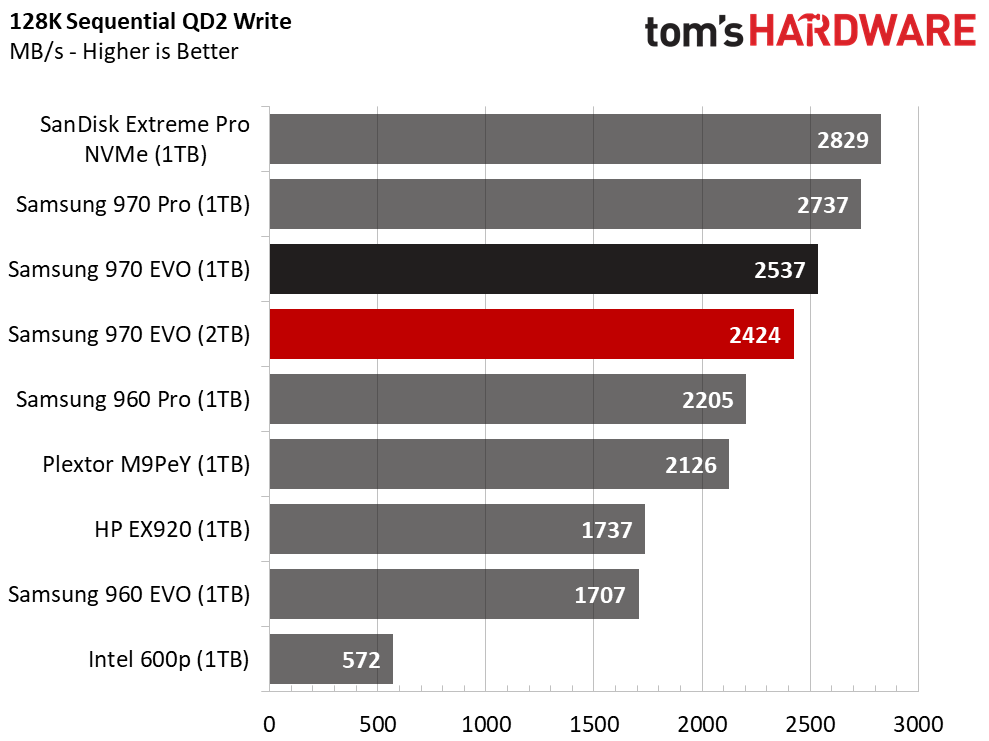
The 970's sequential write performance doesn't miss a beat as we ramp up the workload. We even beat Samsung's performance rating for the 1TB 970 EVO, and the 2TB 970 EVO wasn't far behind. Both drives show a solid increase over the 960 EVO and the 960 Pro.
Sequential Write Cache Test
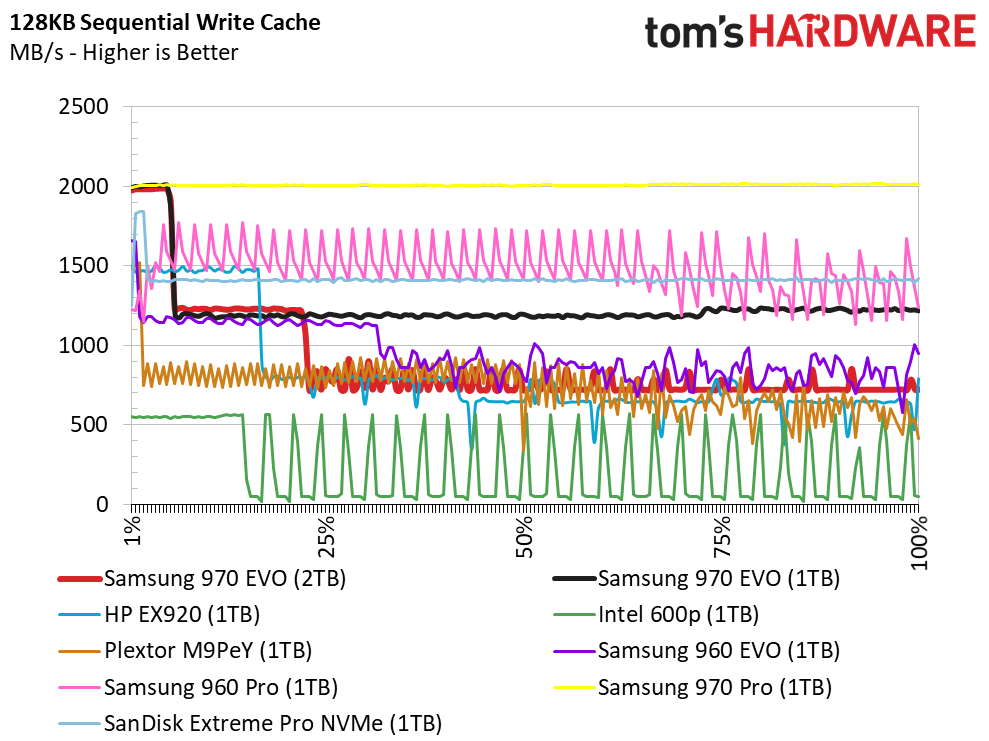
This test measures performance as we write data to the entire usable capacity of the drive. The test allows us to see how much sequential data you can write before the performance-boosting SLC buffer runs out of space and you hit slower native-TLC performance.
At first, both 970 EVOs write 128KB sequential data at the same speed as the new 970 Pro. They both drop to around 1,200 MB/s (as advertised) after the buffer is full. The 1TB 970 EVO continues to maintain 1,200 MB/s for the rest of the test, but the 2TB 970 EVO drops again to roughly 800 MB/s. It may sound like a significant decline, but you will likely never see this performance tier. The last drop happens after the test writes approximately 500GB of data to the 2TB 970 EVO.
Random Read Performance
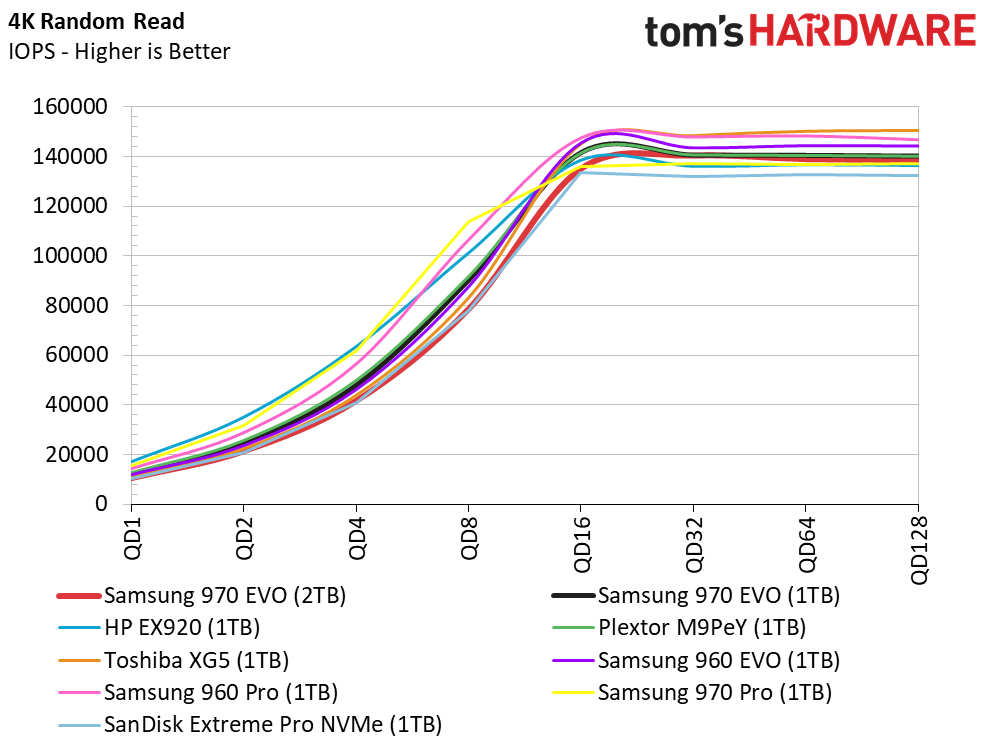
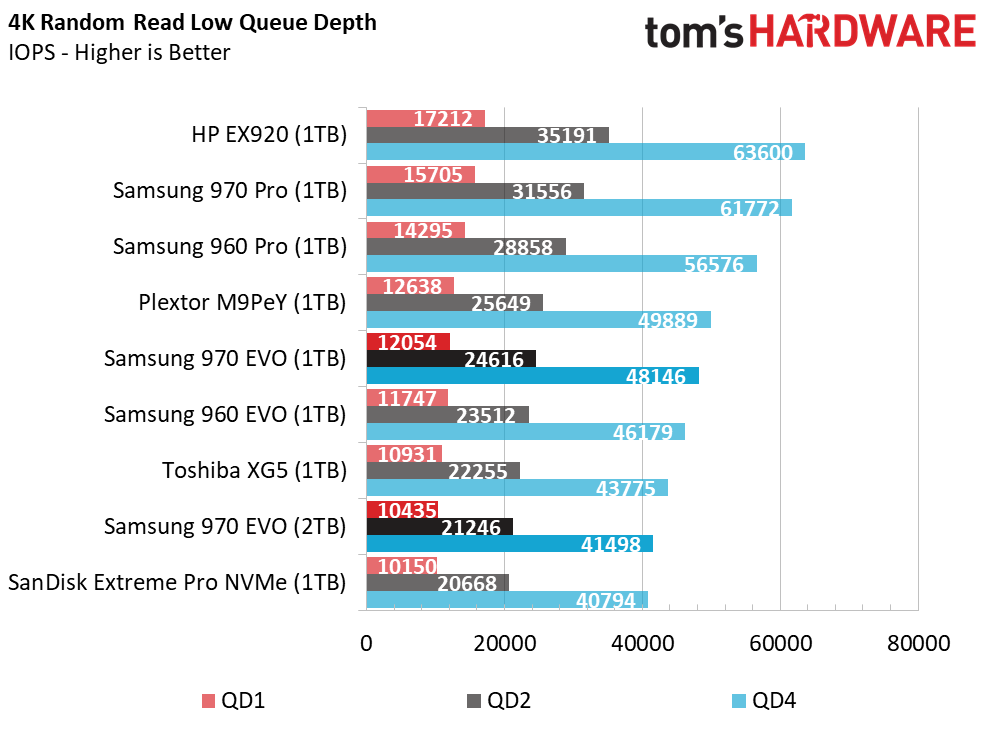
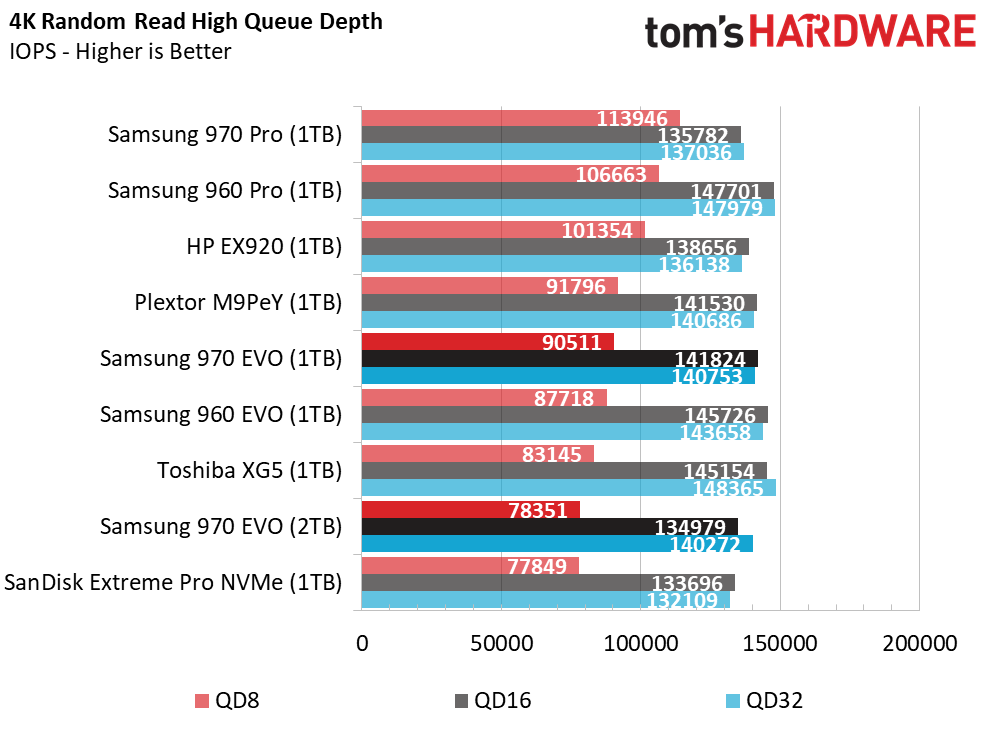
We noticed the Samsung drives lose some performance with our new burst testing. Random data reads typically come in bursts from your drive, so our test is a better representation of real-world performance with TLC-based SSDs. Samsung says the new 970 EVO can achieve 15,000 IOPS at QD1. We went back and tested with our older sustained workload, and the Samsung drives meet their performance specifications. The other products also get a small performance bump from the extended workload.
Random read performance has a direct relationship to your PC's responsiveness, and the 960 EVO dominated these tests for years. The low queue depth chart shows how 64-layer Micron (HP EX920) and Toshiba (Plextor M9Pe) flash allows third-party SSDs to surpass the 960 EVO.
Random Write Performance
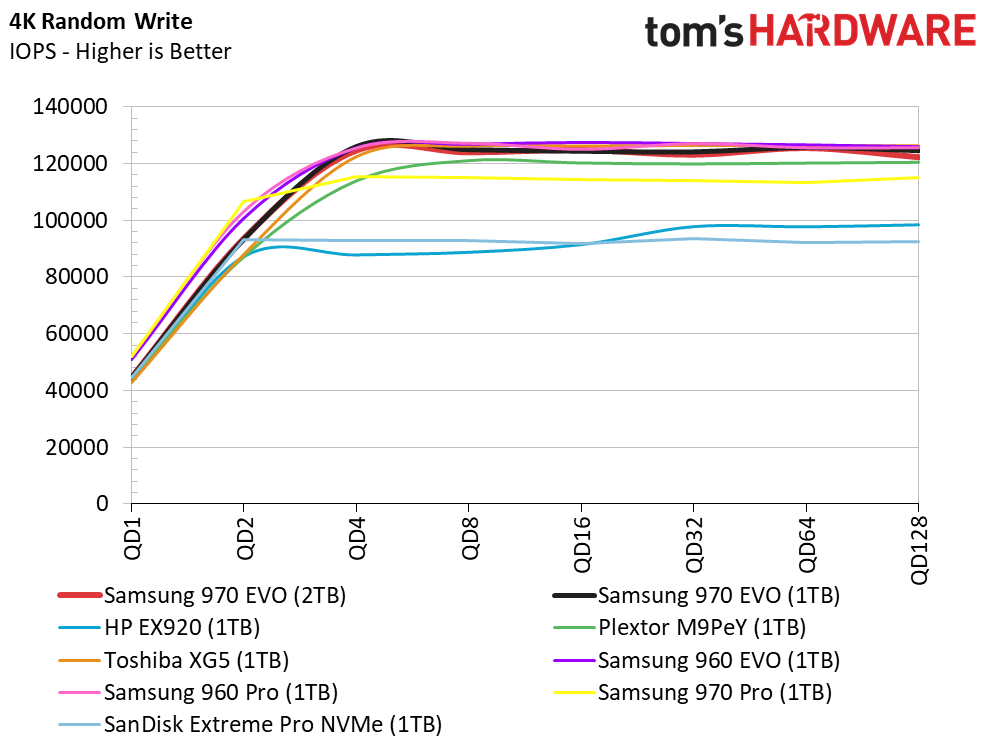
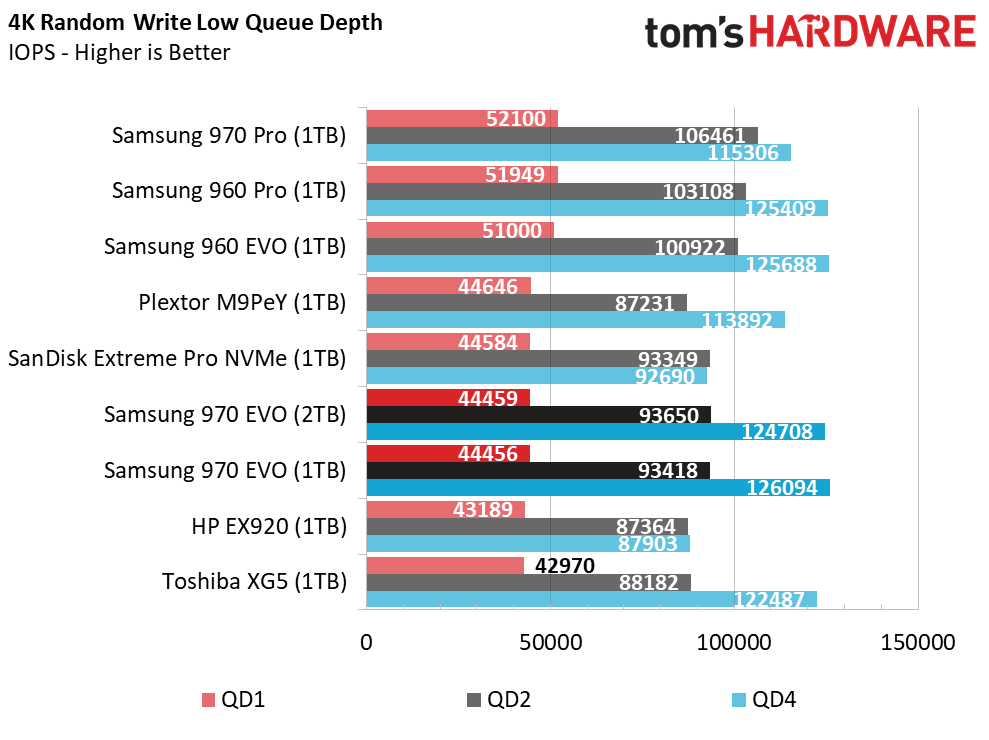
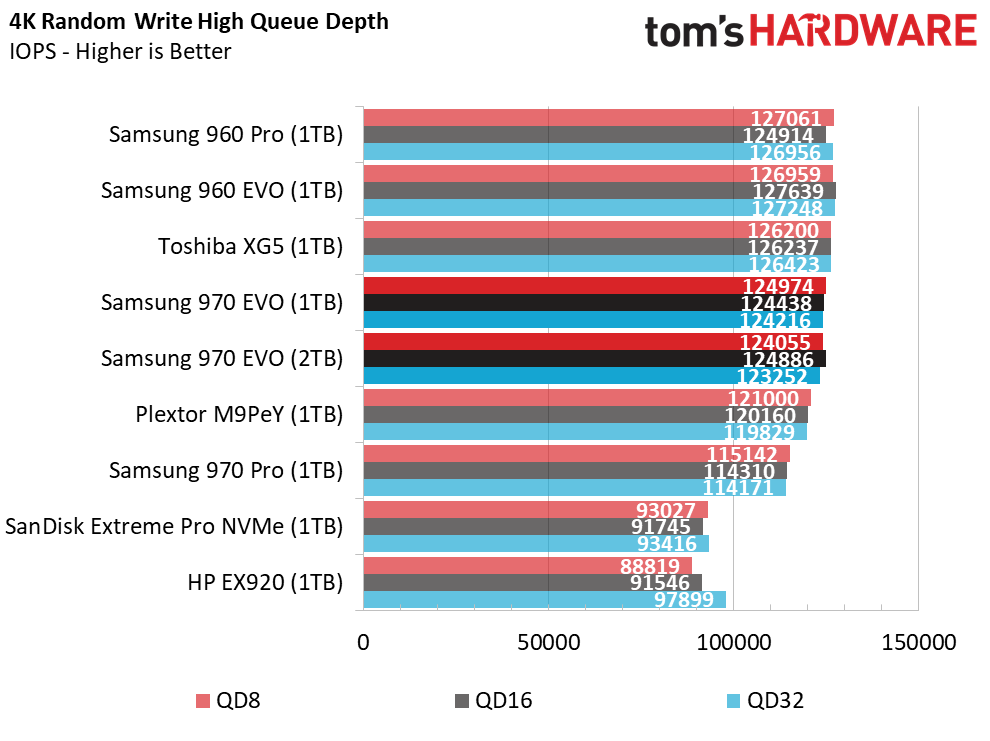
Random data writes are not particularly taxing during normal desktop workloads. They happen very often, but these drives are all fast enough to satisfy the bursty workloads. Samsung designed the Pro models for extended random write workloads. We expected the new 970 EVO to outperform the previous-gen model, but the new drives fell short in this area. We suspect the custom NVMe driver has more to do with this outcome than the actual hardware.
70% Mixed Sequential Workload
We describe our mixed workload testing in detail here and describe our steady state tests here.
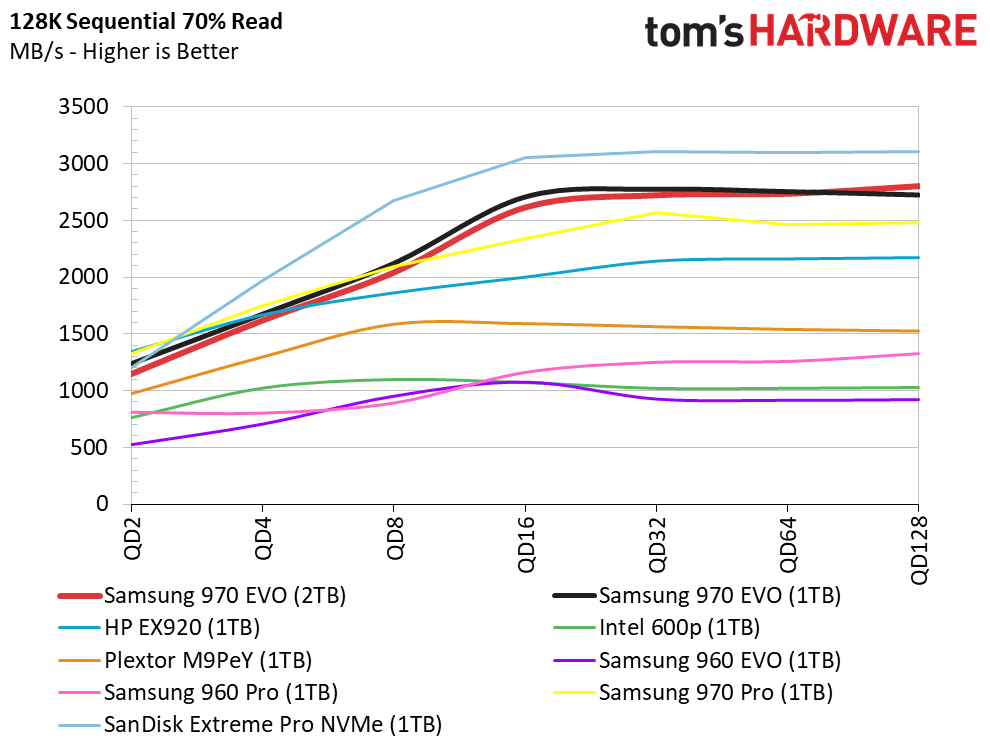
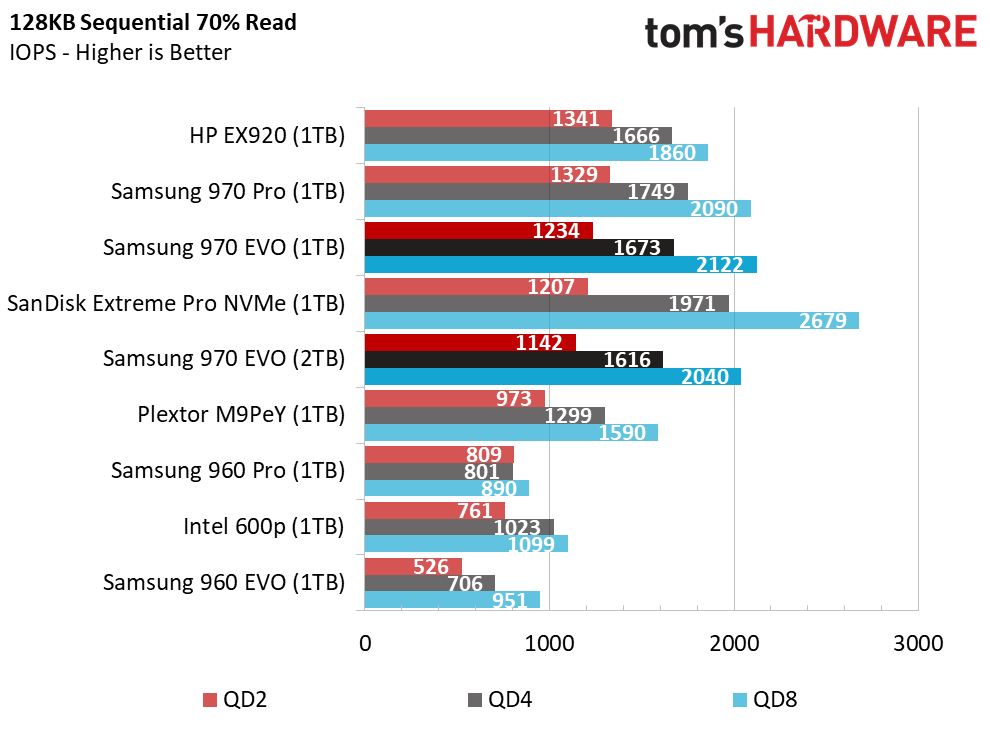
The odd QD2 sequential read performance didn't have an impact on our mixed workload test. All of Samsung's NVMe SSDs are very similar at QD2 and QD4.
70% Mixed Random Workload
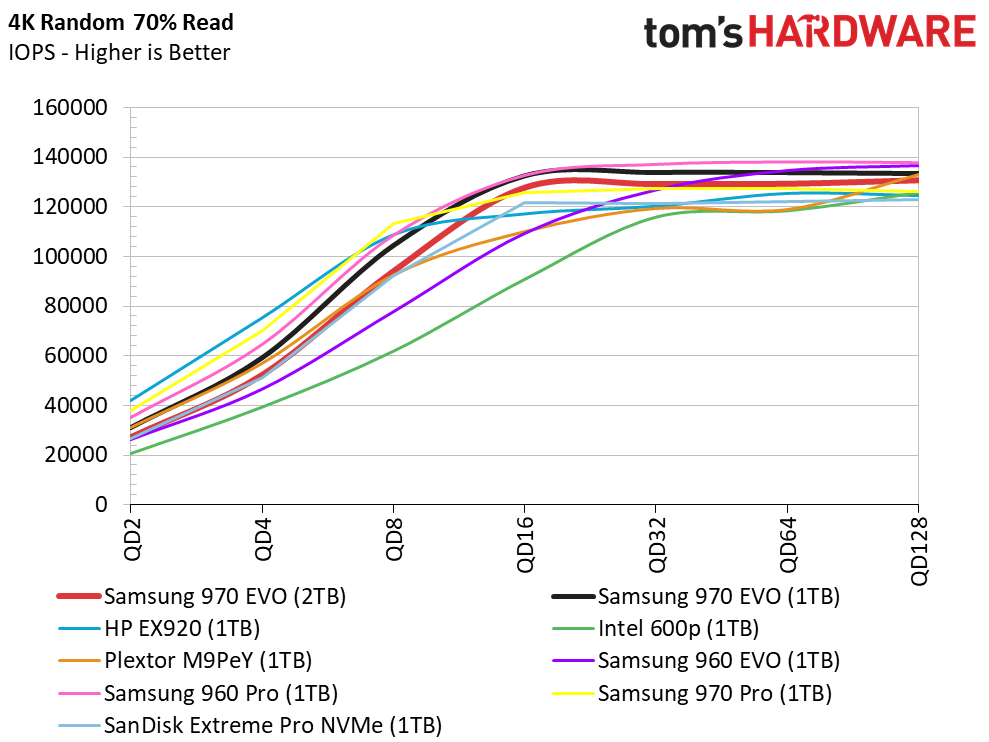
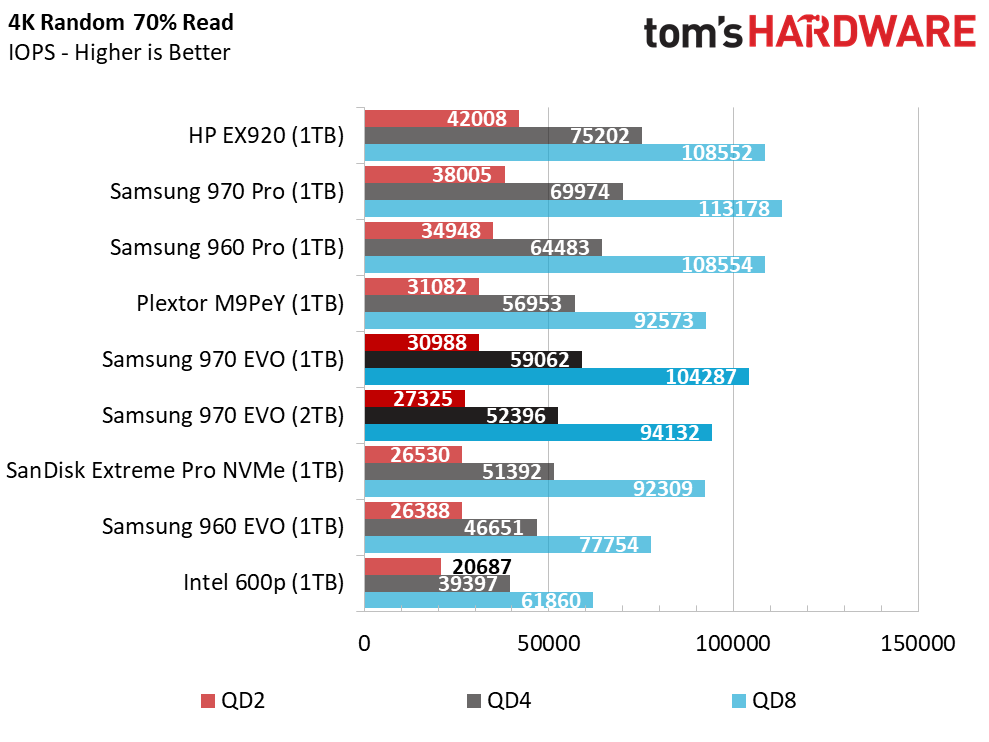
The low random write performance had a slight impact on the 970 EVO in our mixed workload. Again, we see the previous-gen models perform slightly better, but they're mature products that have been through extended refinement cycles. Samsung, like other companies, has a history of improving performance through firmware updates, so we could see these results improve in the future.
Sequential Steady-State
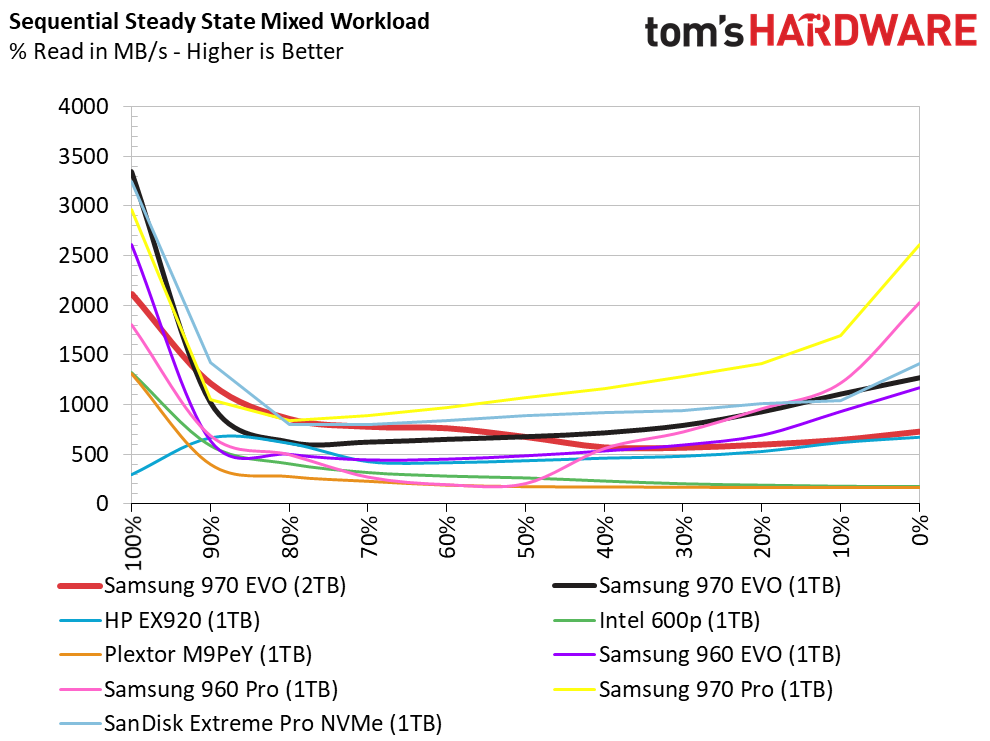
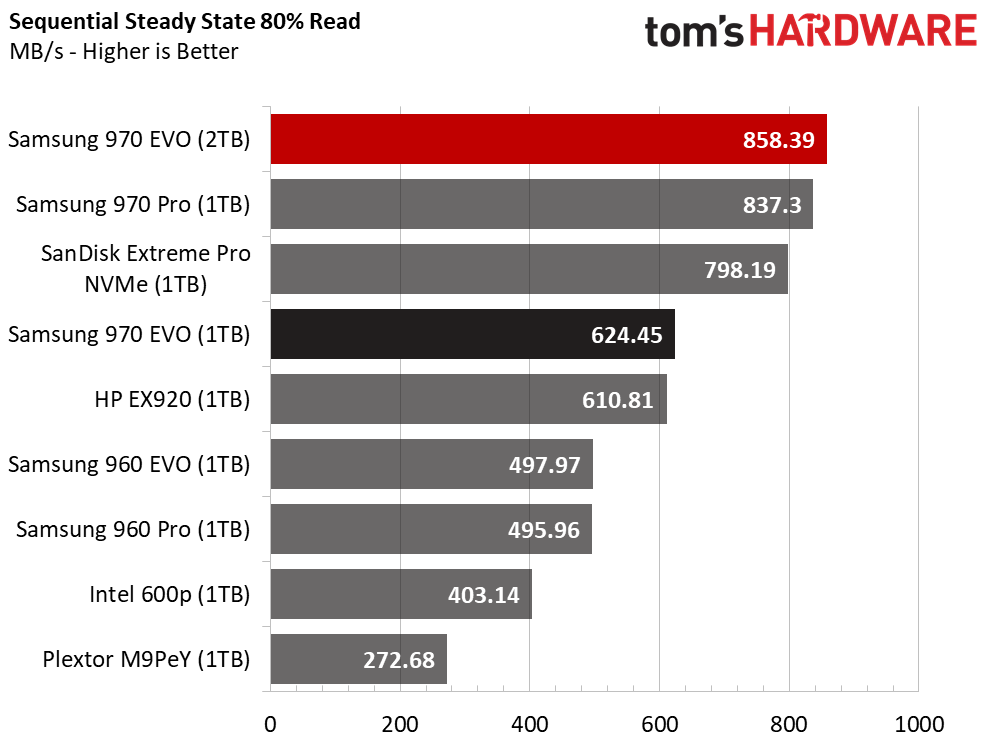
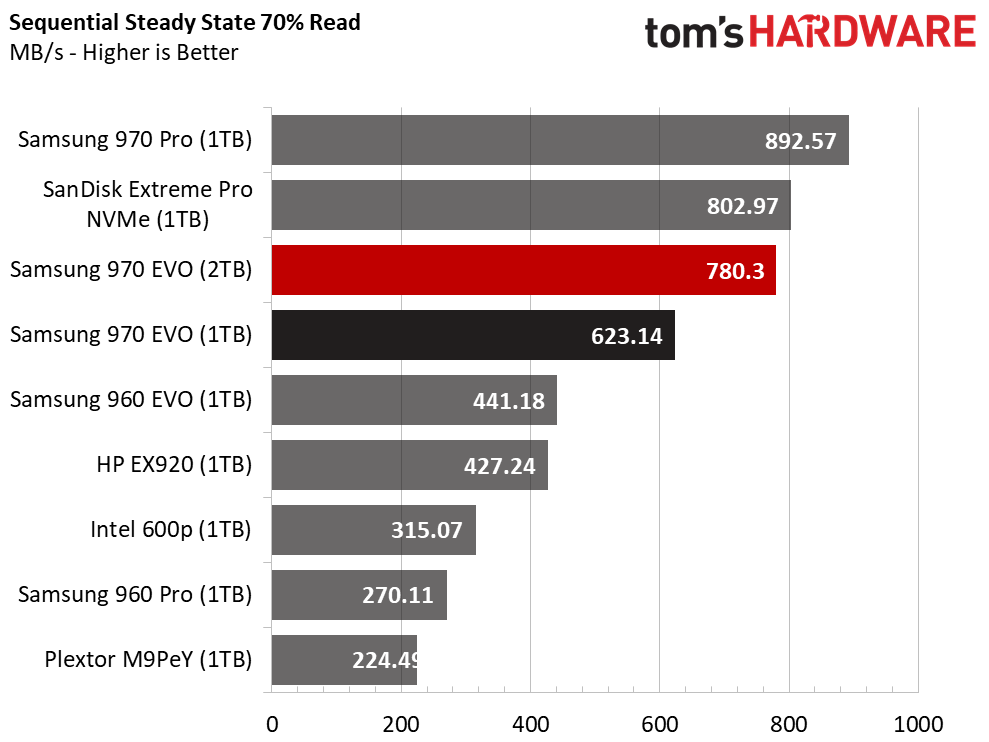
The 970 EVO SSDs have very strong sequential steady-state performance even though they weren't developed for workstation-class workloads. We put the drives through a ten-hour bake session with a 128KB write workload before we record a single measurement. We start measuring with 100% writes (right side of the chart) and progress to 100% reads (left side). Consumer workloads generally fall between 70% and 80%, while most workstation workloads fall to the latter end of that scale. The 970 EVO beats the 960 EVO easily.
Random Steady-State
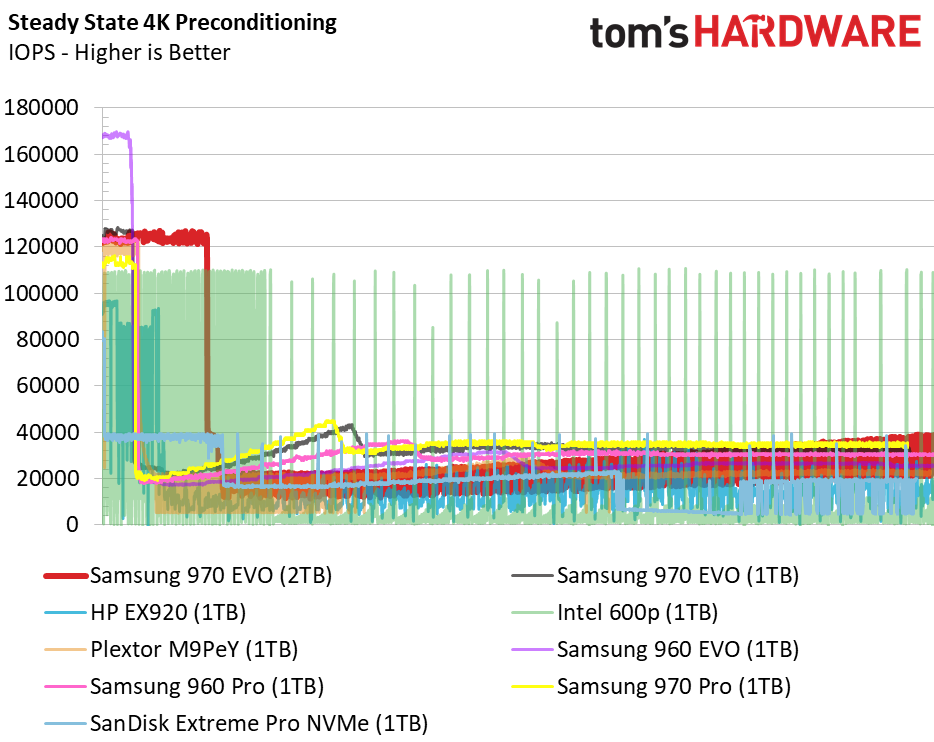
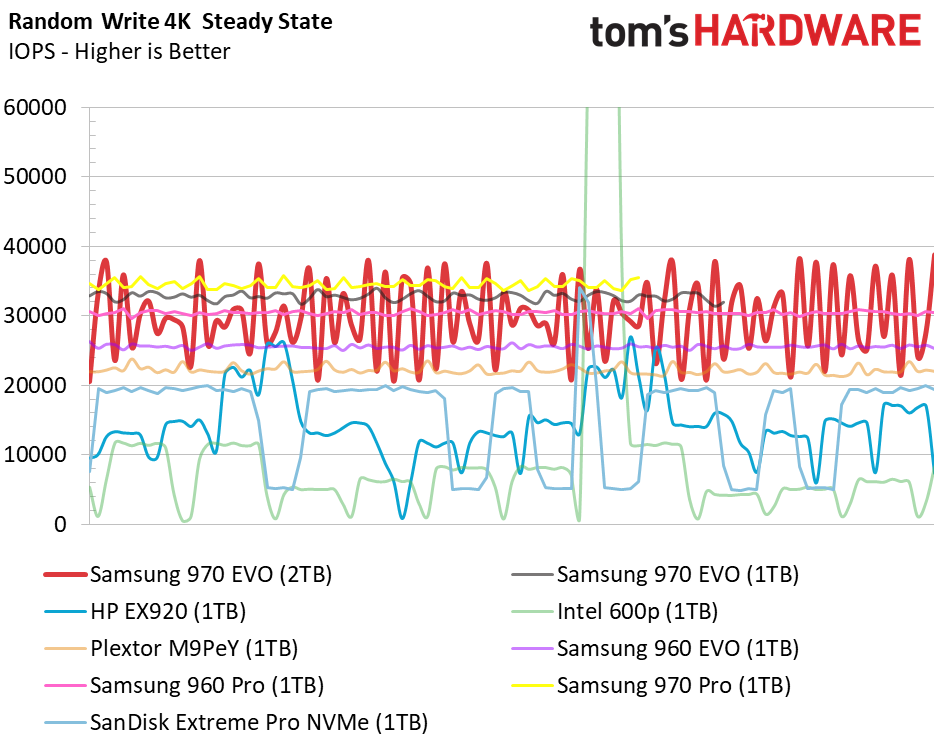
The random steady-state test shows the advantage of the 2TB 970 EVO's massive buffer. The first chart shows the entire one-hour testing period, and the second chart zooms in on the last few minutes of the test where performance has largely equalized. The 2TB EVO is less consistent than the 1TB 970 EVO, but it still delivers a solid result.
After an hour of torture, the 1TB 970 EVO delivers nearly the same random write performance as the 970 Pro. The 970 Pro is slightly faster, but the results are much closer than we expected. Neither 970 is as consistent as the 960 Pro, but they do write more data during the test.
PCMark 8 Real-World Software Performance
For details on our real-world software performance testing, please click here.
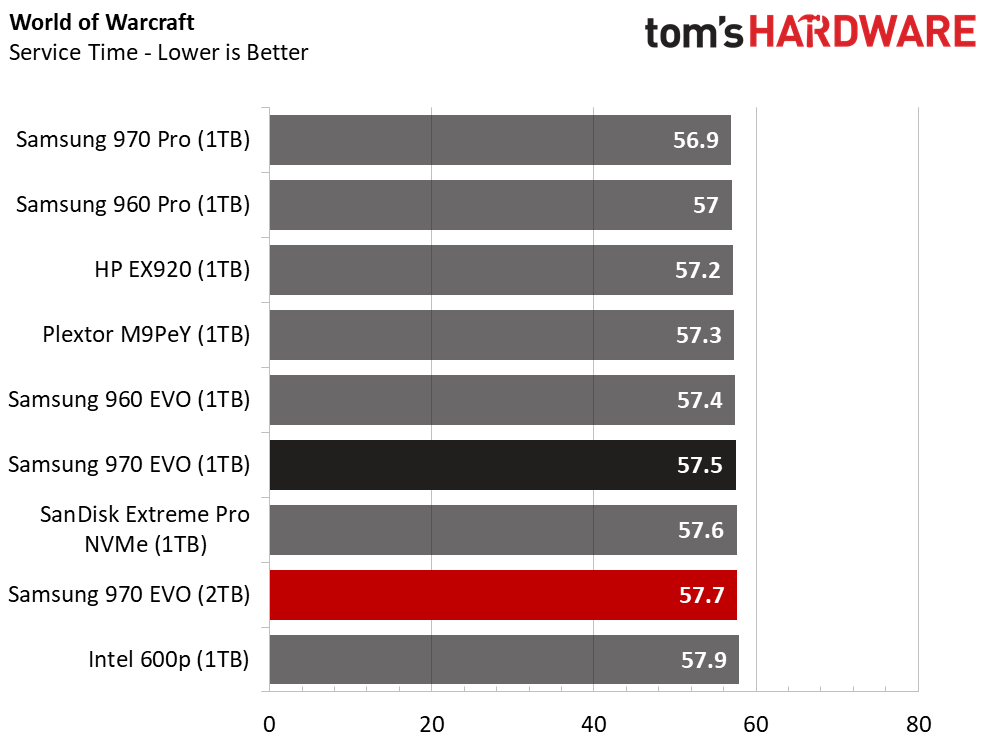
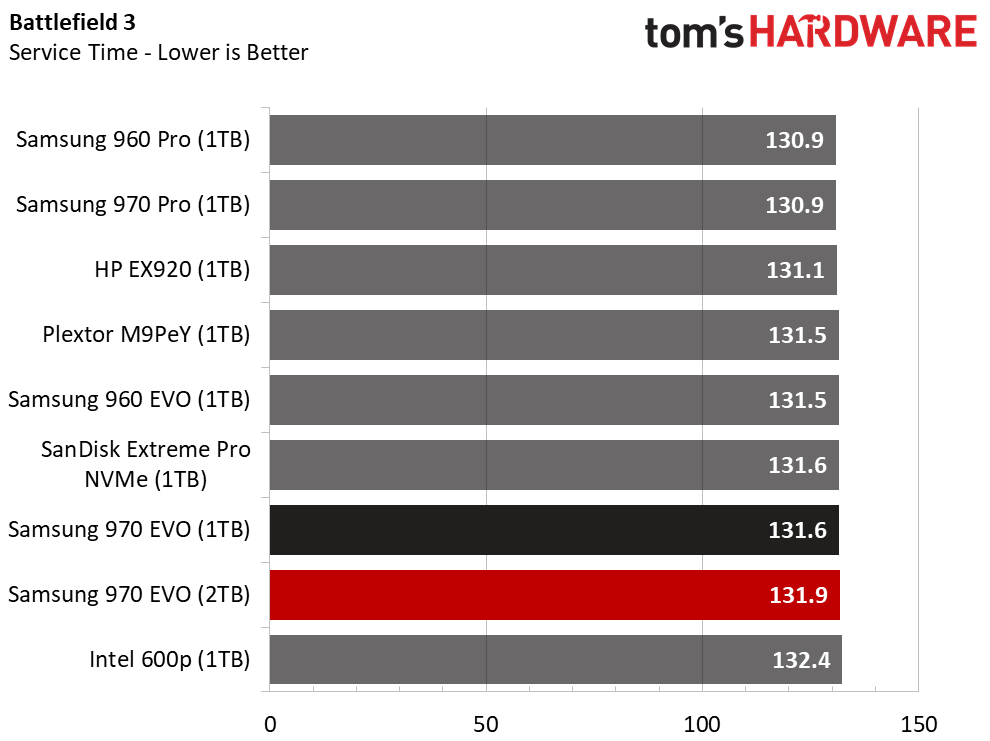
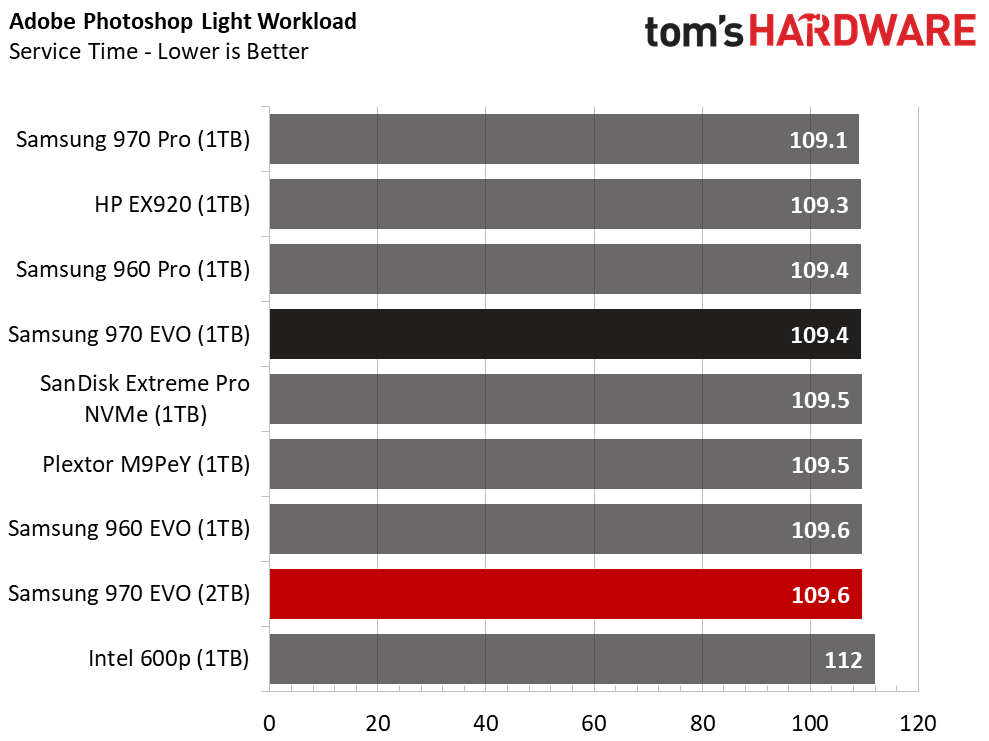
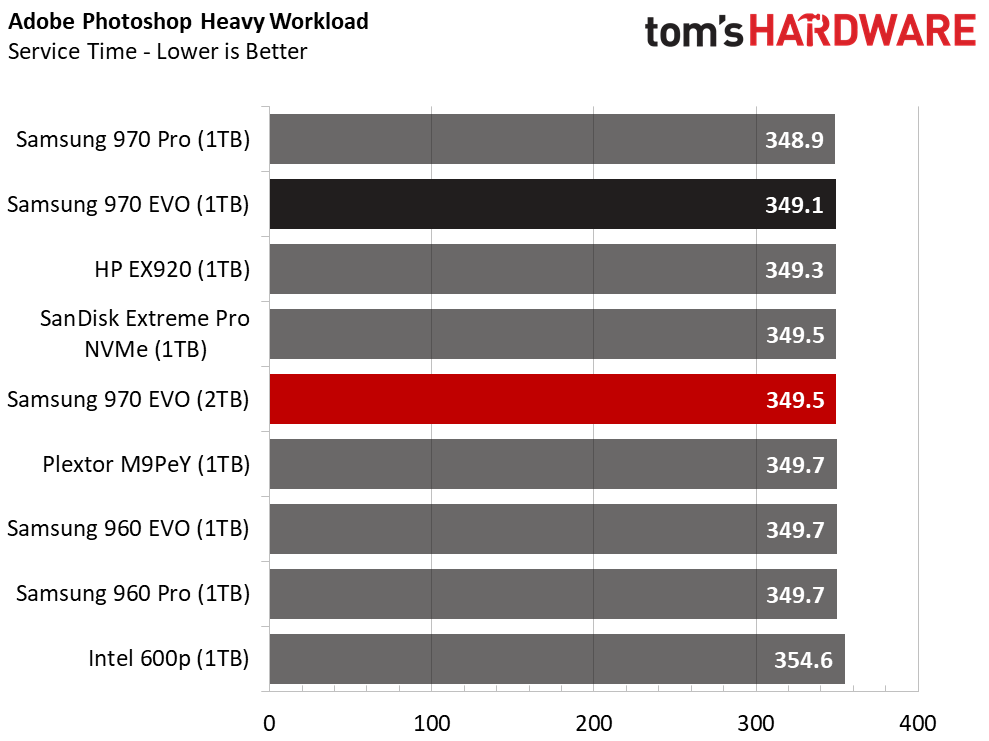
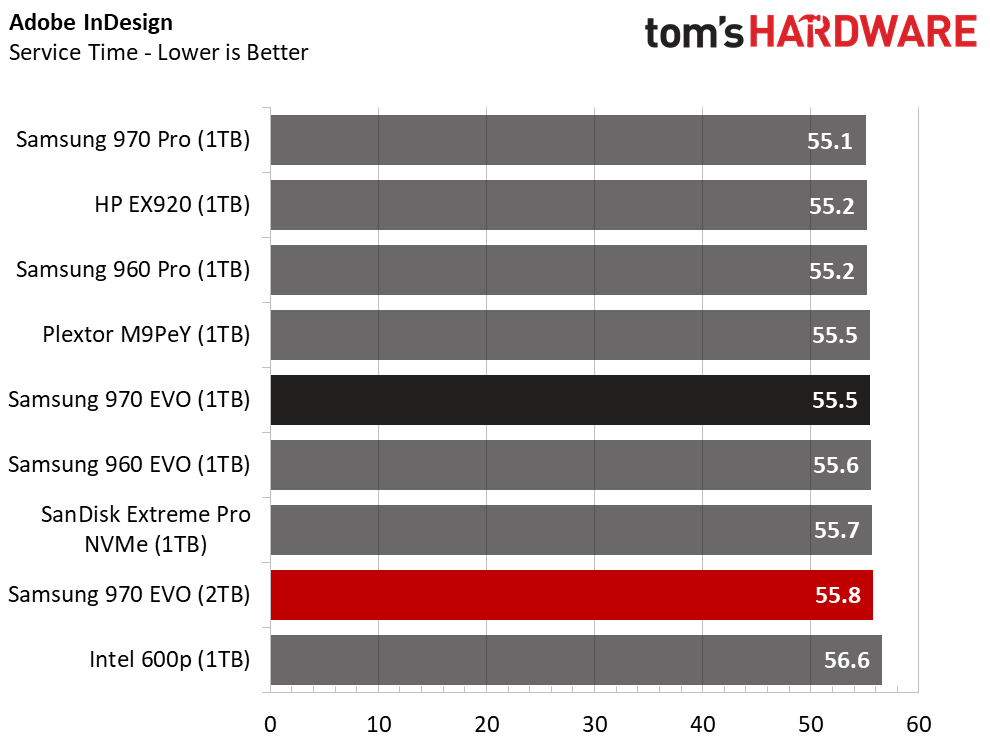
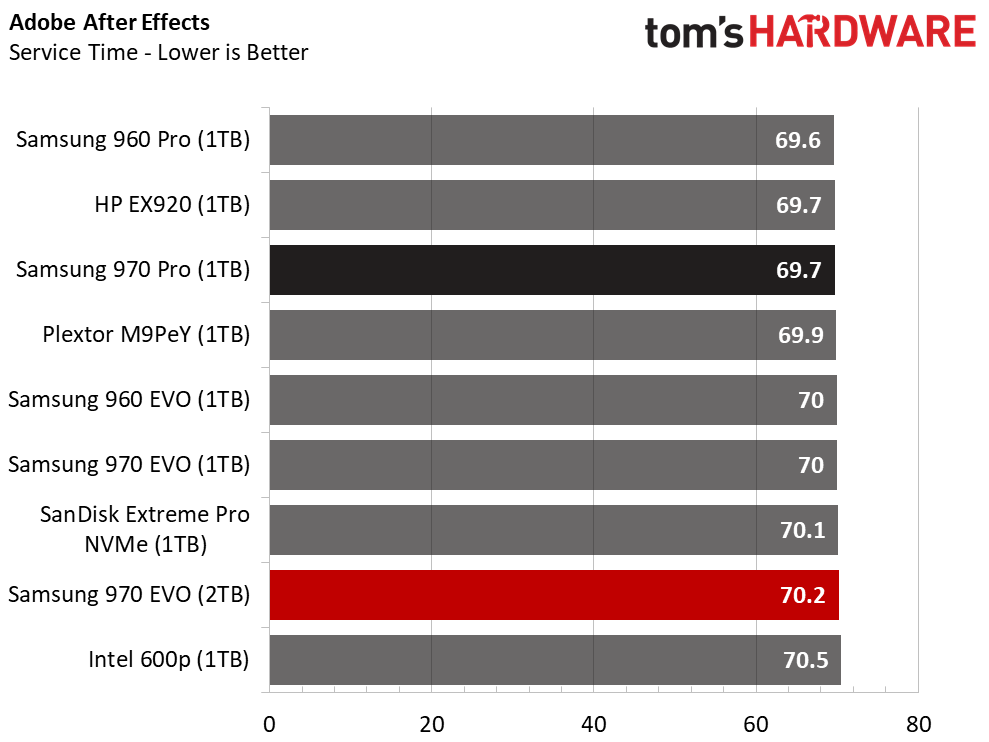
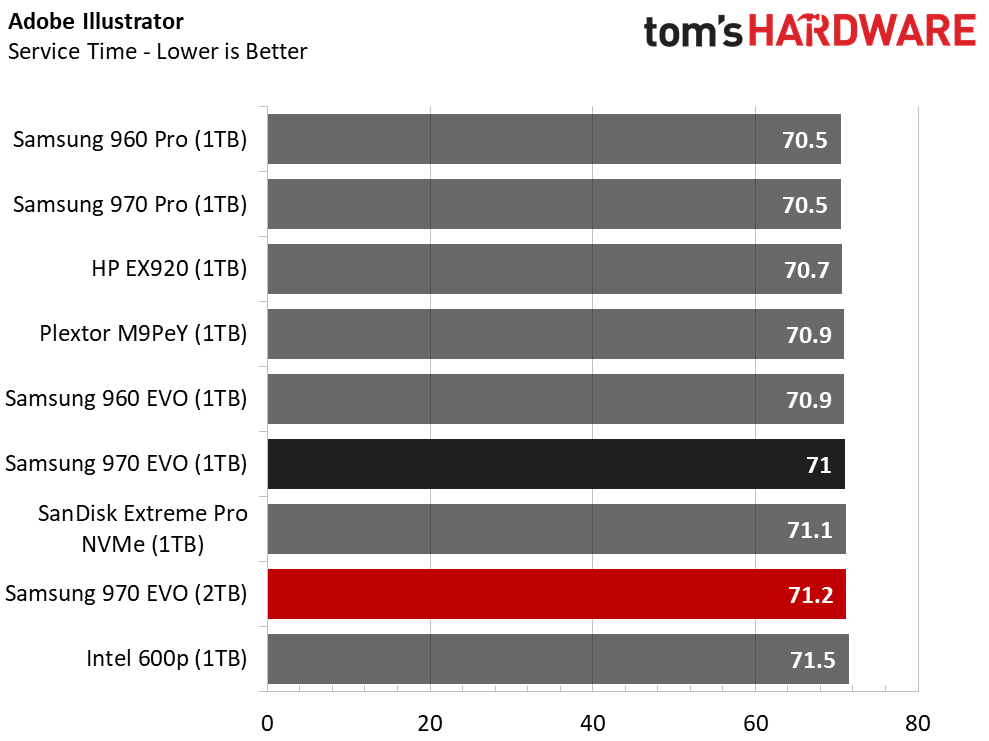
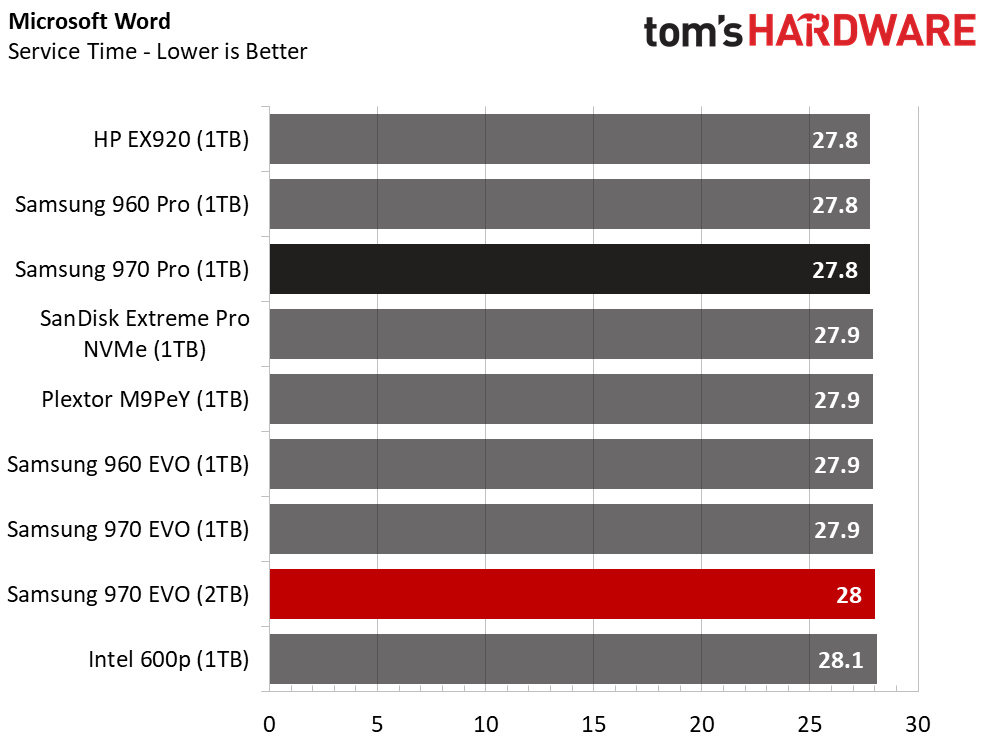
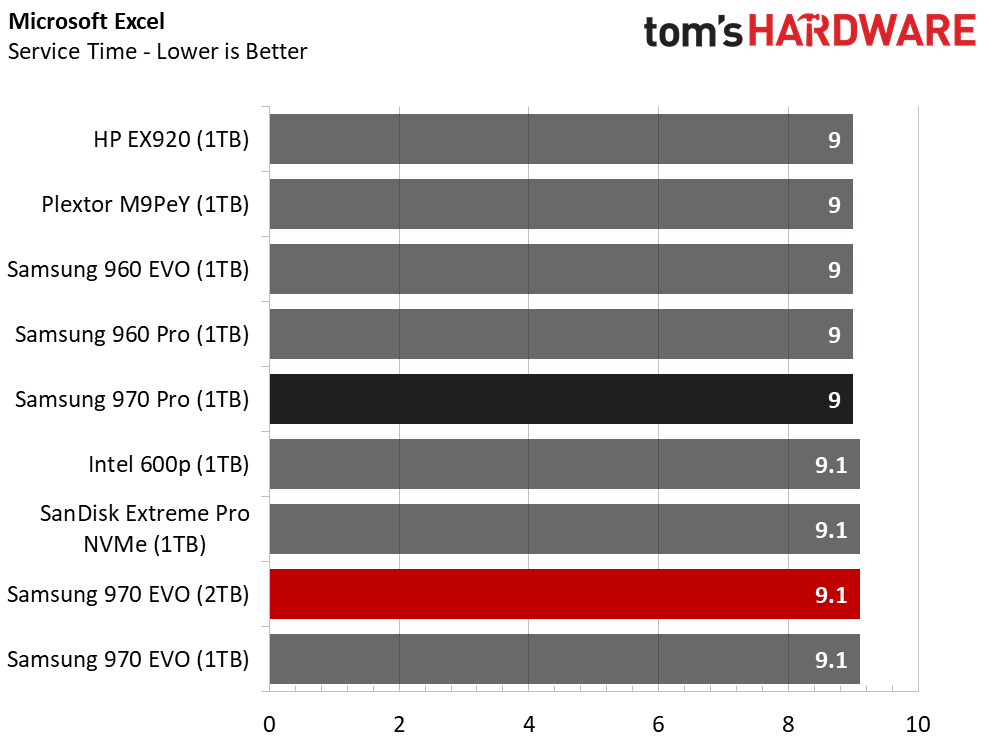
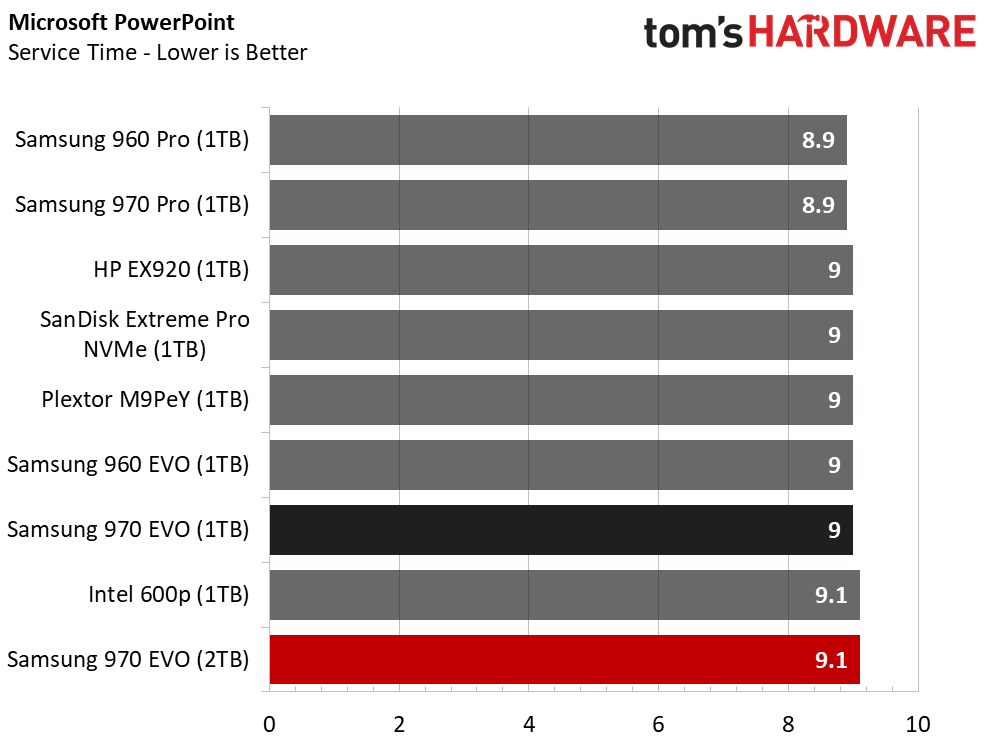
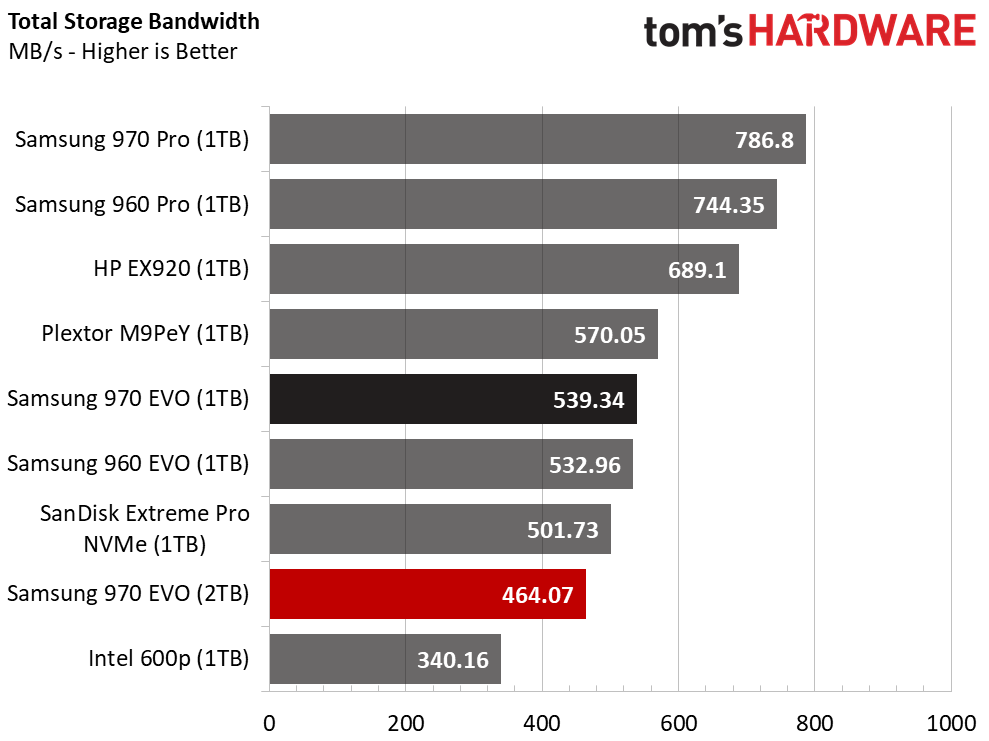
The EVO series has always shined the brightest with consumer applications, but this is the 970's most disappointing test result. The SATA EVO SSDs usually even outperform the Pro models thanks to their lightning-quick buffer. The NVMe EVO's have trailed the Pro models in some of the more write-intensive tests, but not by a great amount.
Overall, the EVO SSDs usually outperform all competing products in this test, but that's not the case today.
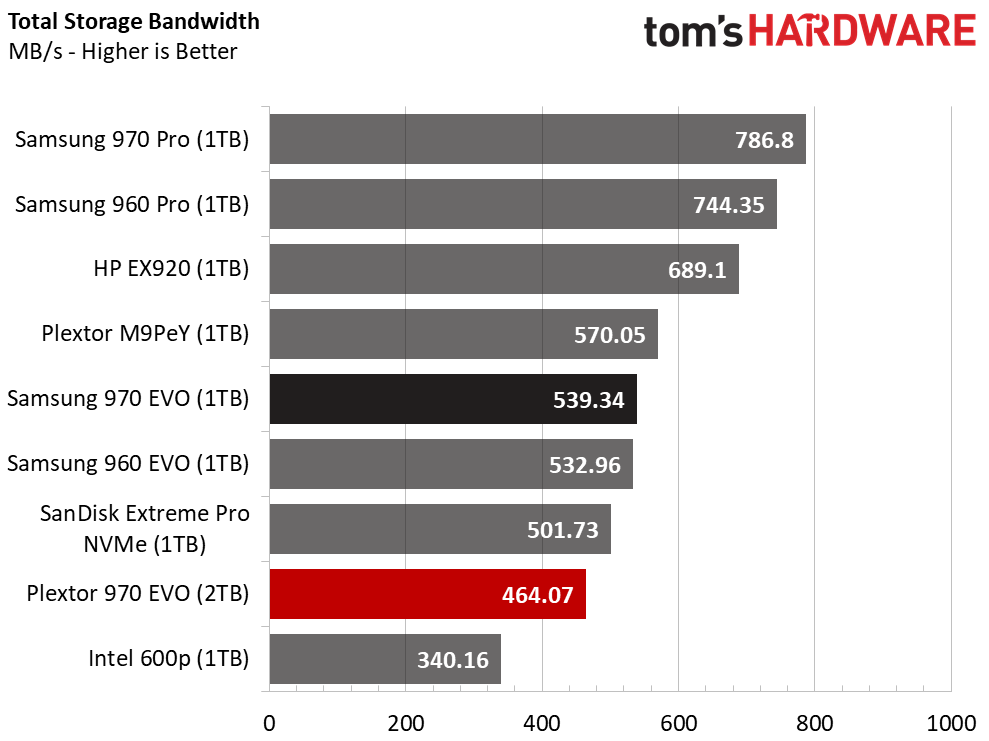
Application Storage Bandwidth
We can see how emerging SSDs like the Plextor M9Pe and HP EX920, both of which come armed with competing 64-layer flash, have surpassed the 1TB 960 EVO. We expected the new 970 EVO SSDs to rise to the occasion, so to speak, but they land below most competing products once again.
PCMark 8 Advanced Workload Performance
To learn how we test advanced workload performance, please click here.
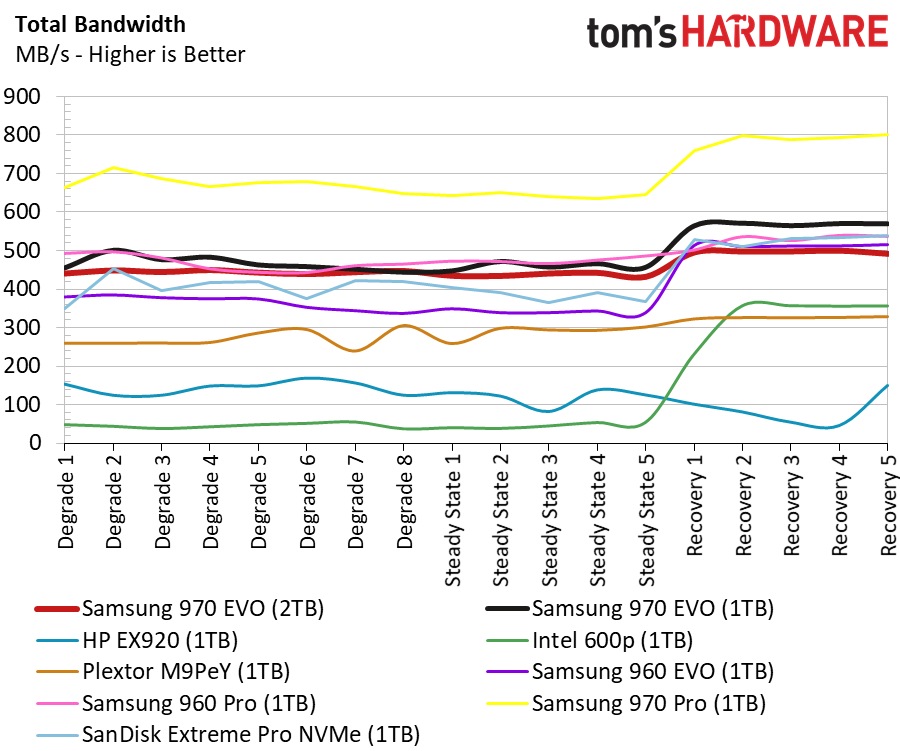
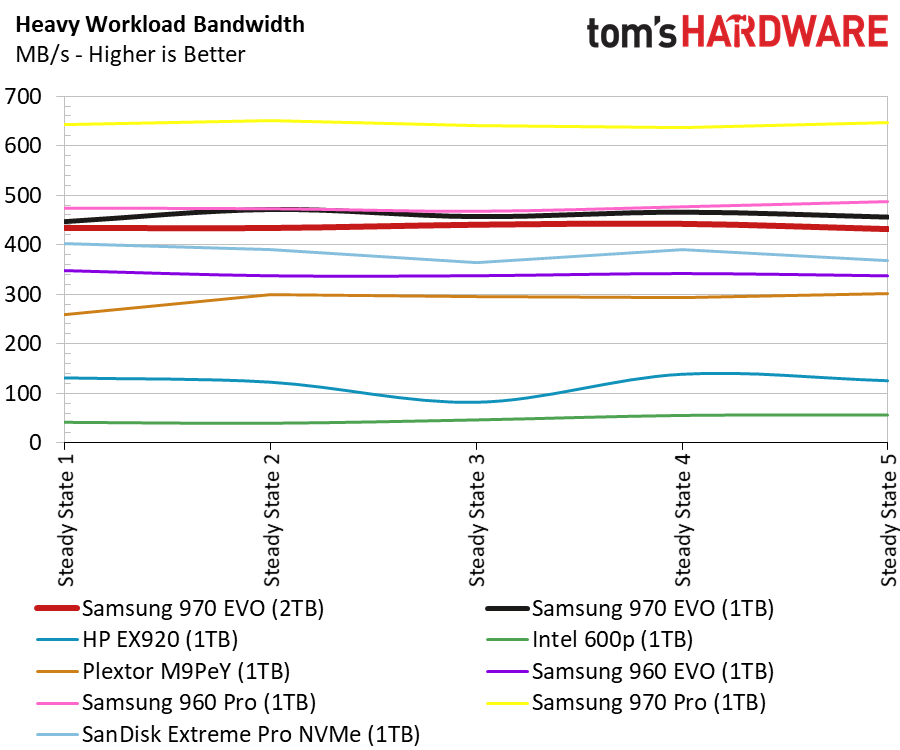
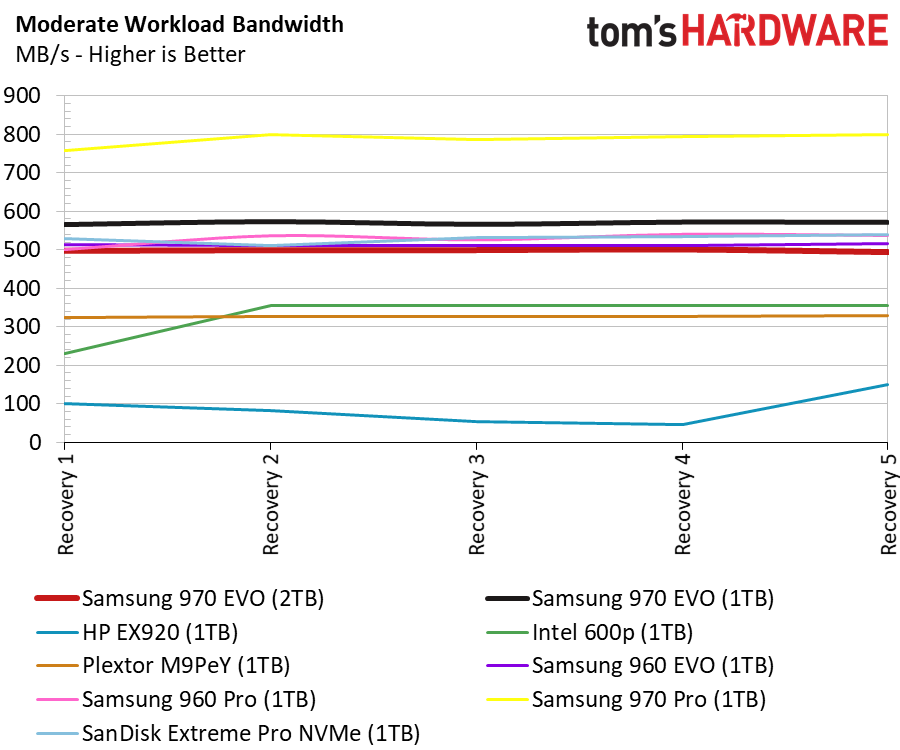
Samsung's garbage collection algorithm is one of the best ever developed. Even though the 970 EVO trailed many of the drives in the application tests, they recover much faster after a heavy workout.
Total Service Time
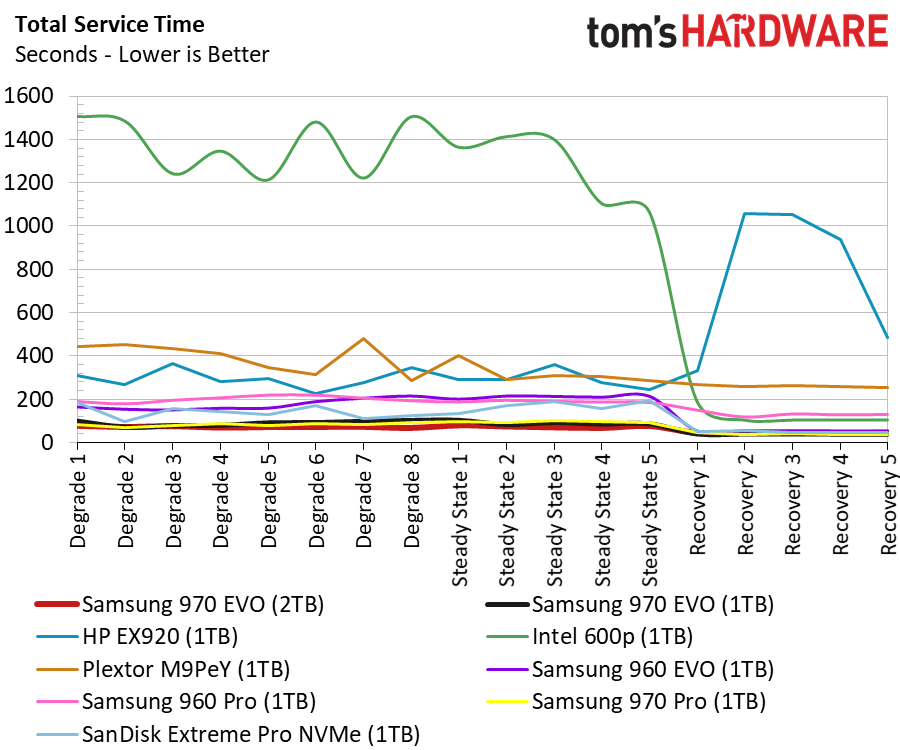
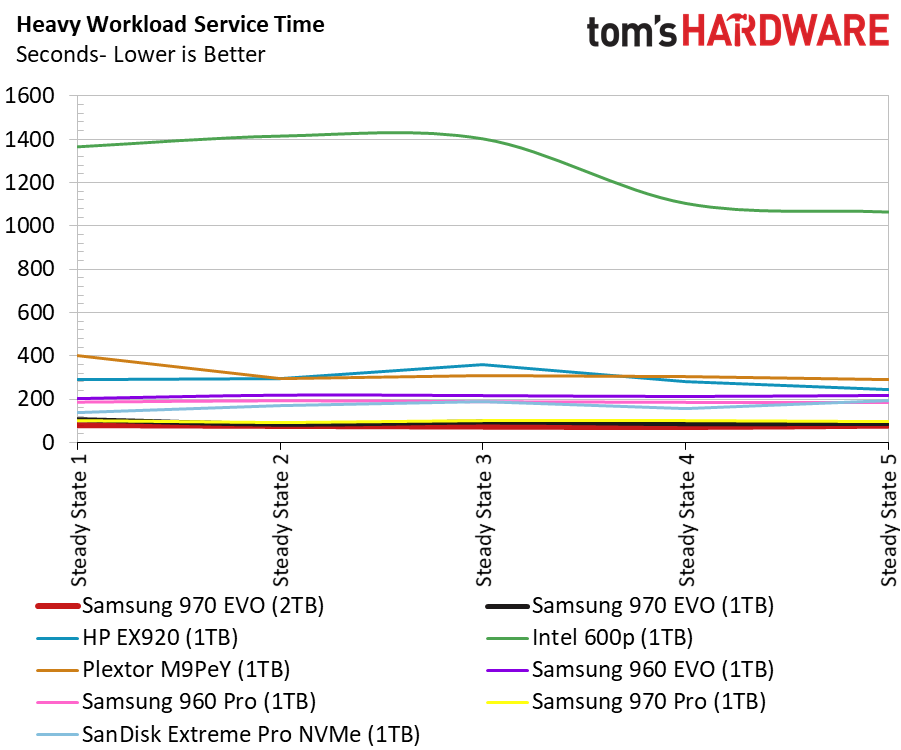
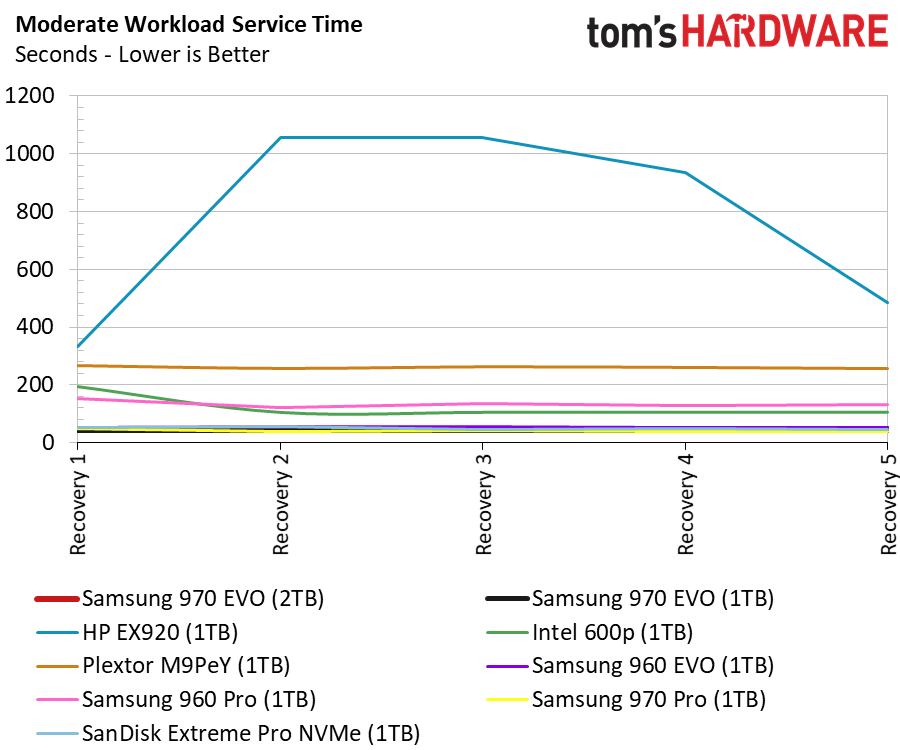
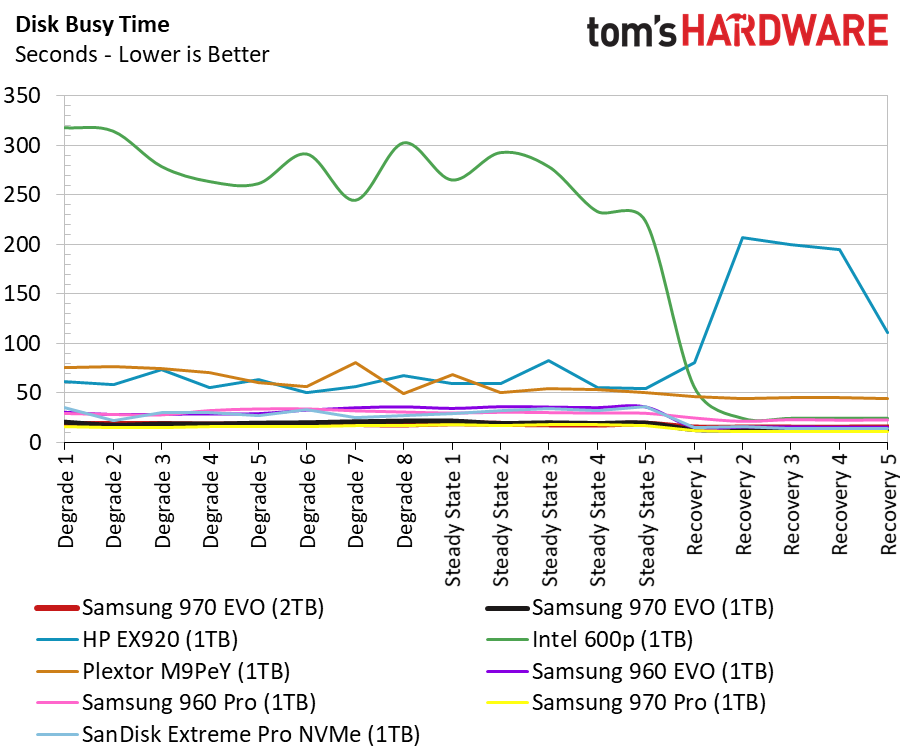
The service time (disk busy time plus latency) results find the Samsung 970 SSDs clumped together with the 960 EVO during the recovery phase. The 970 models are also similar during the steady-state phase, much like we saw in our two other steady-state tests.
Disk Busy Time
The disk busy time test shows how long the drives actually worked to complete the tasks. This is an important measurement because it helps us understand SSD power consumption. The faster a drive can complete a task, the faster it can return to a low power state. The test is not an actual measurement of power consumption, but it serves as a good reference if an SSD performs poorly in our power tests.
BAPCo SYSmark 2014 SE Responsiveness Test
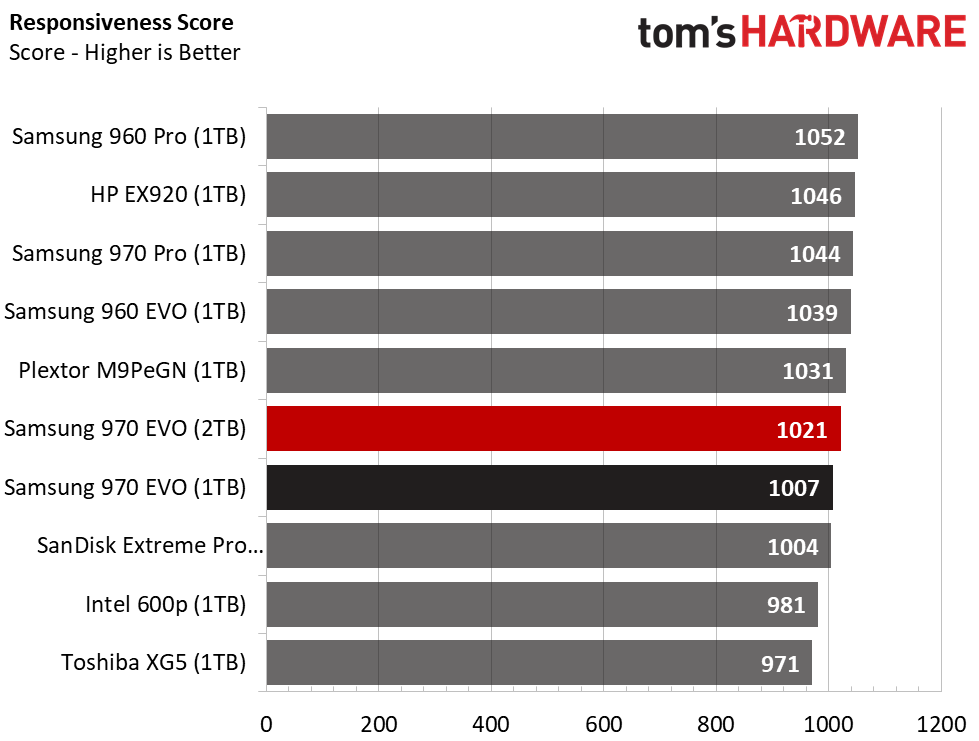
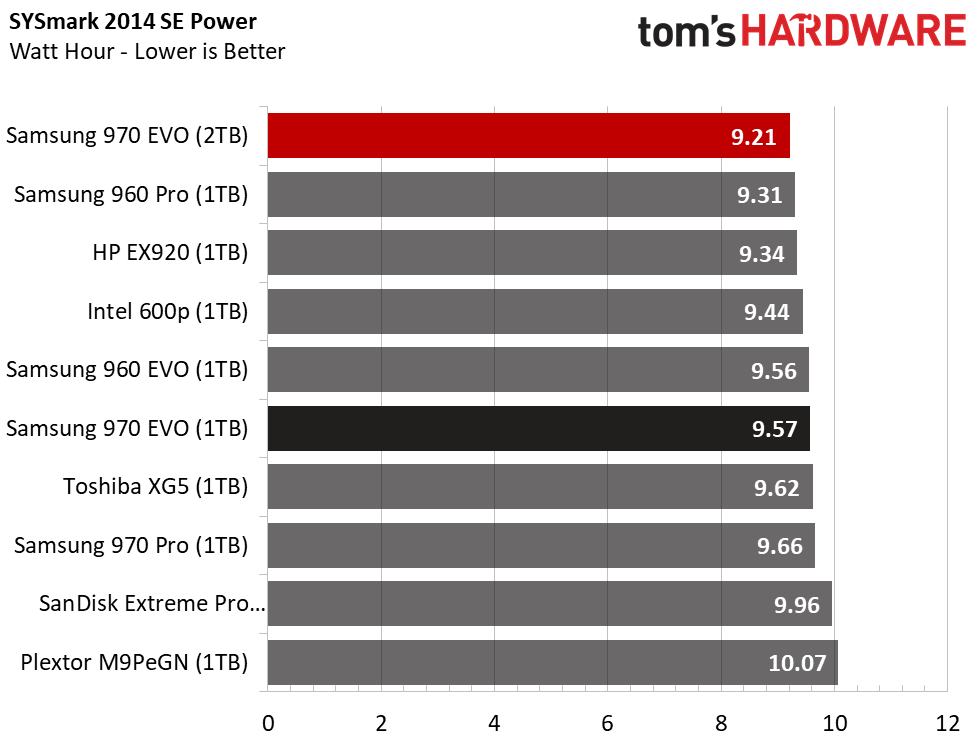
We covered our SYSmark test with the 1TB 970 EVO at the top of the page. The 970 EVO models both had much more variance between the best and worst scores than we typically see across the three test iterations.
The 2TB EVO trailed the 1TB 970 EVO in most of our tests, but it had a much better responsiveness score. It still exhibited a lot of variance between the three scores, though.
BAPCo MobileMark 2012.5 Notebook Battery Life
To learn how we test advanced workload performance, please click here.
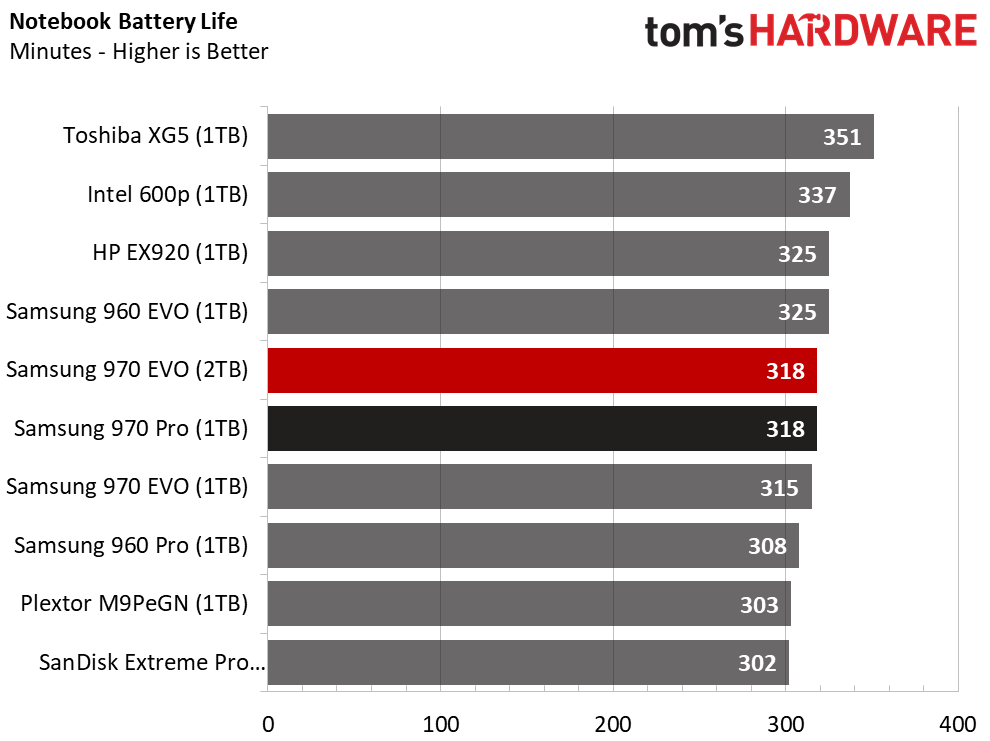
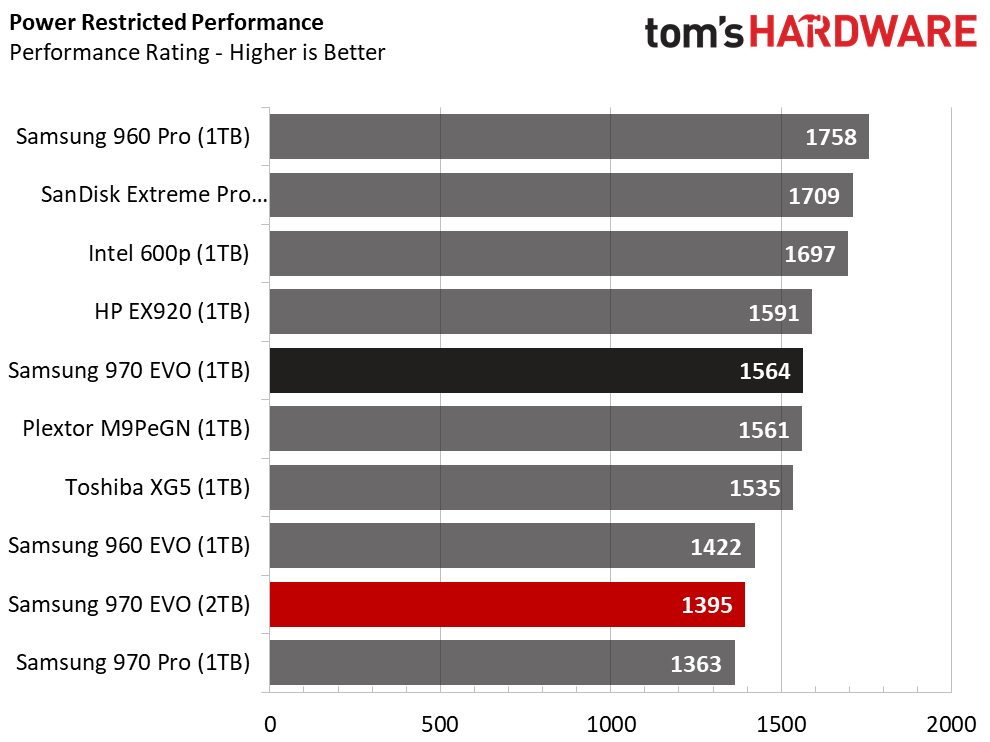
The Samsung custom NVMe driver doesn't do its SSDs any favors in our notebook battery life test. We've tested the Samsung driver against the Microsoft driver a number of times in the past. This time we tested with the superior Windows driver.
Our Lenovo Y700-17 gaming notebook ran for over 300 minutes on battery power with the 970 SSDs. This is very close to the scores we recorded with the 1TB 960 EVO and Pro SSDs. The results are all very good for NVMe, but the 970's are not the absolute best if you spend a lot of time away from a power outlet.
MORE: Best SSDs
MORE: How We Test HDDs And SSDs
MORE: All SSD Content
Current page: 2TB And 1TB Performance
Prev Page Features & Specifications Next Page 512GB Performance
Chris Ramseyer was a senior contributing editor for Tom's Hardware. He tested and reviewed consumer storage.
-
WINTERLORD id assume if you already have a 960 evo, then its not yet worth the upgrade meaning you wouldnt notice a difference in real world performance?Reply -
rinosaur So whats next? PCI x8? I just got a SM2262 drive and it outbenches my old SATA SSD 5 times over but I can't really tell even on boot up. I wish there was a Battlefield 1 benchmark since BF3 is pretty old and the maps will be tiny in comparison. At the same time I don't know what the bottleneck is when loading multiplayer maps. Even small games like HotS could not possibly be utilizing the old 500MB/s drive to the max since it takes like 15 seconds to get to 100% with low CPU/memory usage.Reply -
Co BIY In the Application Storage Bandwidth chart the Samsung 970 EVO is mislabeled as a Plextor product.Reply -
modeonoff I cannot find it in major online stores in North America yet. Don't know about availability. When it becomes available, will the current SSD prices drop?Reply -
ATI9800Pro Where can I get that Plextor 970 EVO 2TB in the Application Storage Bandwidth chart ? :DReply -
mccainm Similar question to ERN88. I currently have a 850 EVO (M.2) in a desktop (i7-7700k w/ 16GB RAM) and I don't notice any real world difference from a Dell XPS 13 w/ older NVMe drive. Benchmarks, obviously, show the NVMe considerable faster. Is it still only worth upgrading from SATA to NVMe (SSD of course) with specific workloads?Reply -
Darkbreeze I wouldn't exactly call the MX500's read/write speeds of 560/510 MB/s and 95/90k IOPS "catching up". It surprised me when I read that so I went to double check. The MX500 is not even as fast as the 960 EVO (Actually, it's less than half as fast) much less the 970, and it's more expensive, at 121.99 being the least expensive I could find one for, although the double storage space is nice, users looking for fast drives are more worried about performance than they are about doubling the capacity of a much slower drive.Reply
Unless you can show conclusive performance versus pricing, with links, I'm afraid I can't agree with the validity of some of the information shown here.
