Why you can trust Tom's Hardware
Comparison Products
The Seagate FireCuda 540 has its work cut out for it as it’s facing the fastest drives we’ve tested. The top PCIe 4.0 SSDs include the Sabrent Rocket 4 Plus-G, the WD Black SN850X, the Solidigm P44 Pro, and the Samsung 990 Pro. PCIe 5.0 drives similar to the FireCuda 540 include the Inland TD510, the Gigabyte Aorus 10000, and the Corsair MP700. We also have the fastest drive on record, the Crucial T700, in play. Lastly, included for posterity is the 540’s predecessor, the FireCuda 530.
Trace Testing - 3DMark Storage Benchmark
Built for gamers, 3DMark’s Storage Benchmark focuses on real-world gaming performance. Each round in this benchmark stresses storage based on gaming activities including loading games, saving progress, installing game files, and recording gameplay video streams.
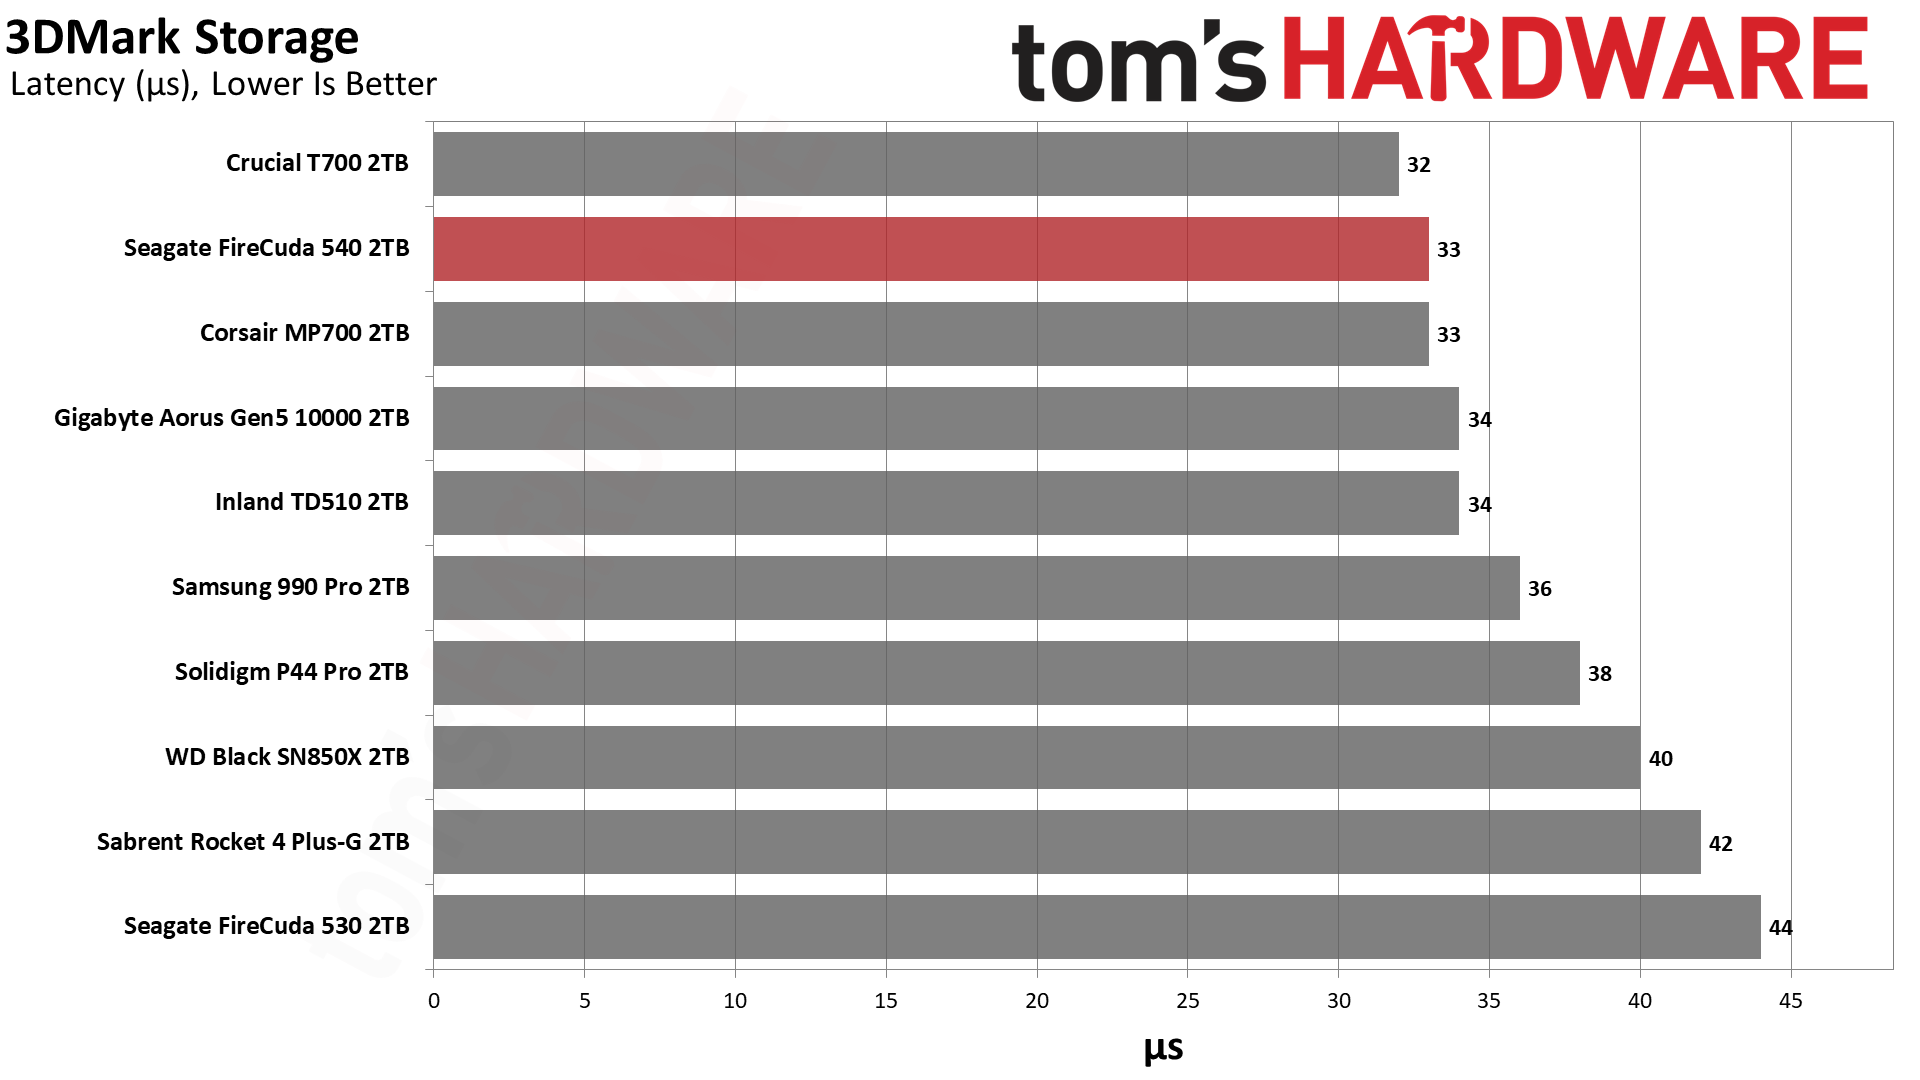
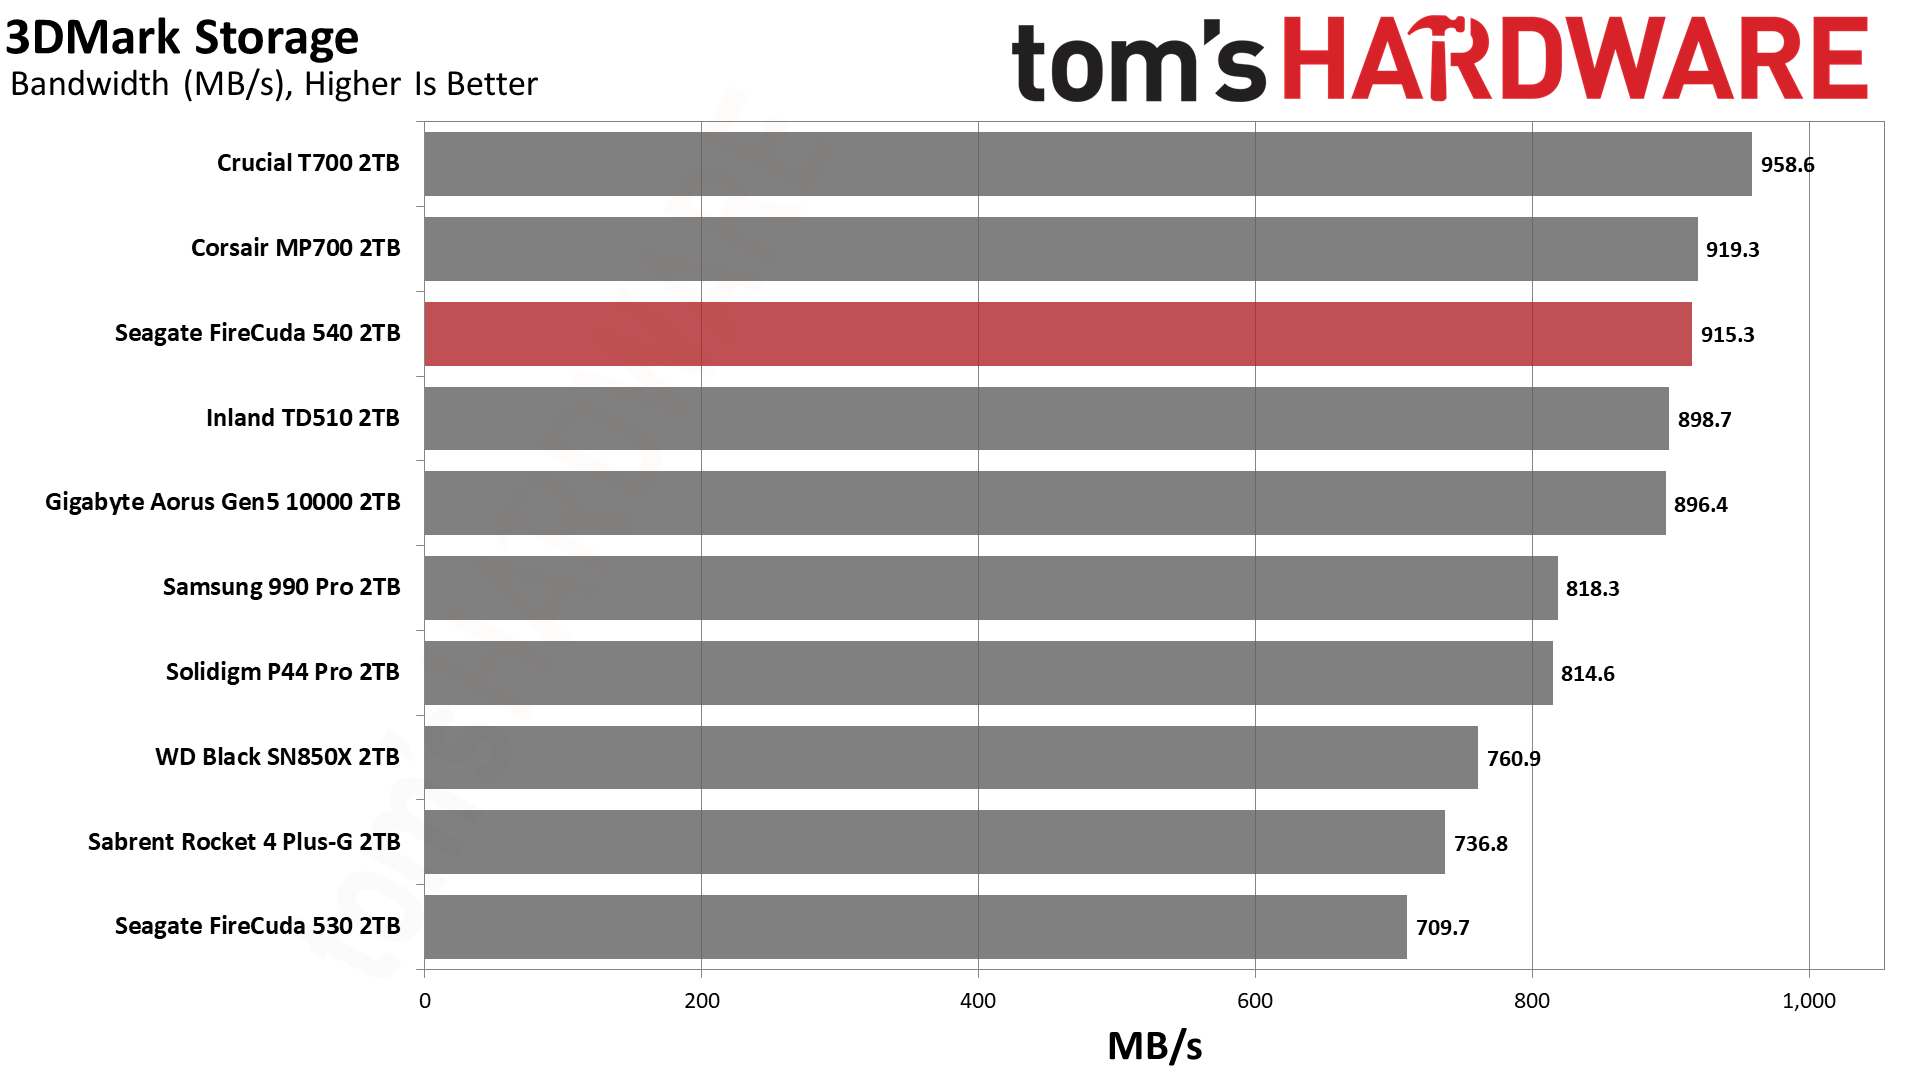
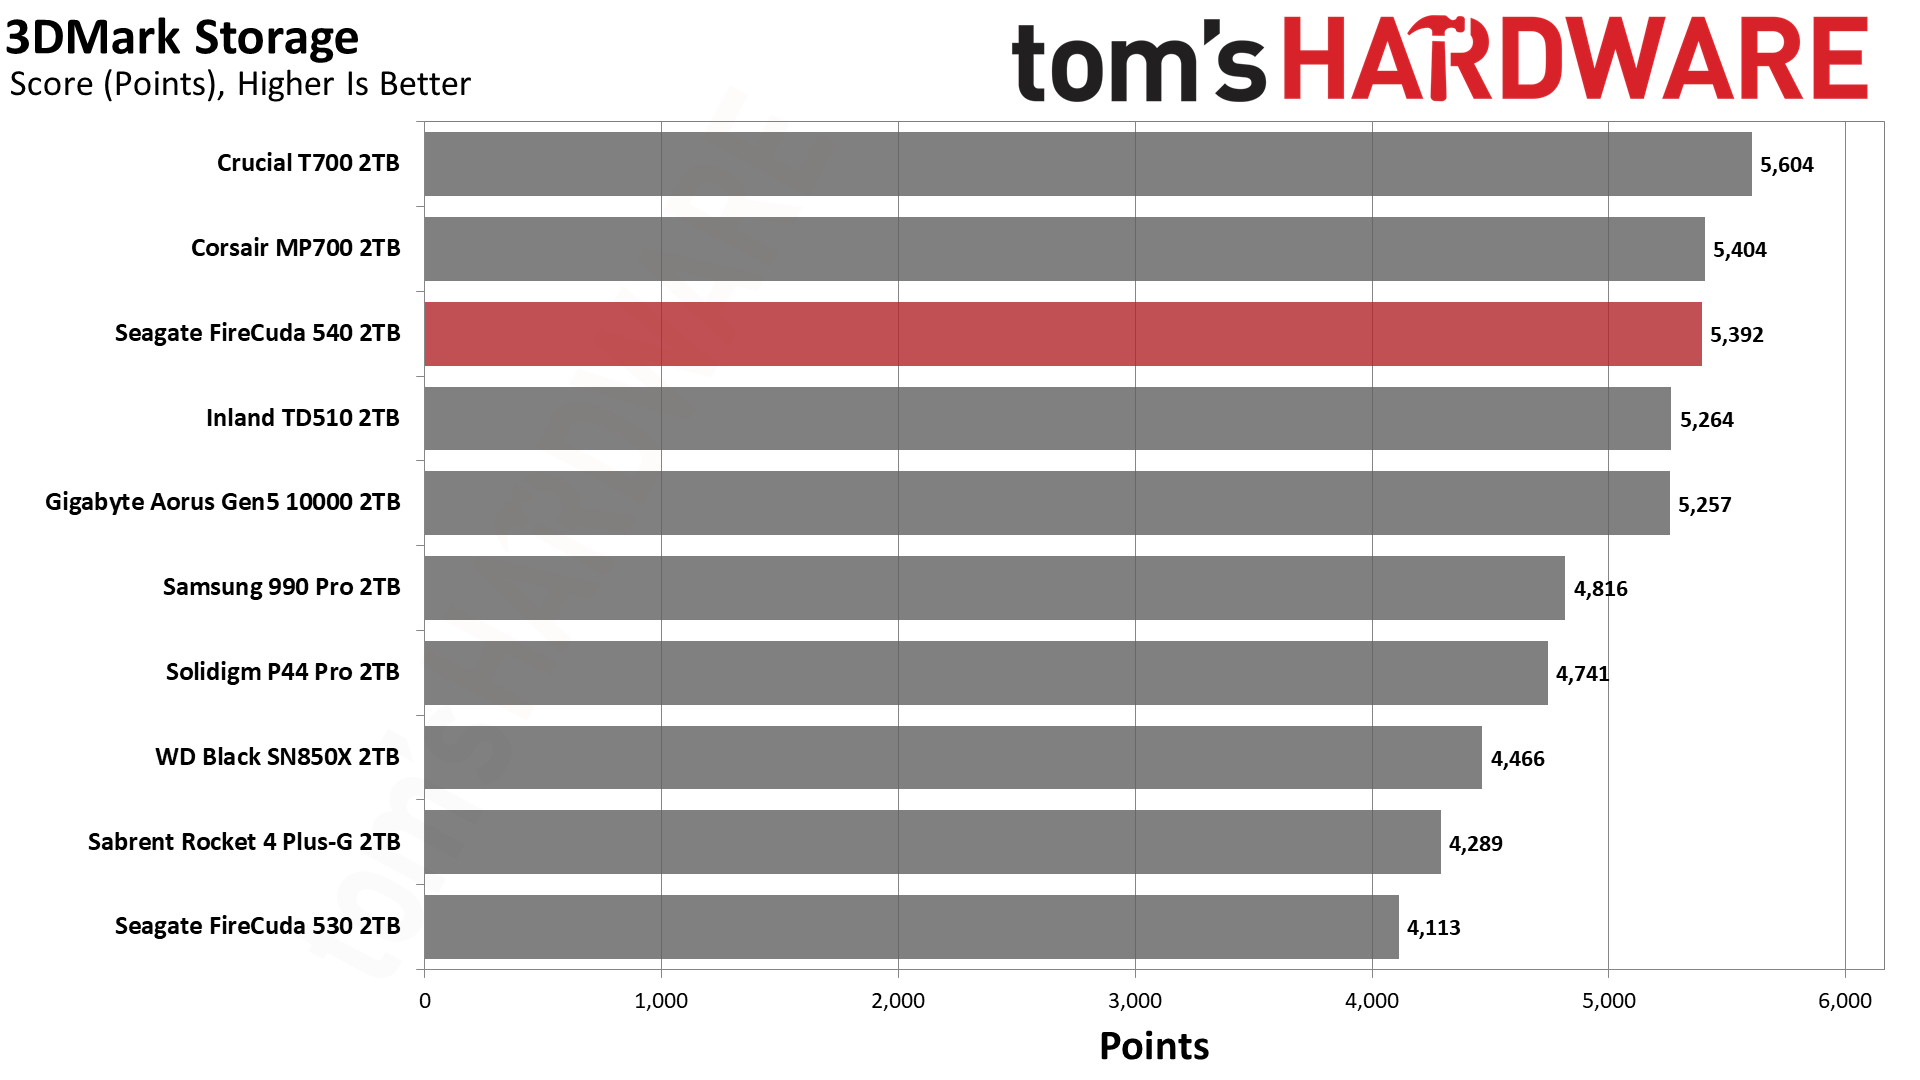
The FireCuda 540 does very well in 3DMark, matching the MP700 and trailing only the T700. Seagate informed me that it tests 3DMark and gaming in other ways, including a “real world” test and another designed for maximum stress. This latter approach is useful in estimating DirectStorage performance which requires sustained random reads, a workload that was not previously a requirement for gaming. We’re not quite there yet, but it is on the horizon.
Trace Testing – PCMark 10 Storage Benchmark
PCMark 10 is a trace-based benchmark that uses a wide-ranging set of real-world traces from popular applications and everyday tasks to measure the performance of storage devices.
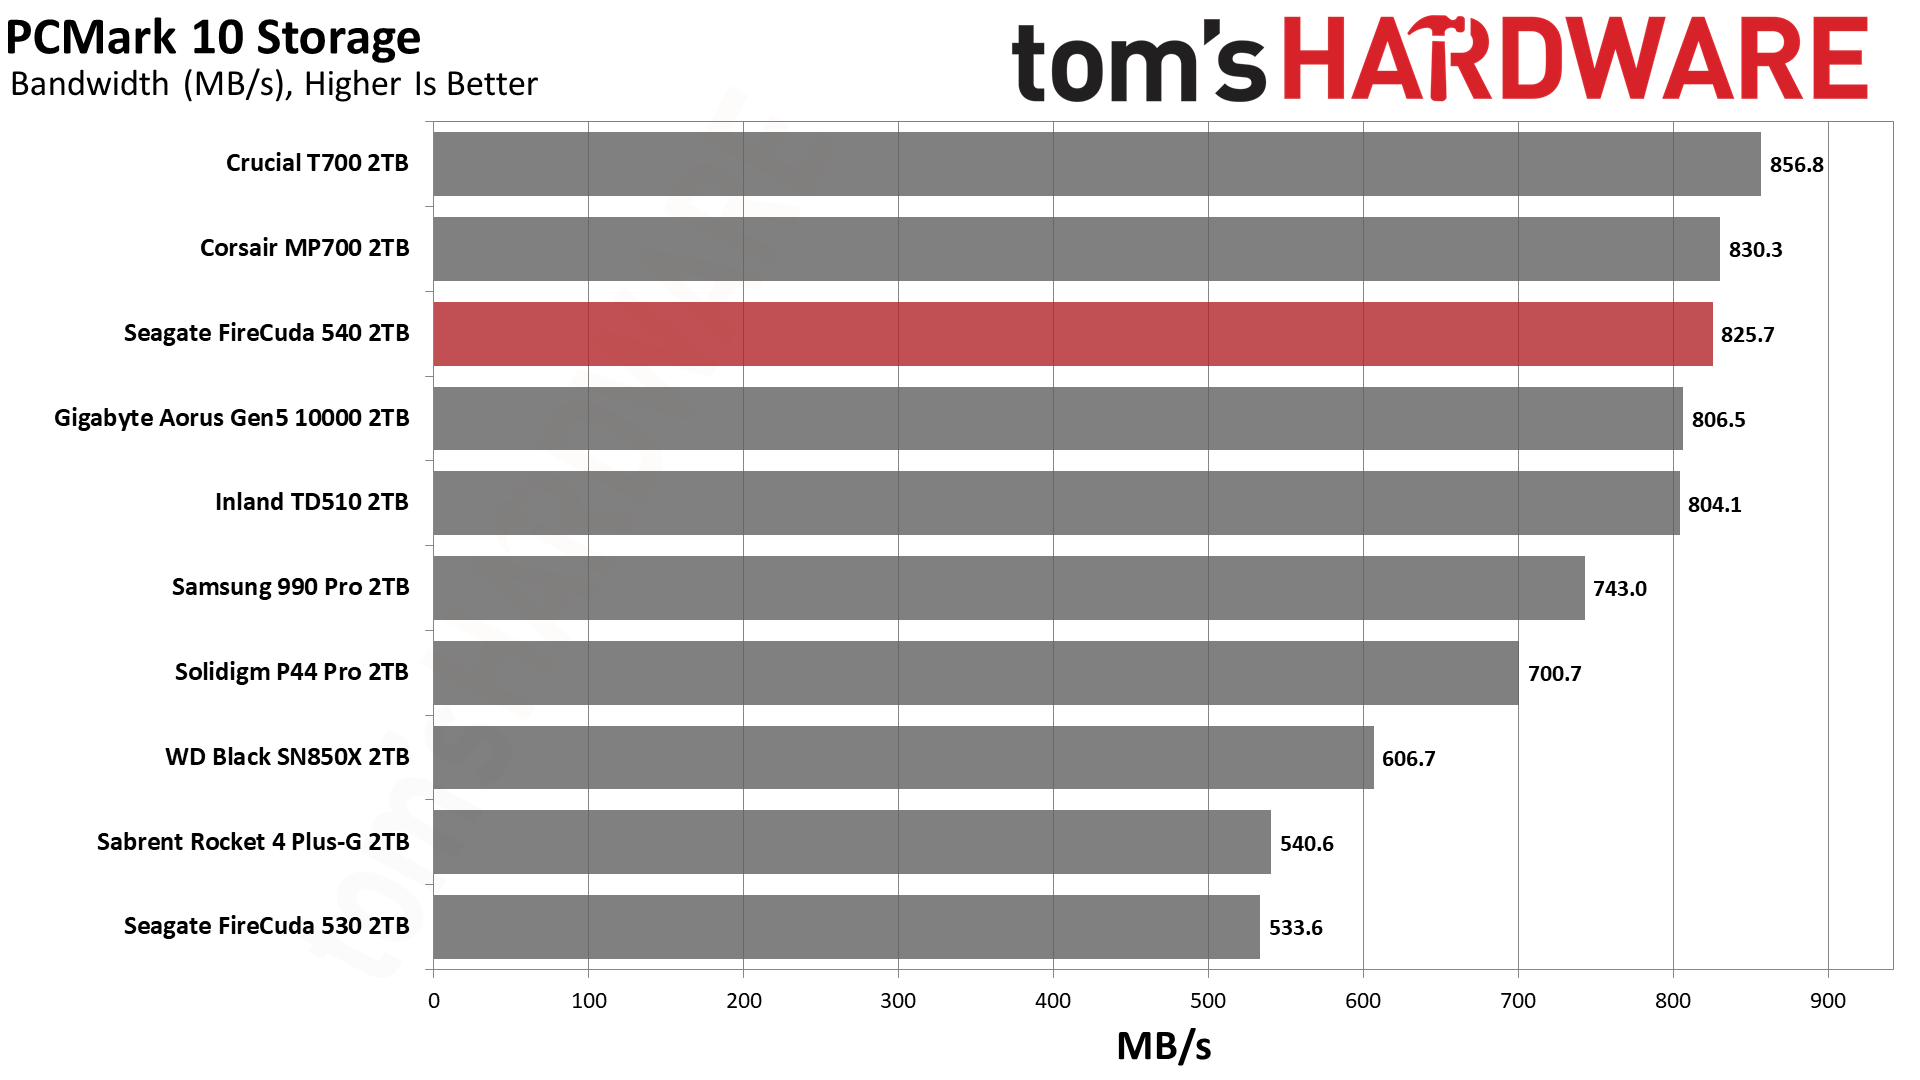
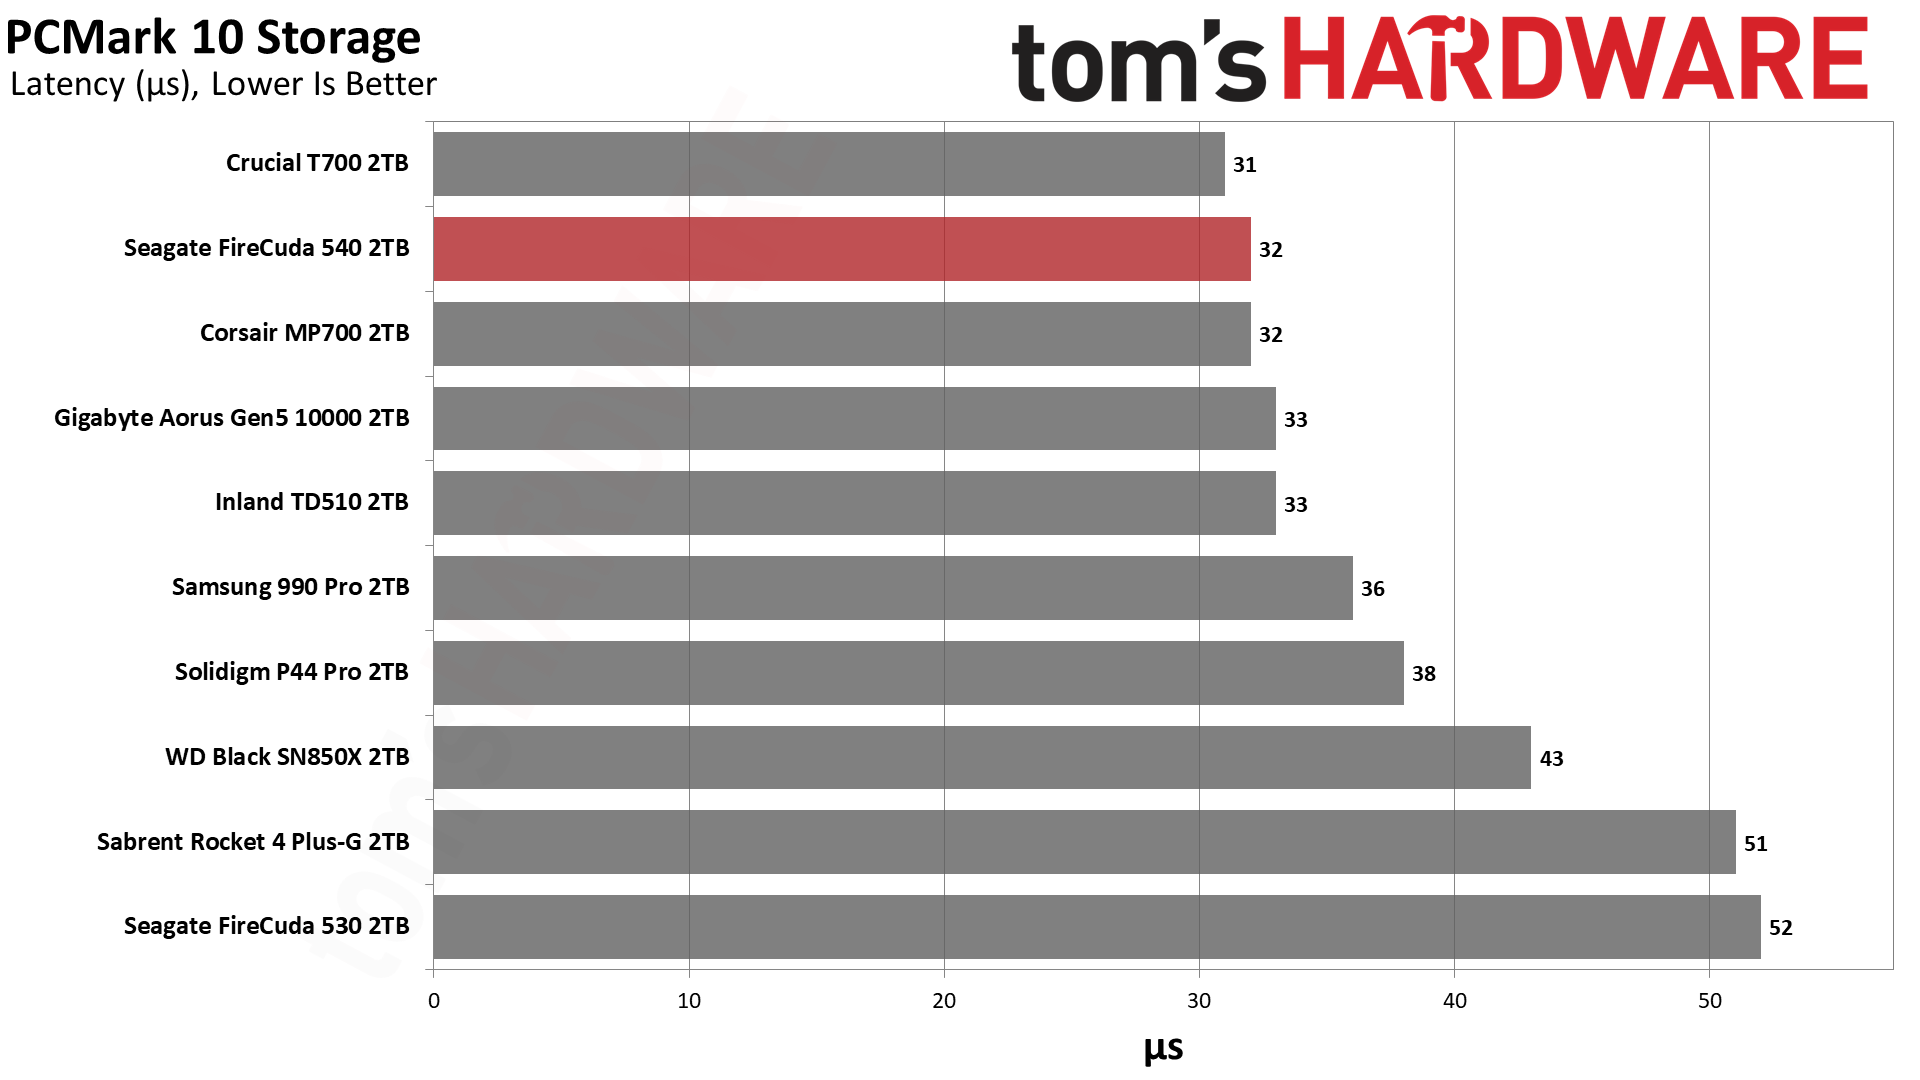
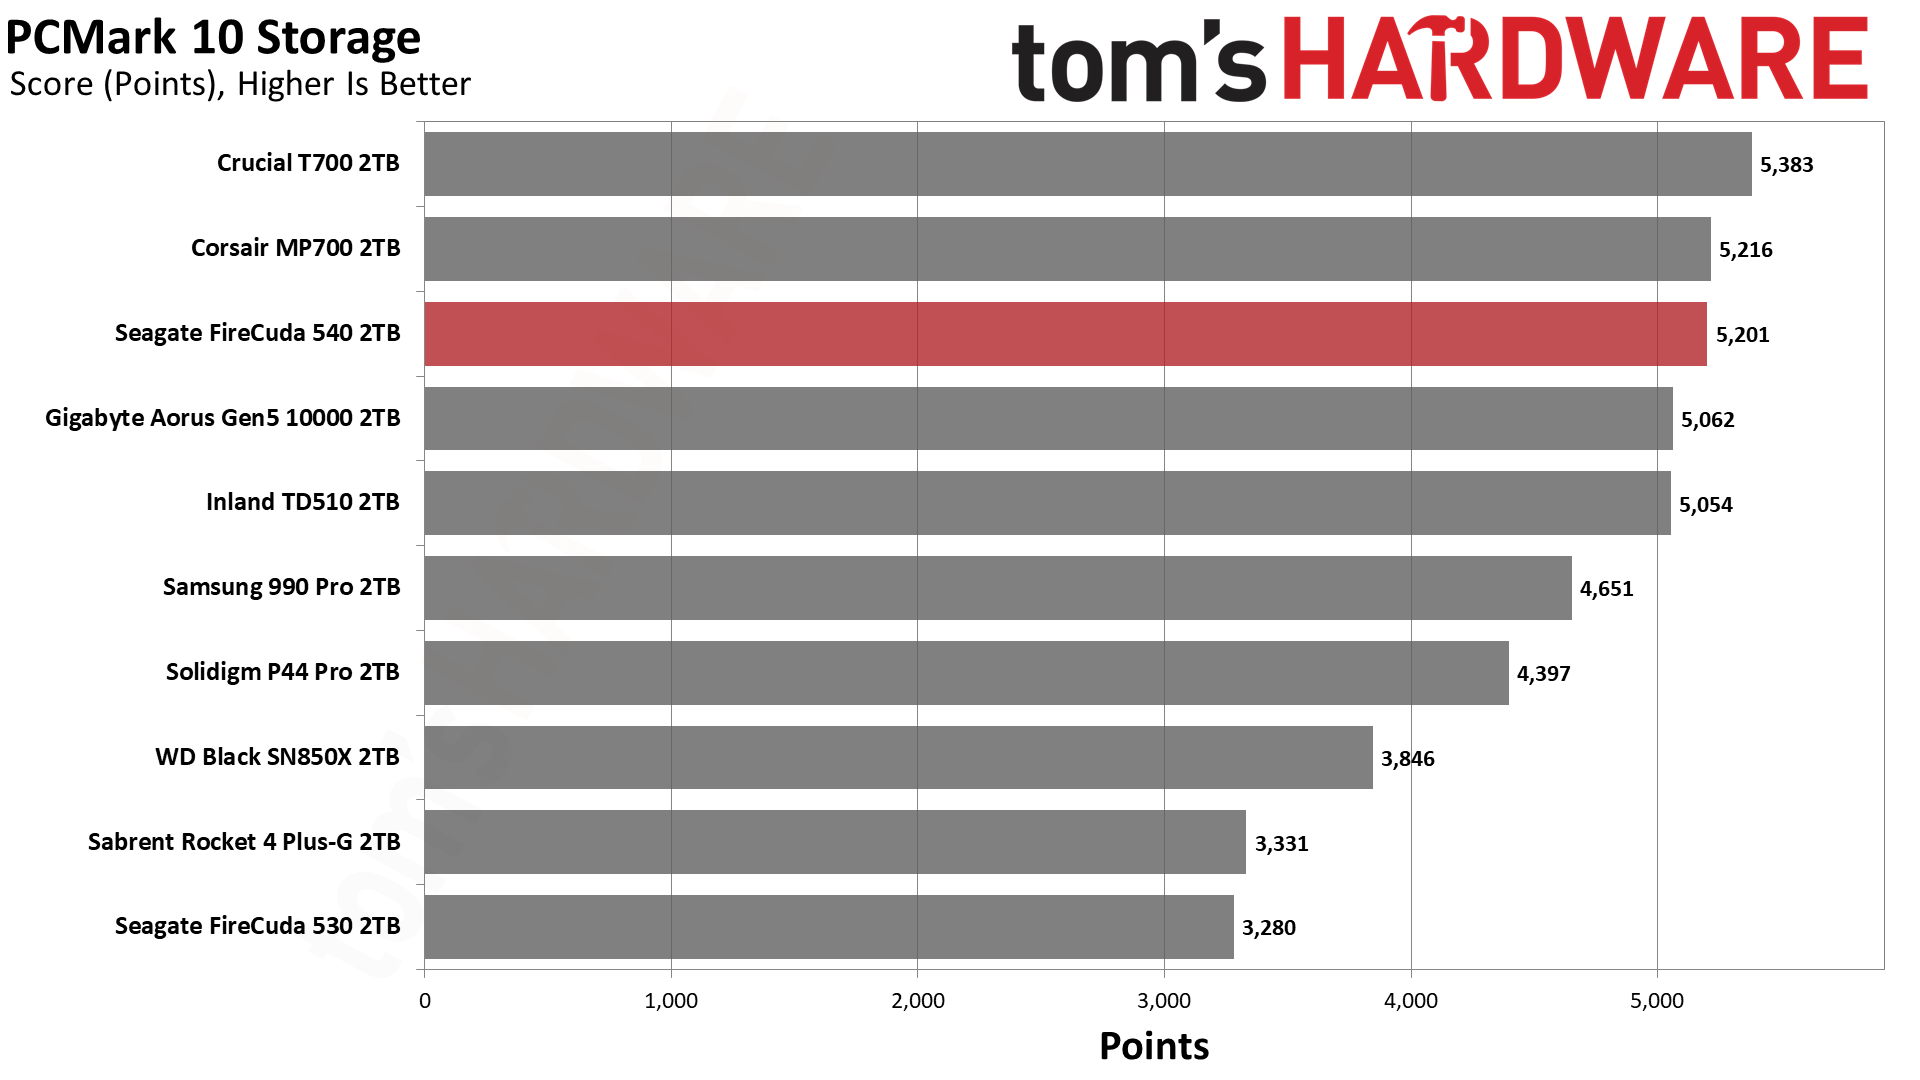
PCMark 10 results usually follow the trend we see in 3DMark, and that is the case here. The FireCuda 540 is again near the top of our charts in all bandwidth and latency metrics, yielding a solid third-place overall score.
Transfer Rates – DiskBench
We use the DiskBench storage benchmarking tool to test file transfer performance with a custom, 50GB dataset. We copy 31,227 files of various types, such as pictures, PDFs, and videos to a new folder and then follow-up with a reading test of a newly-written 6.5GB zip file.
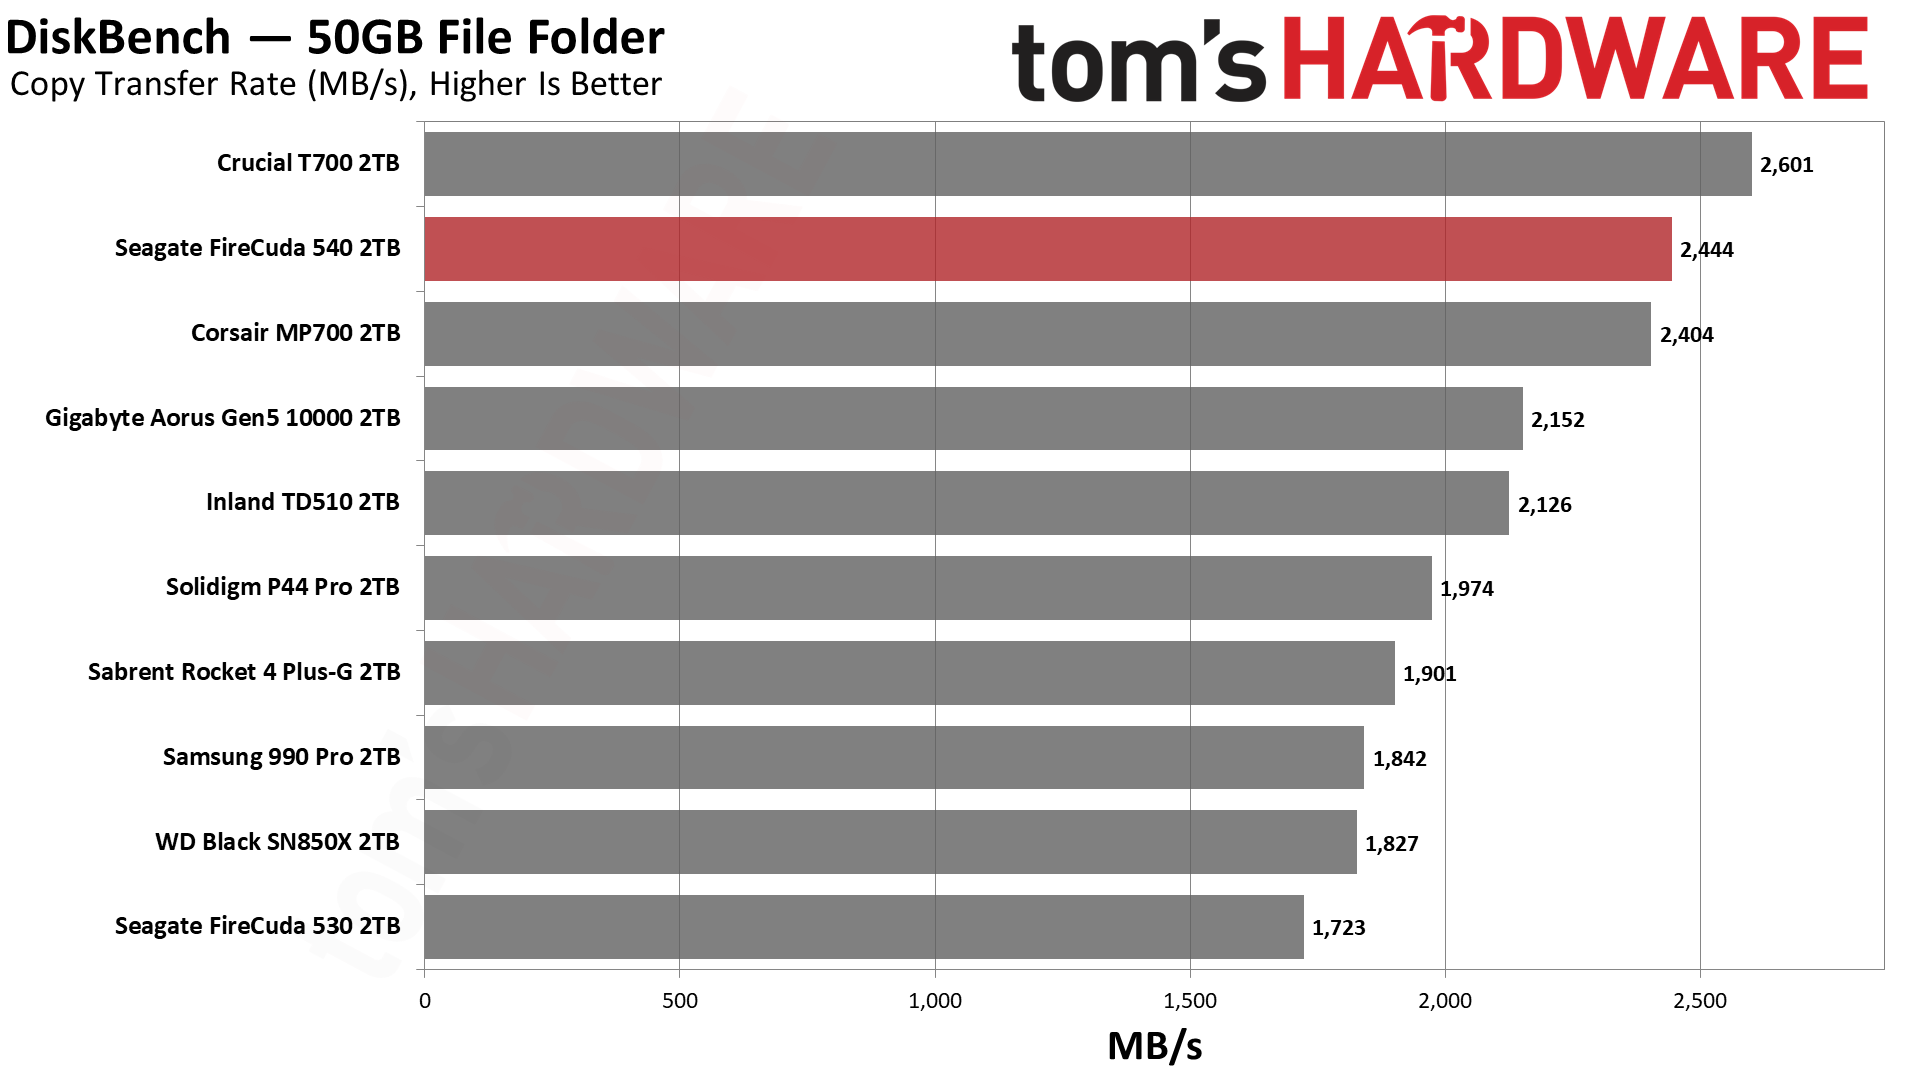
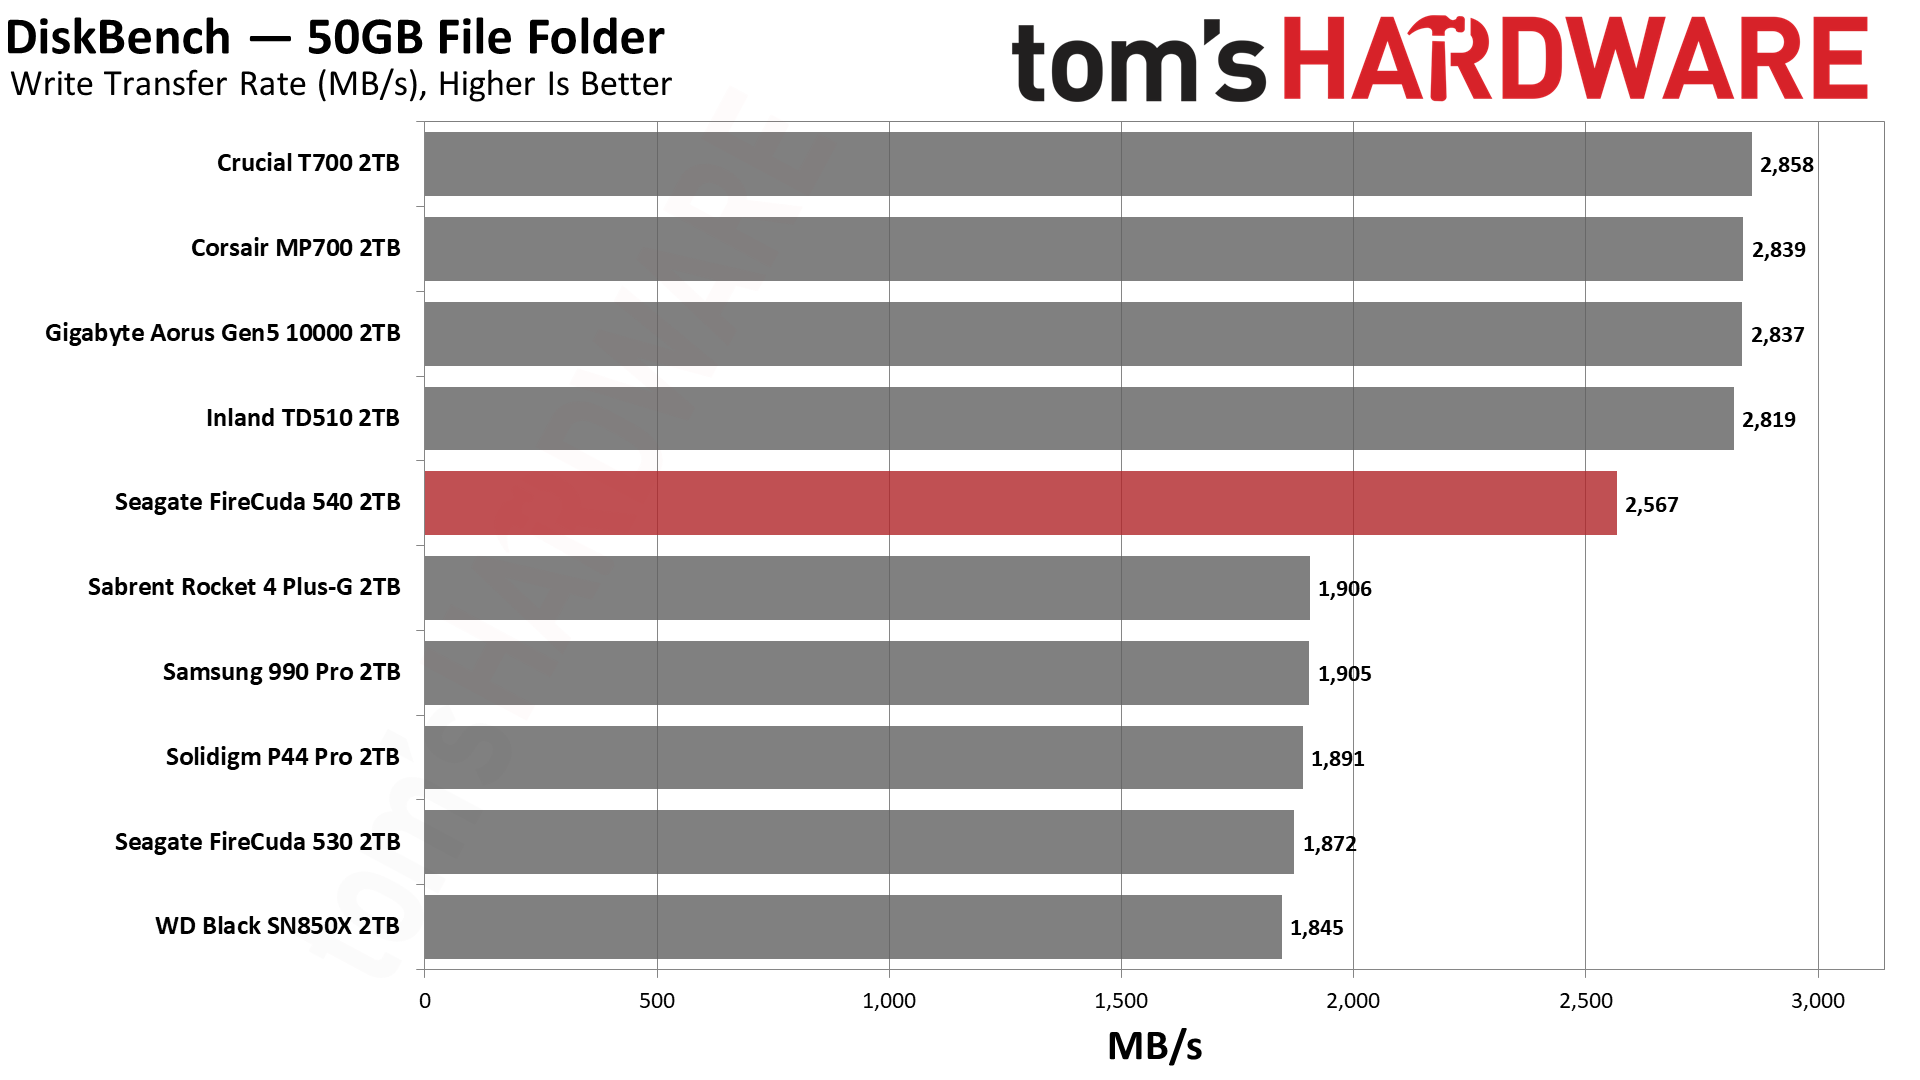
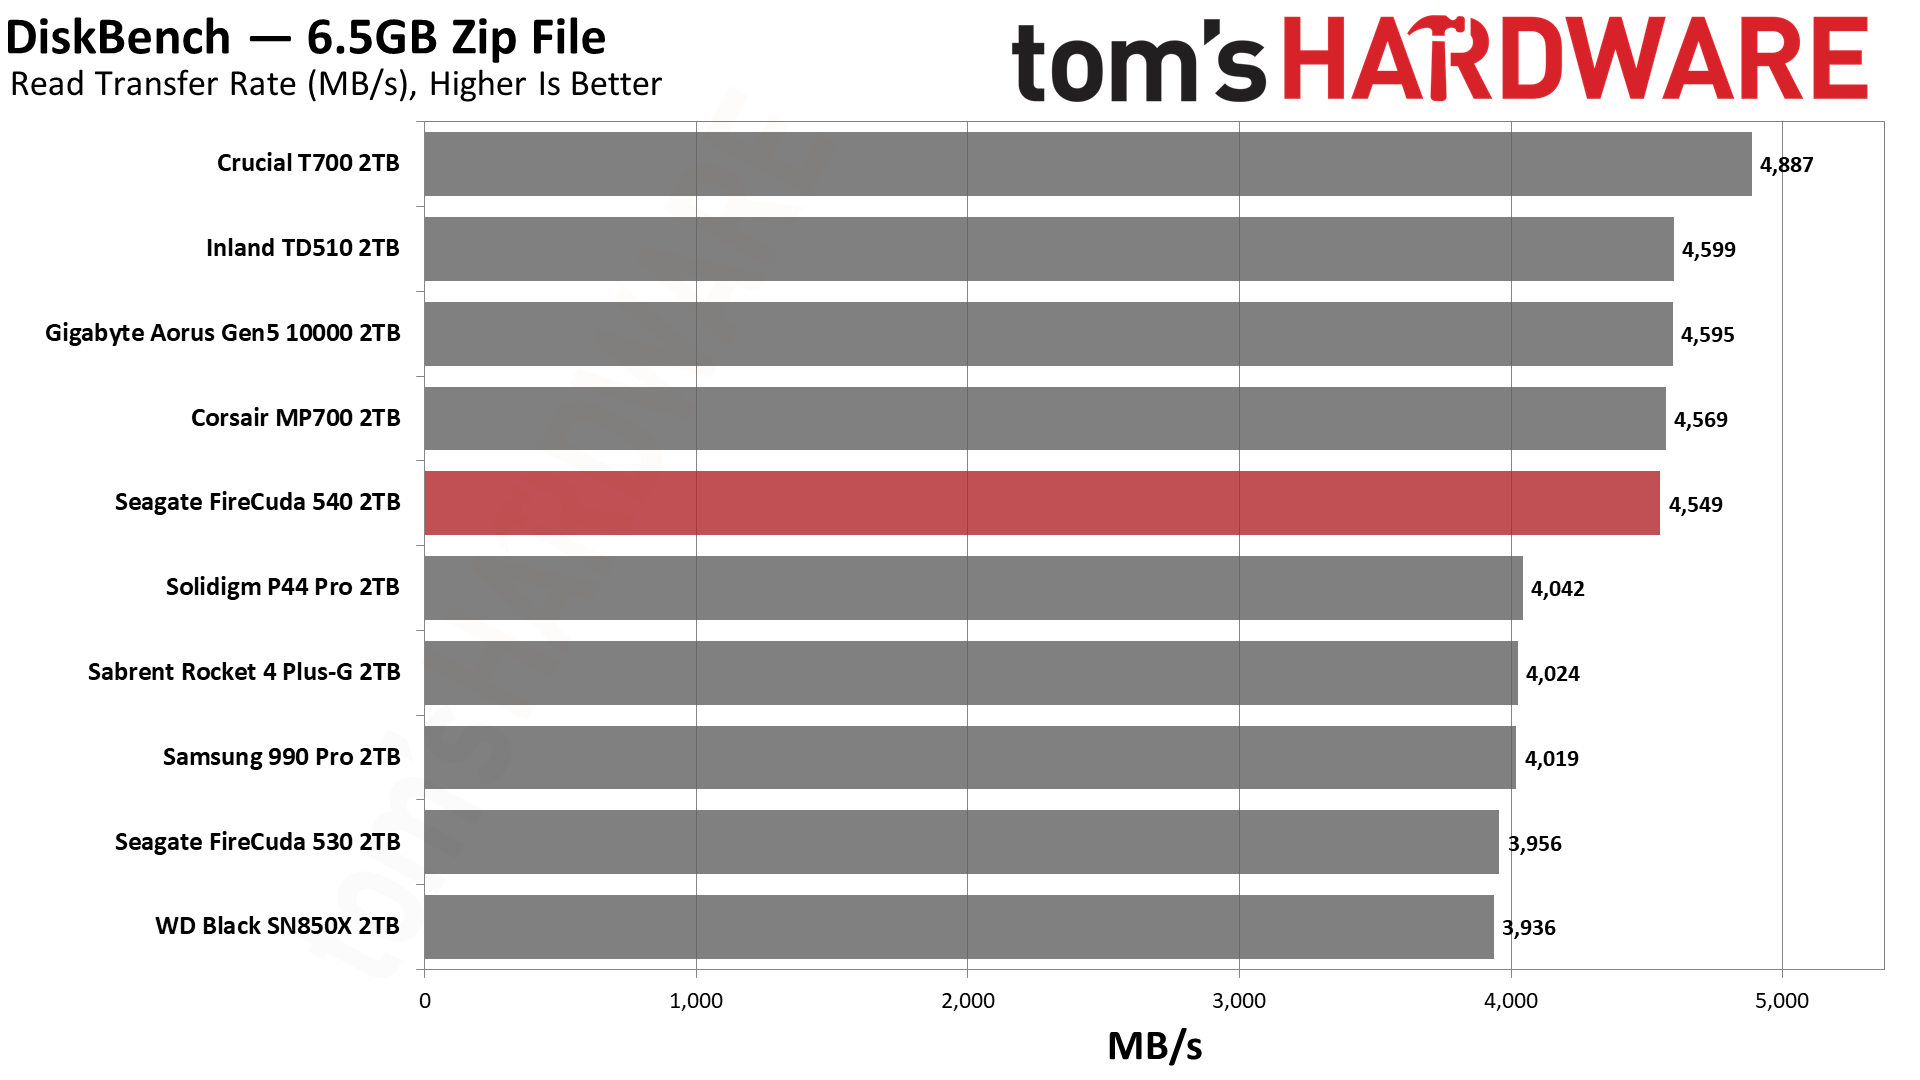
The FireCuda 540 copies quickly, which can matter if you really want the fastest transfers. If you are buying a drive like this, you probably do. The T700 is faster still, but even the FireCuda 540 is significantly faster than the last-generation 530.
Get Tom's Hardware's best news and in-depth reviews, straight to your inbox.
Synthetic Testing - ATTO / CrystalDiskMark
ATTO and CrystalDiskMark (CDM) are free and easy-to-use storage benchmarking tools that storage vendors commonly use to assign performance specifications to their products. Both of these tools give us insight into how each device handles different file sizes.
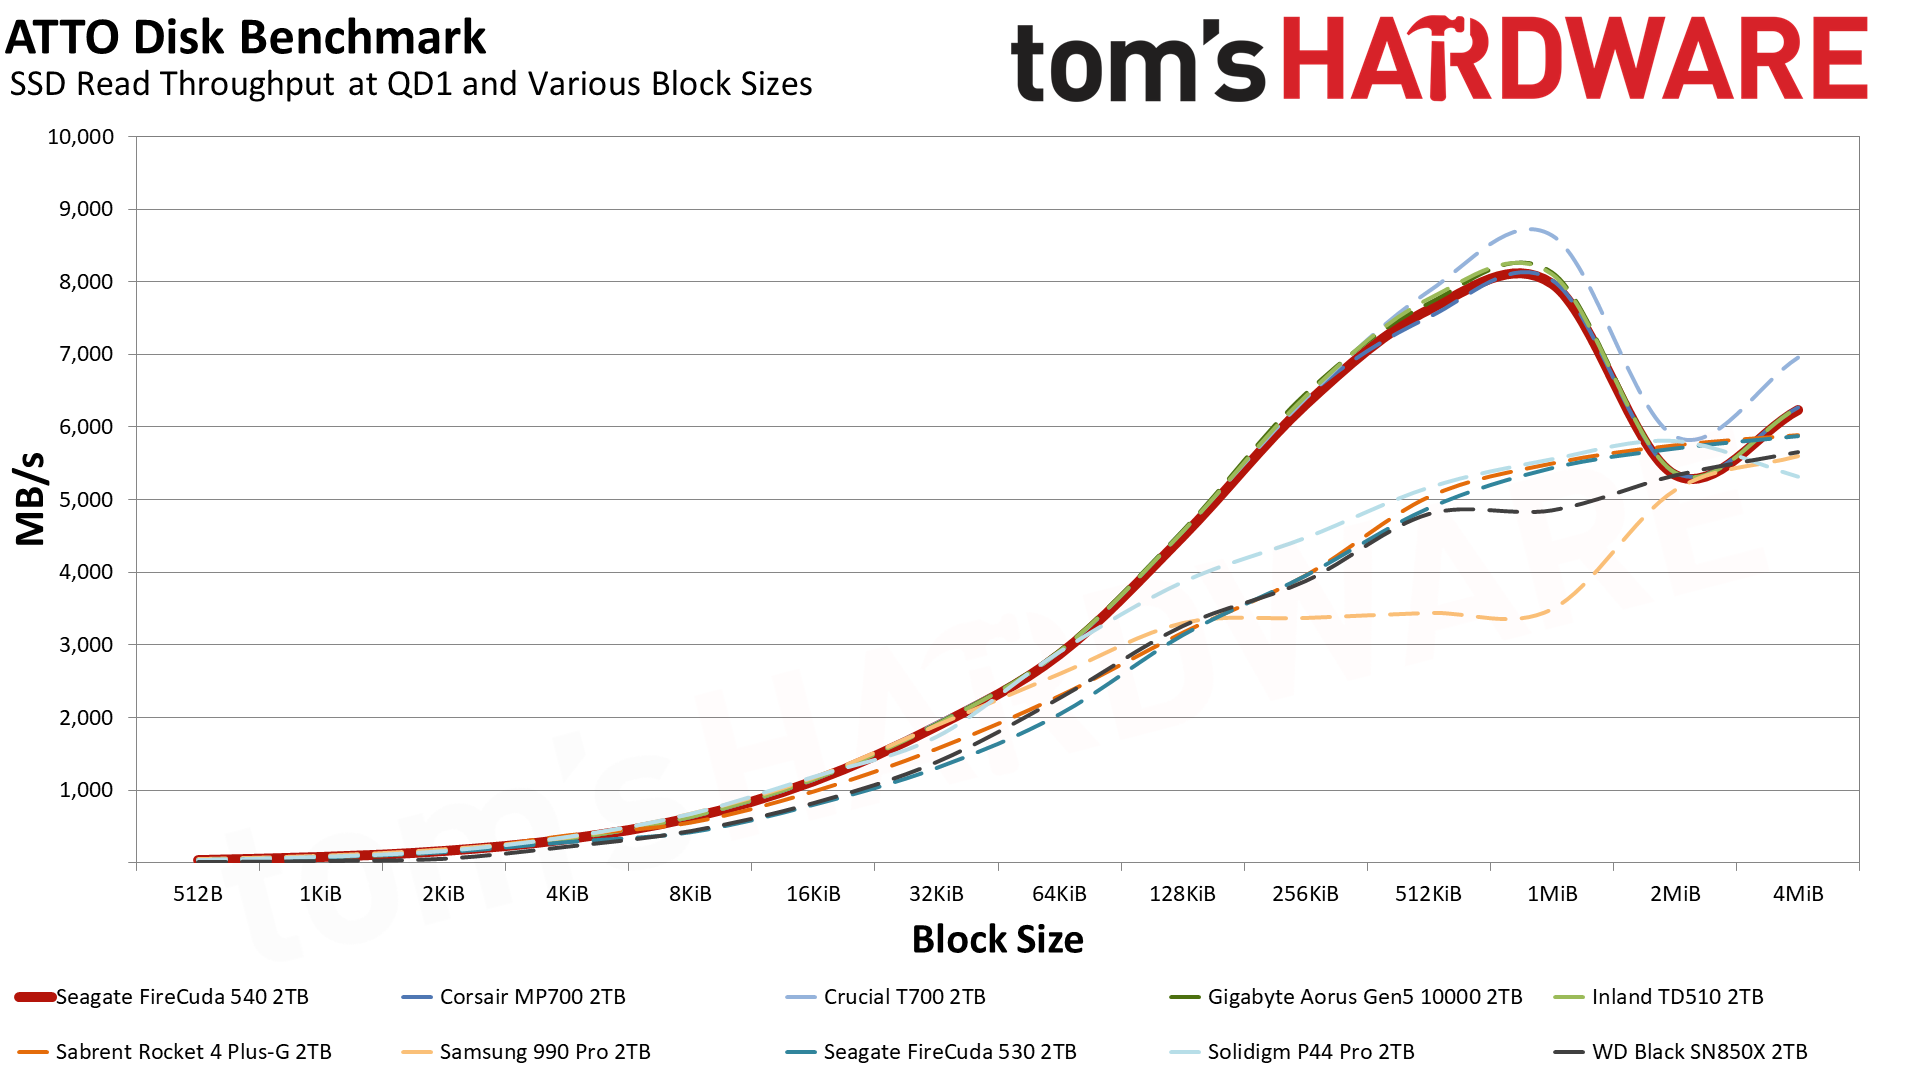
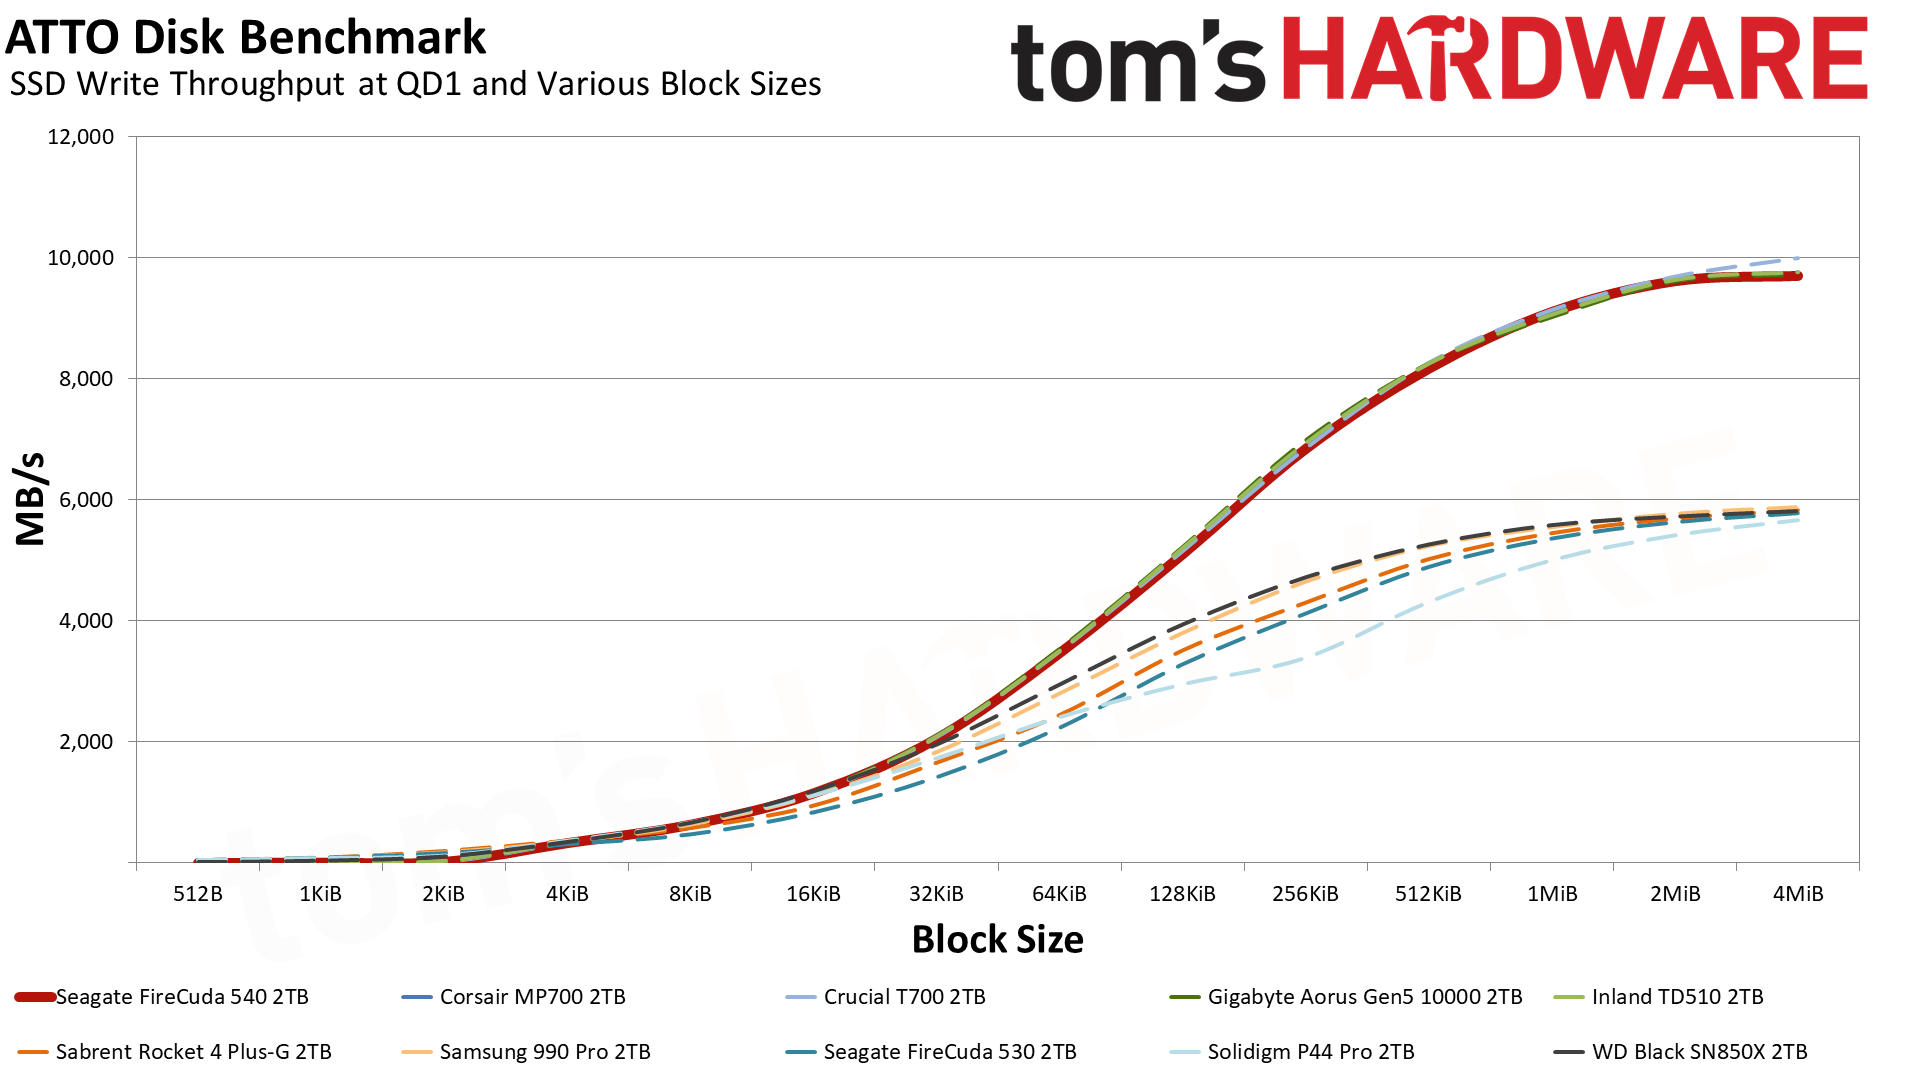
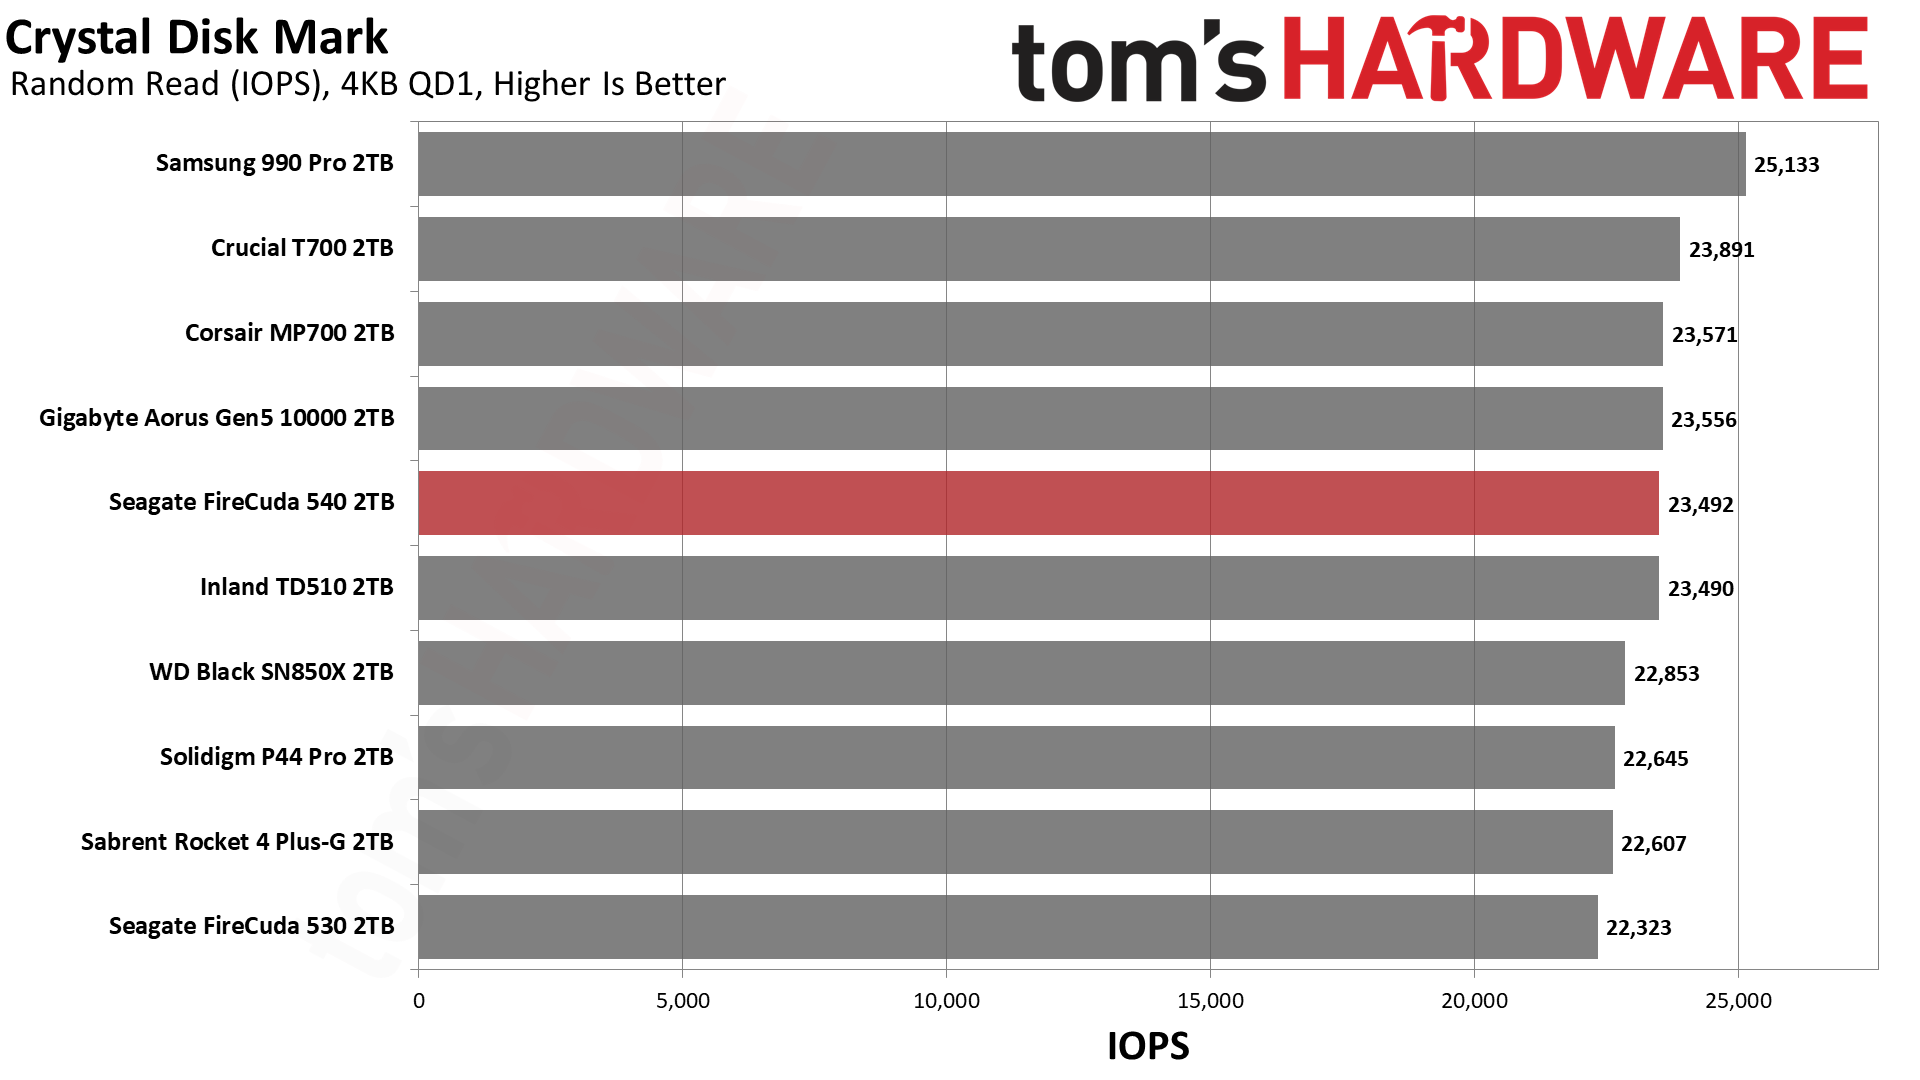
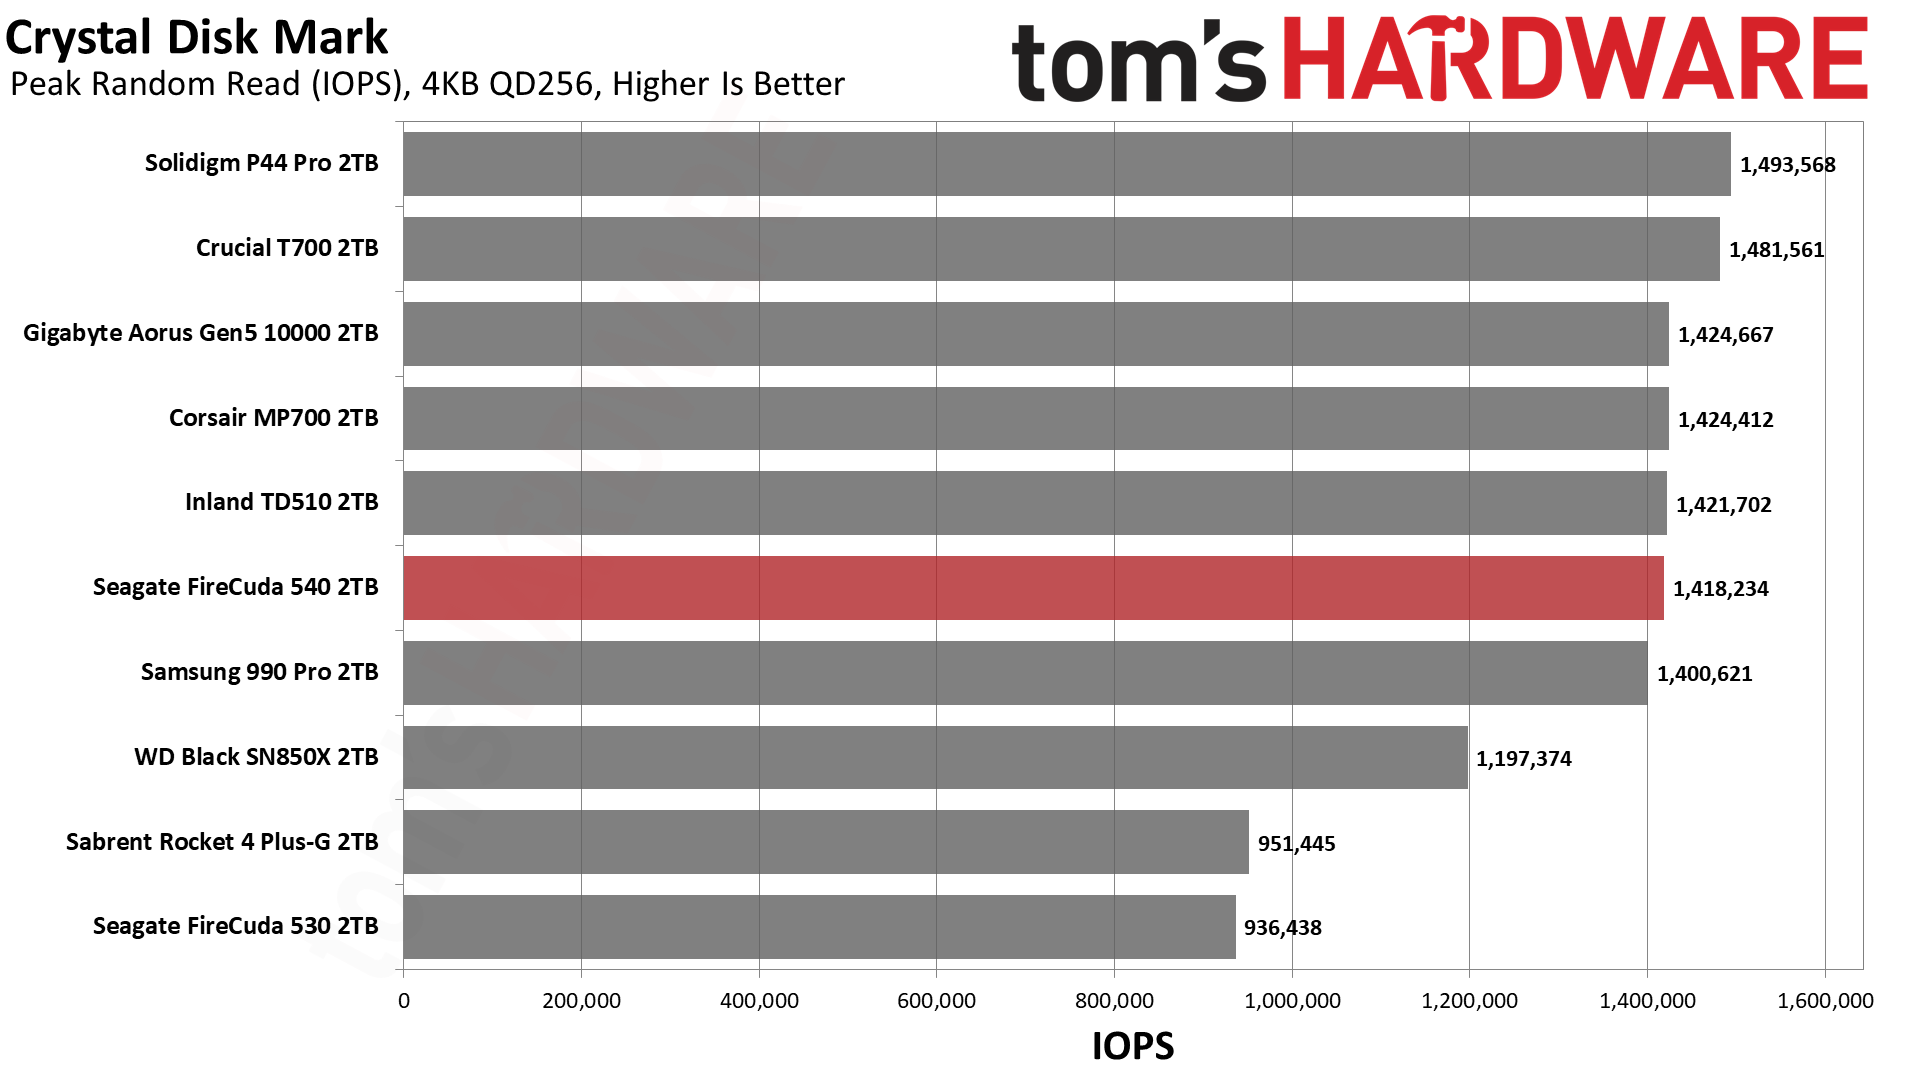
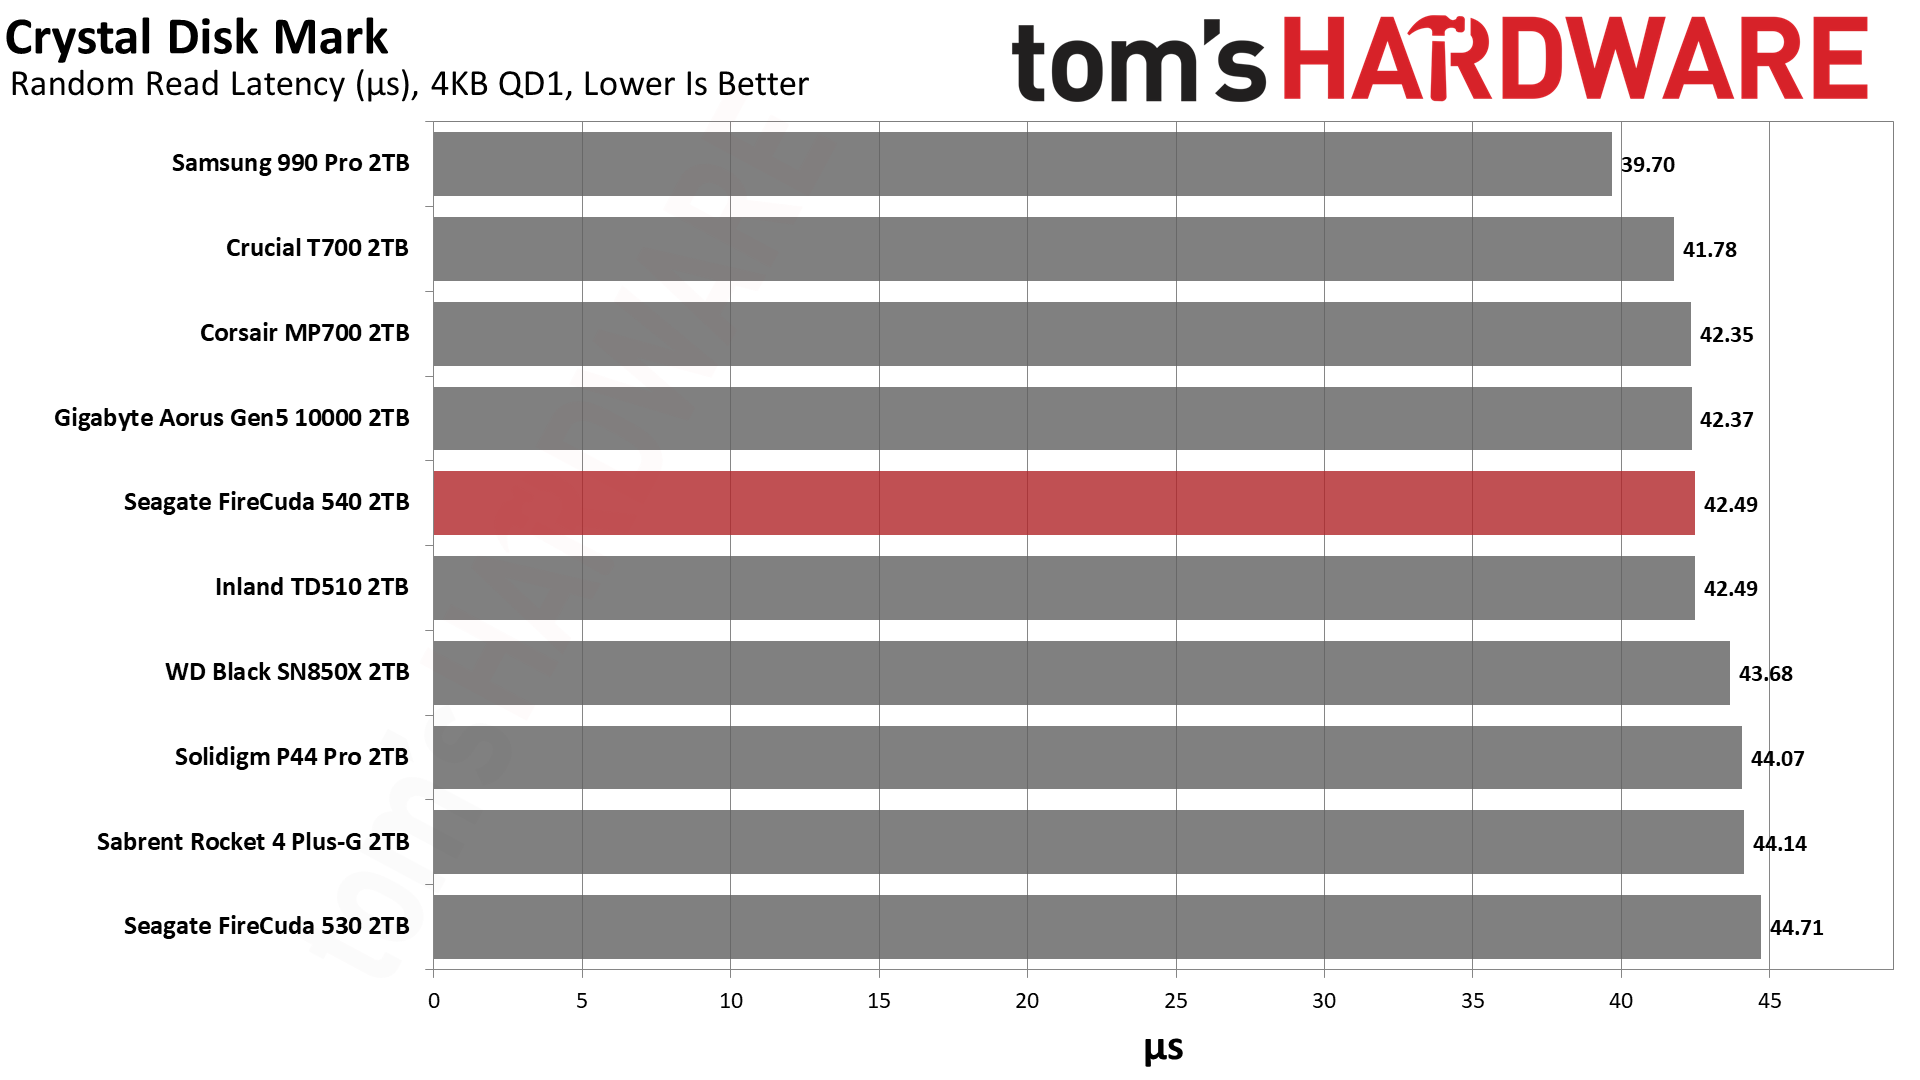
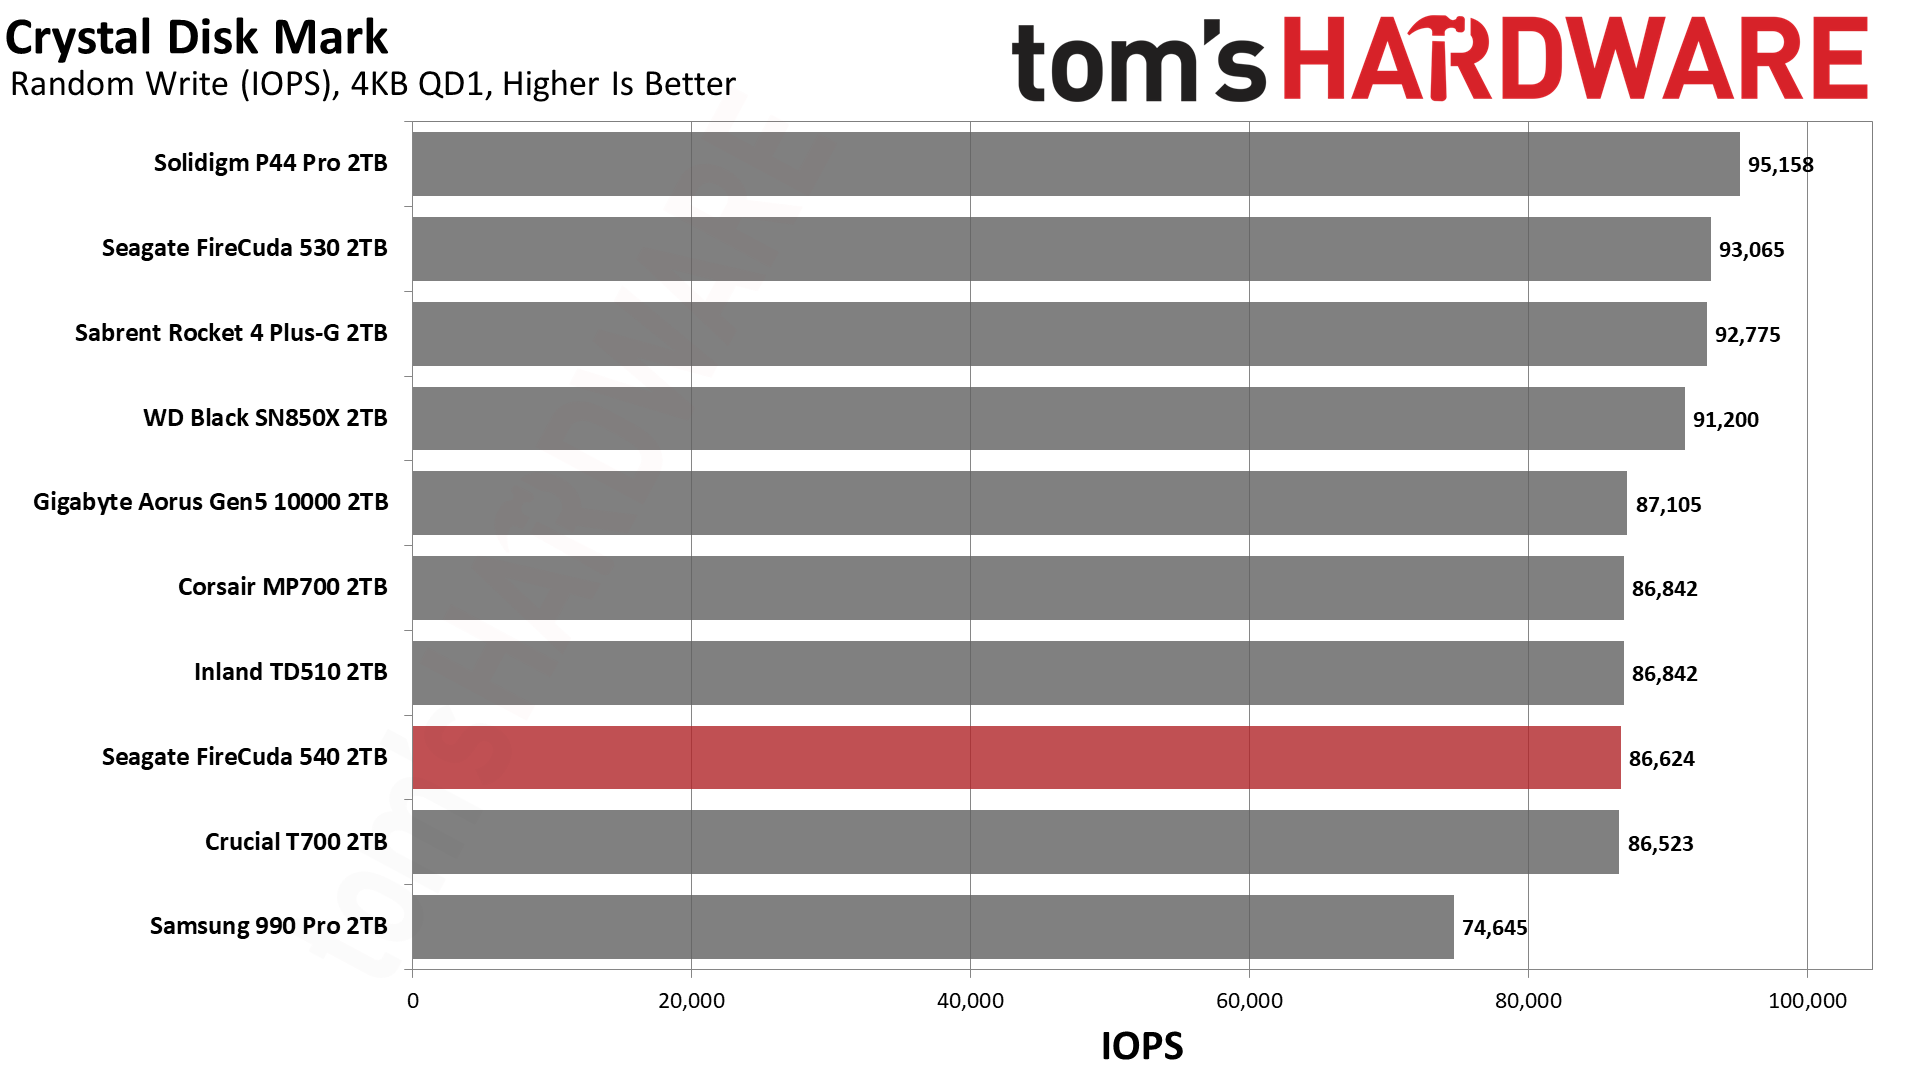
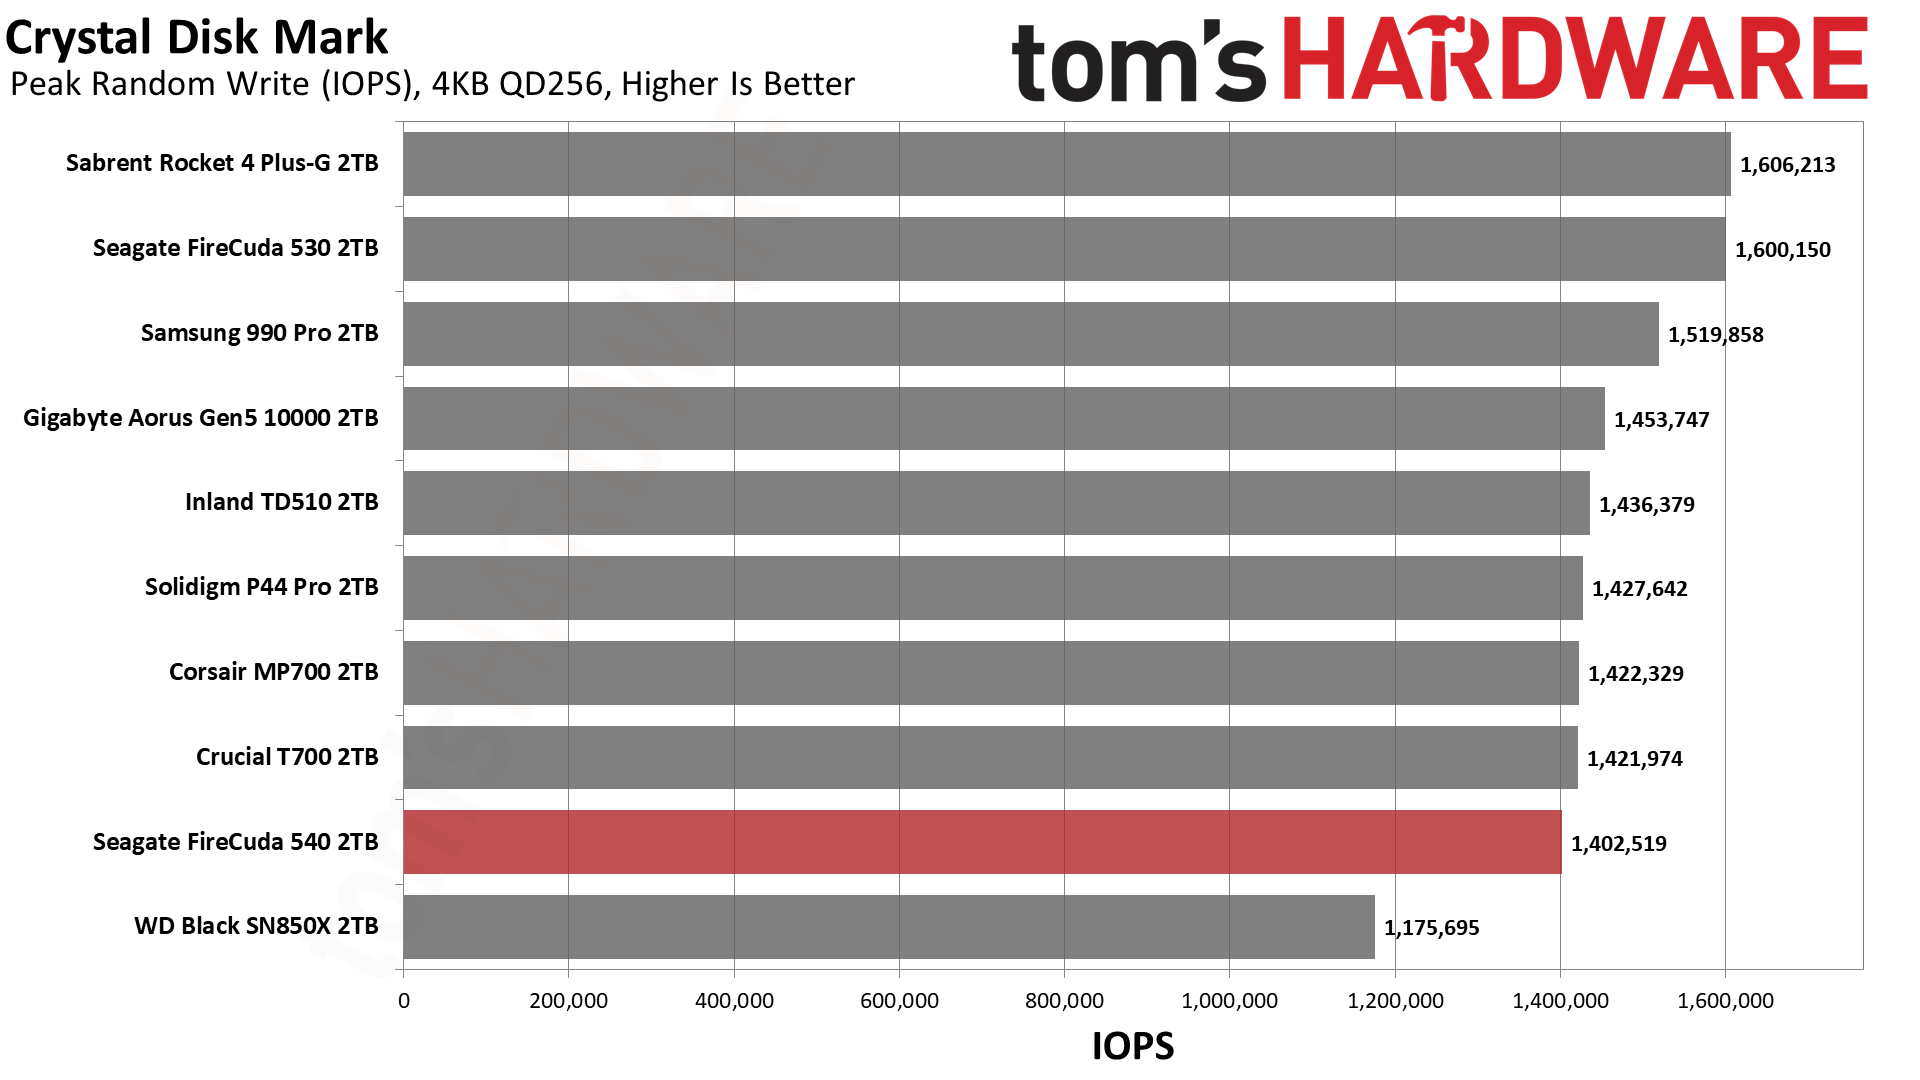
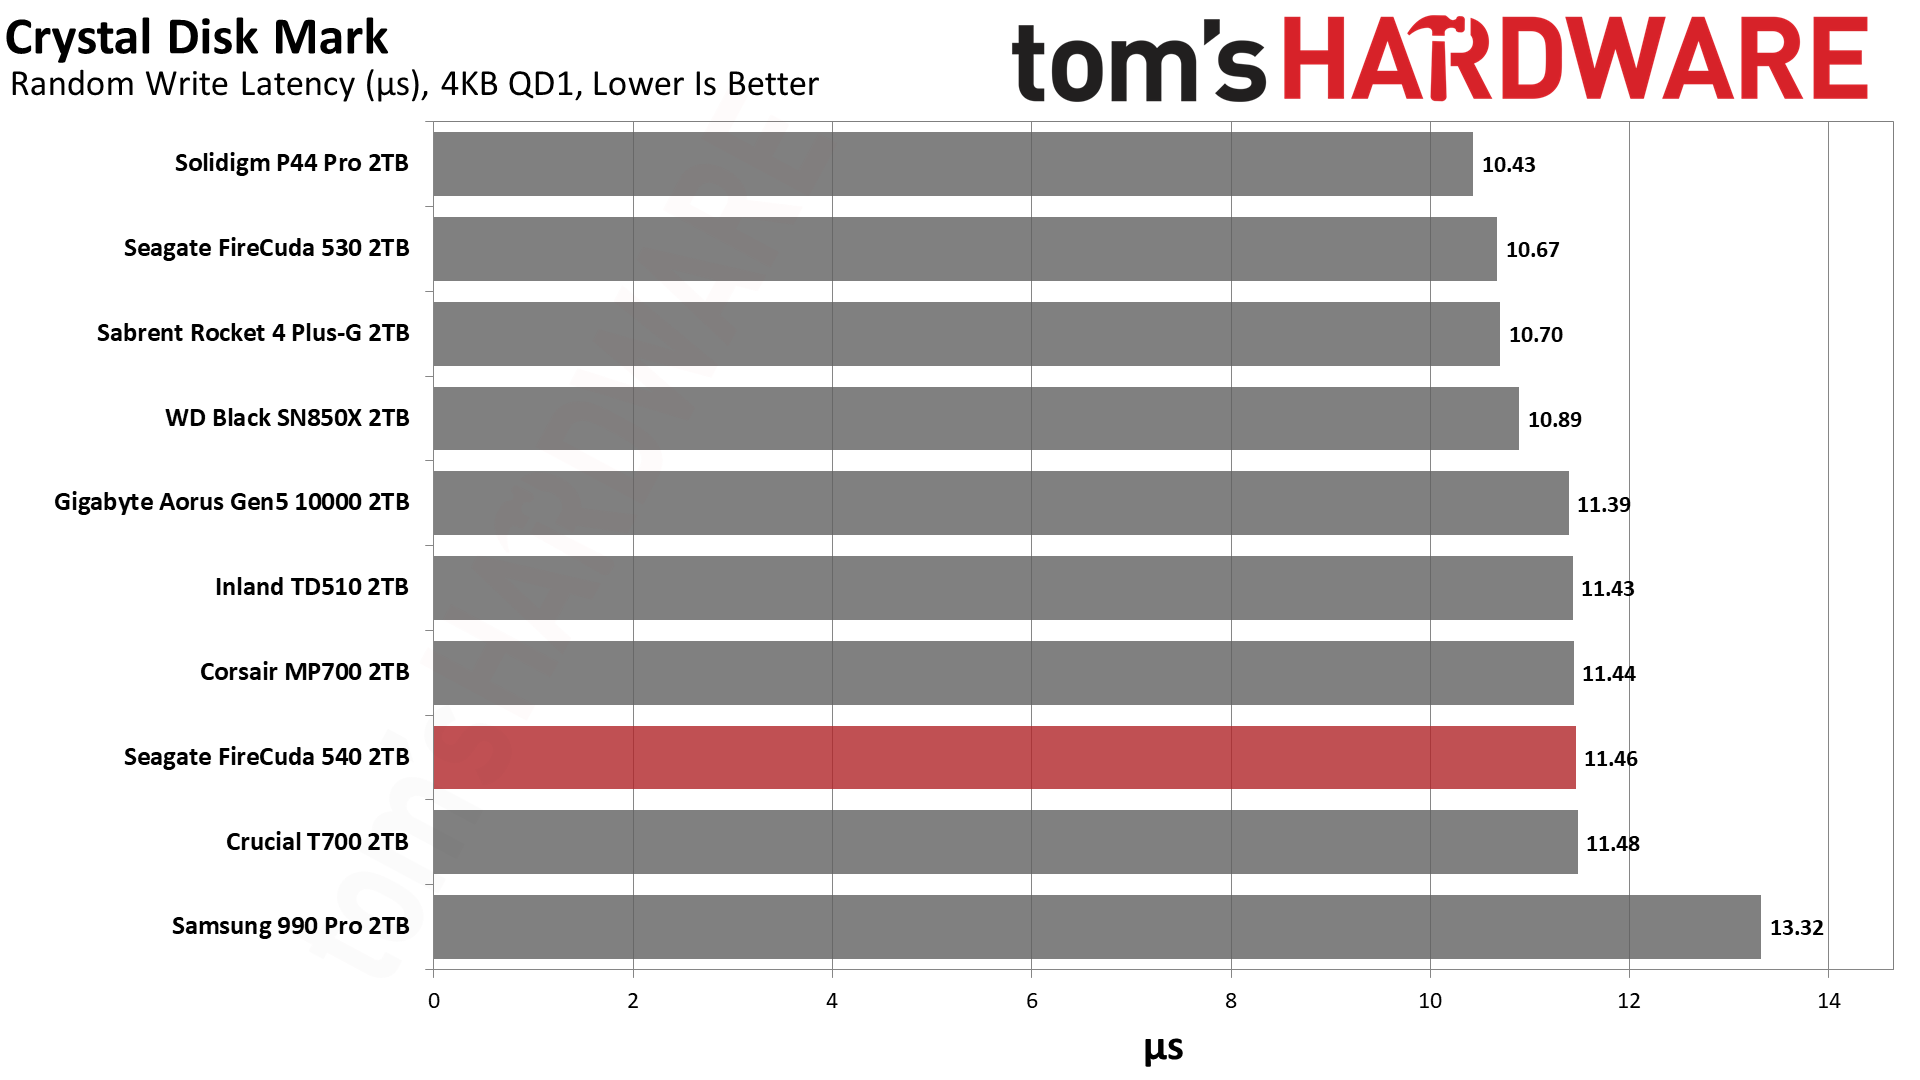
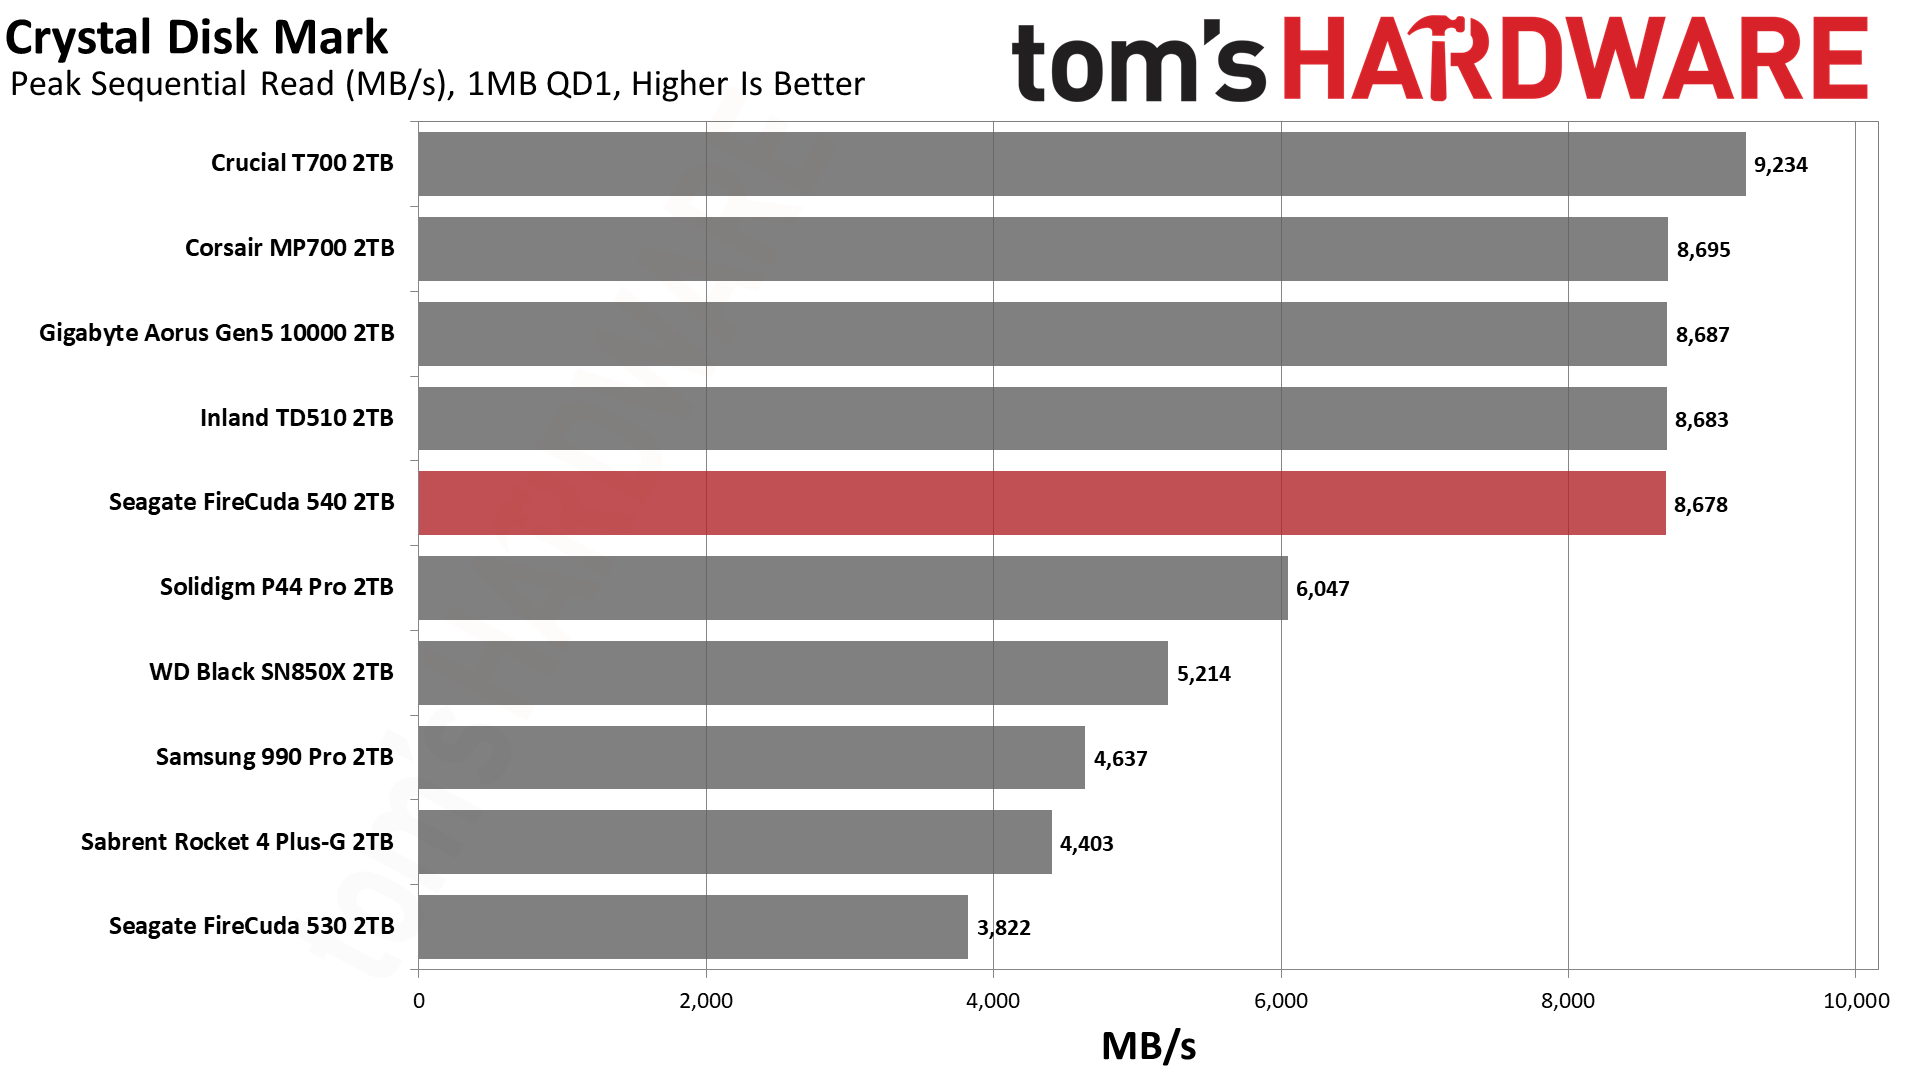
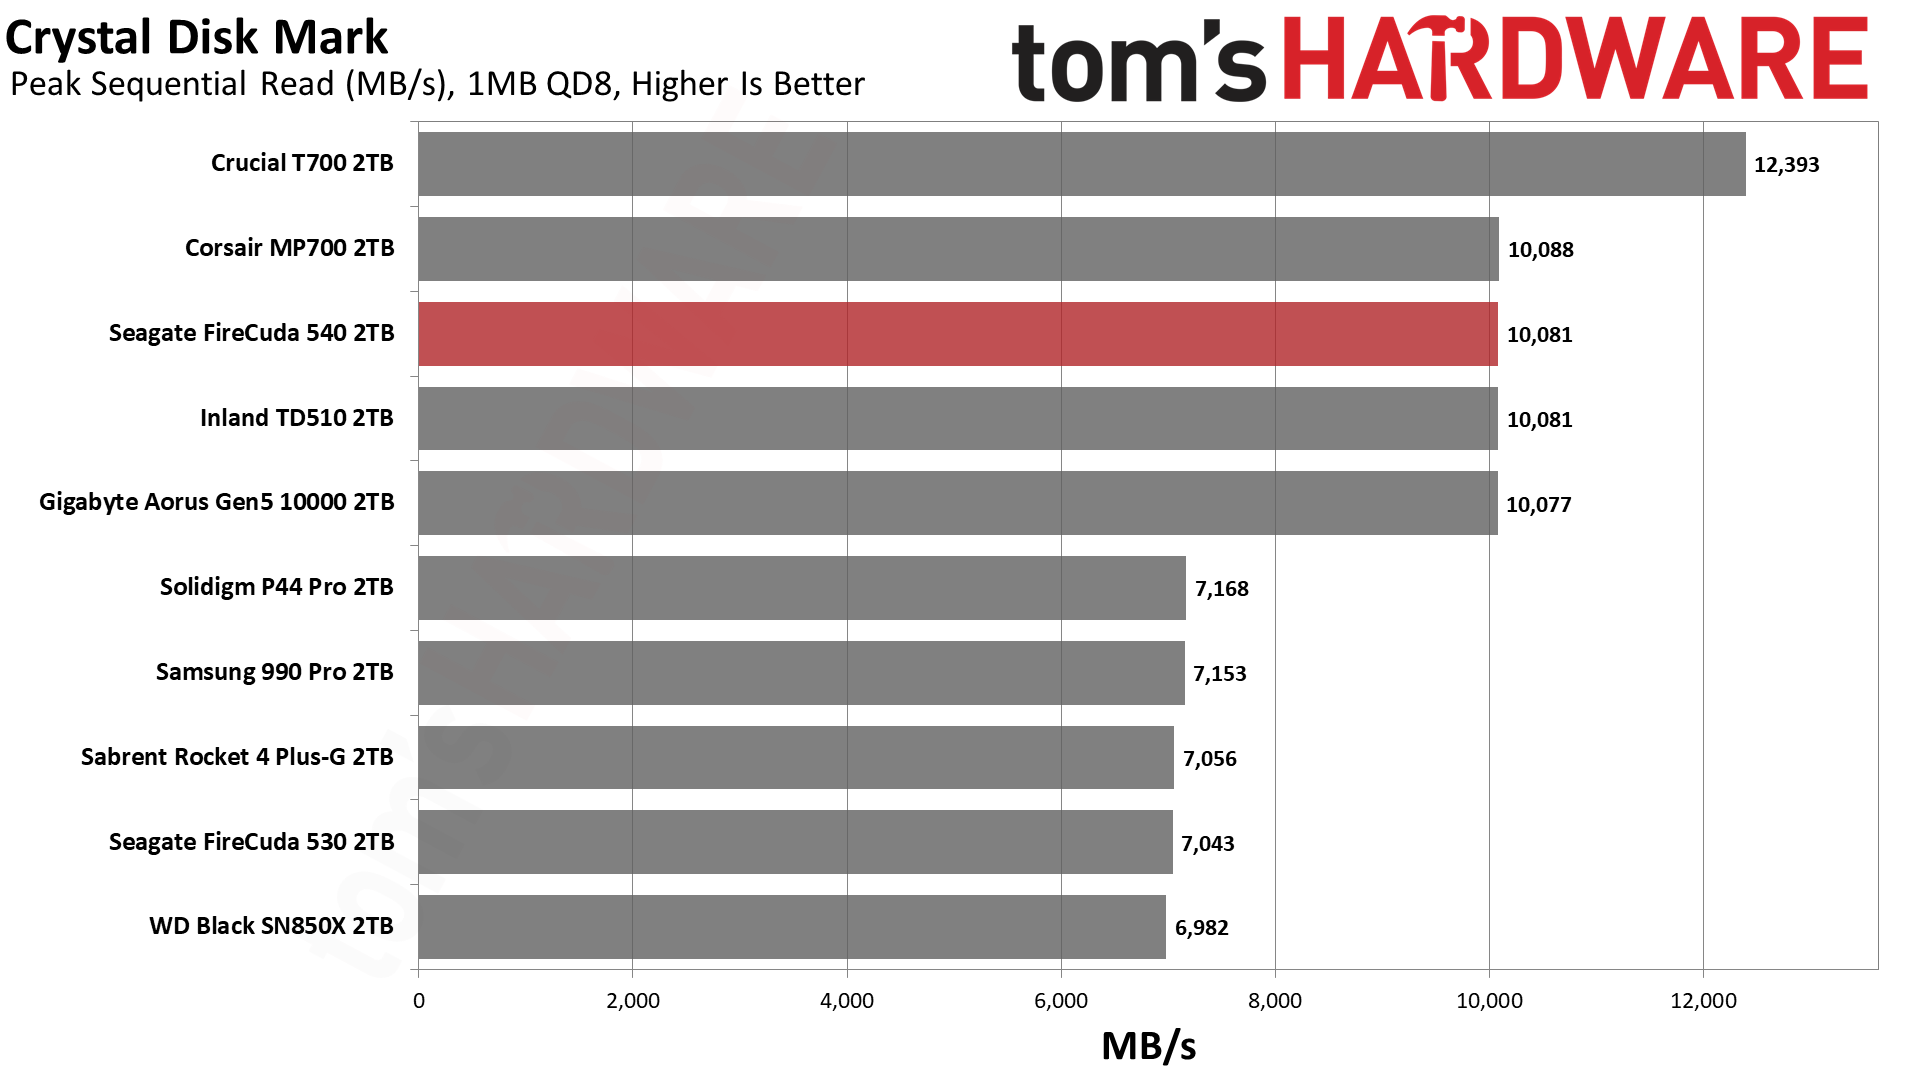
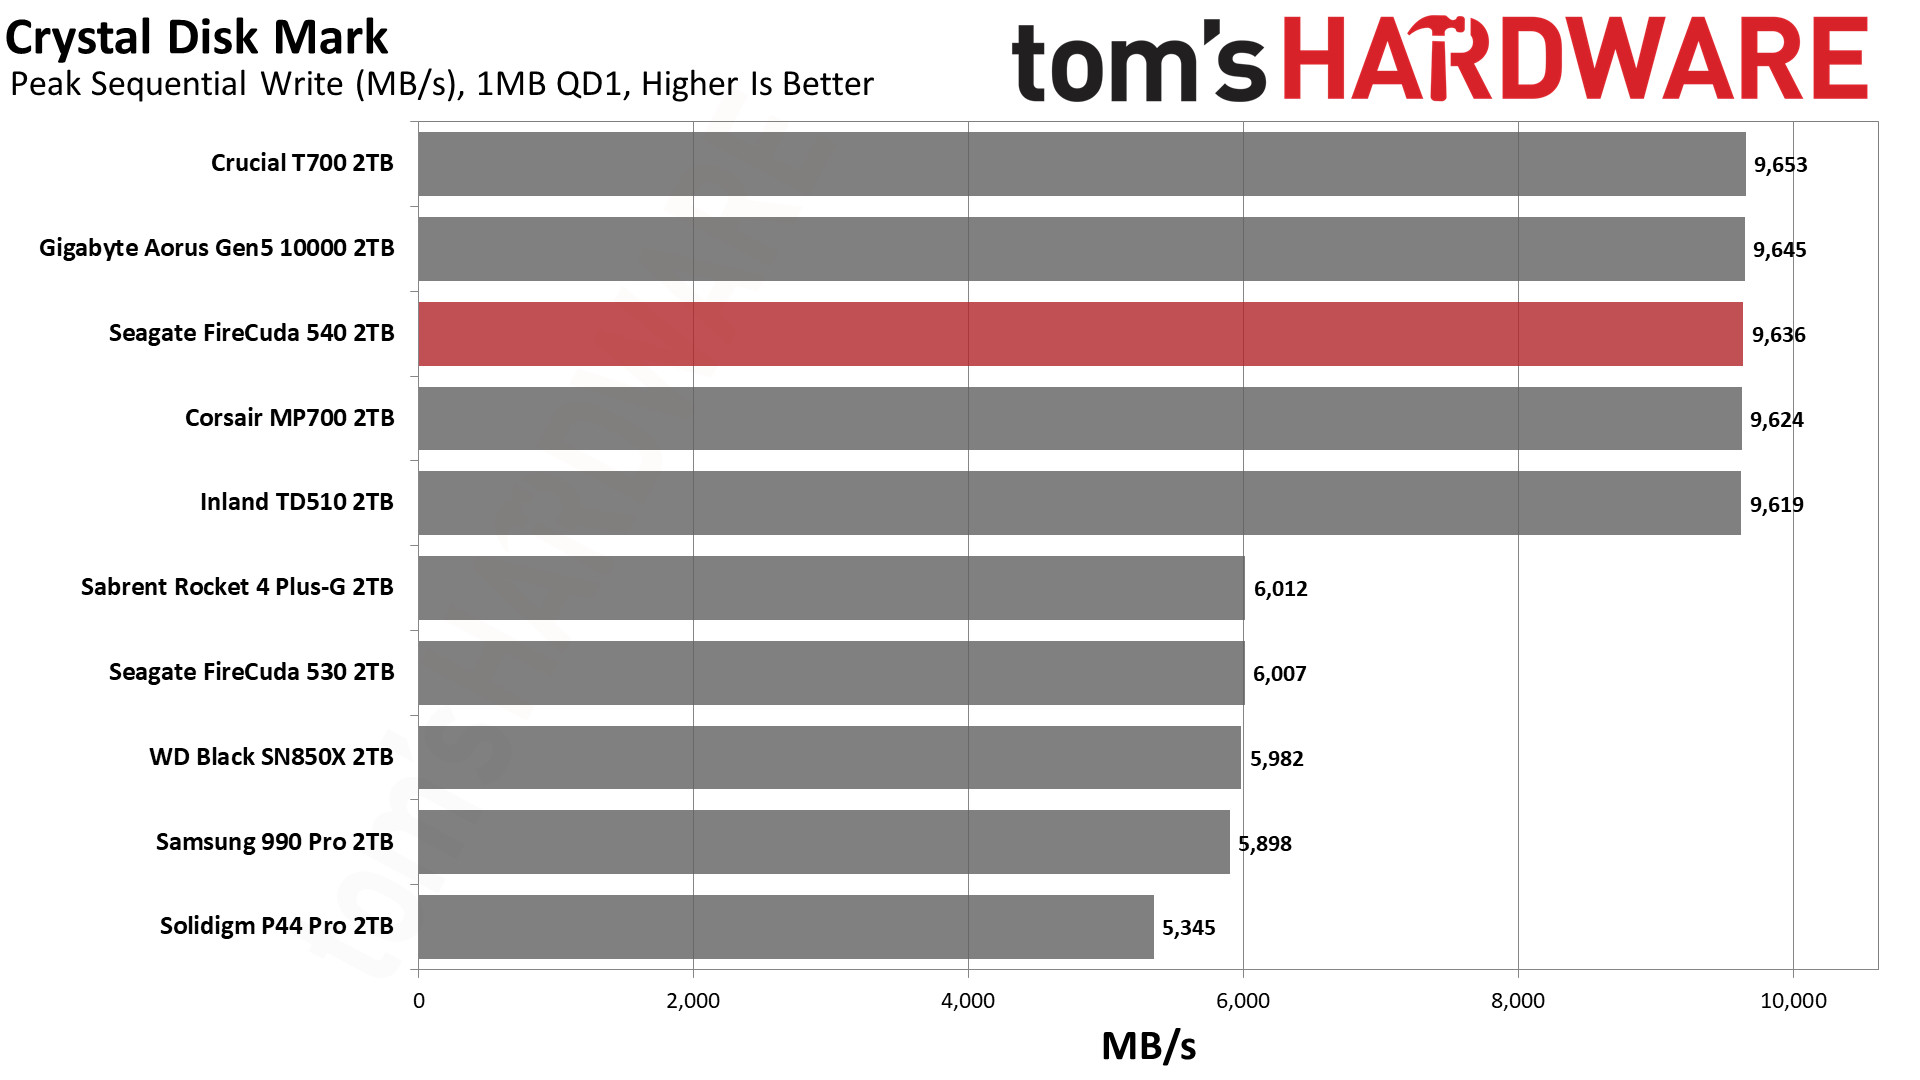
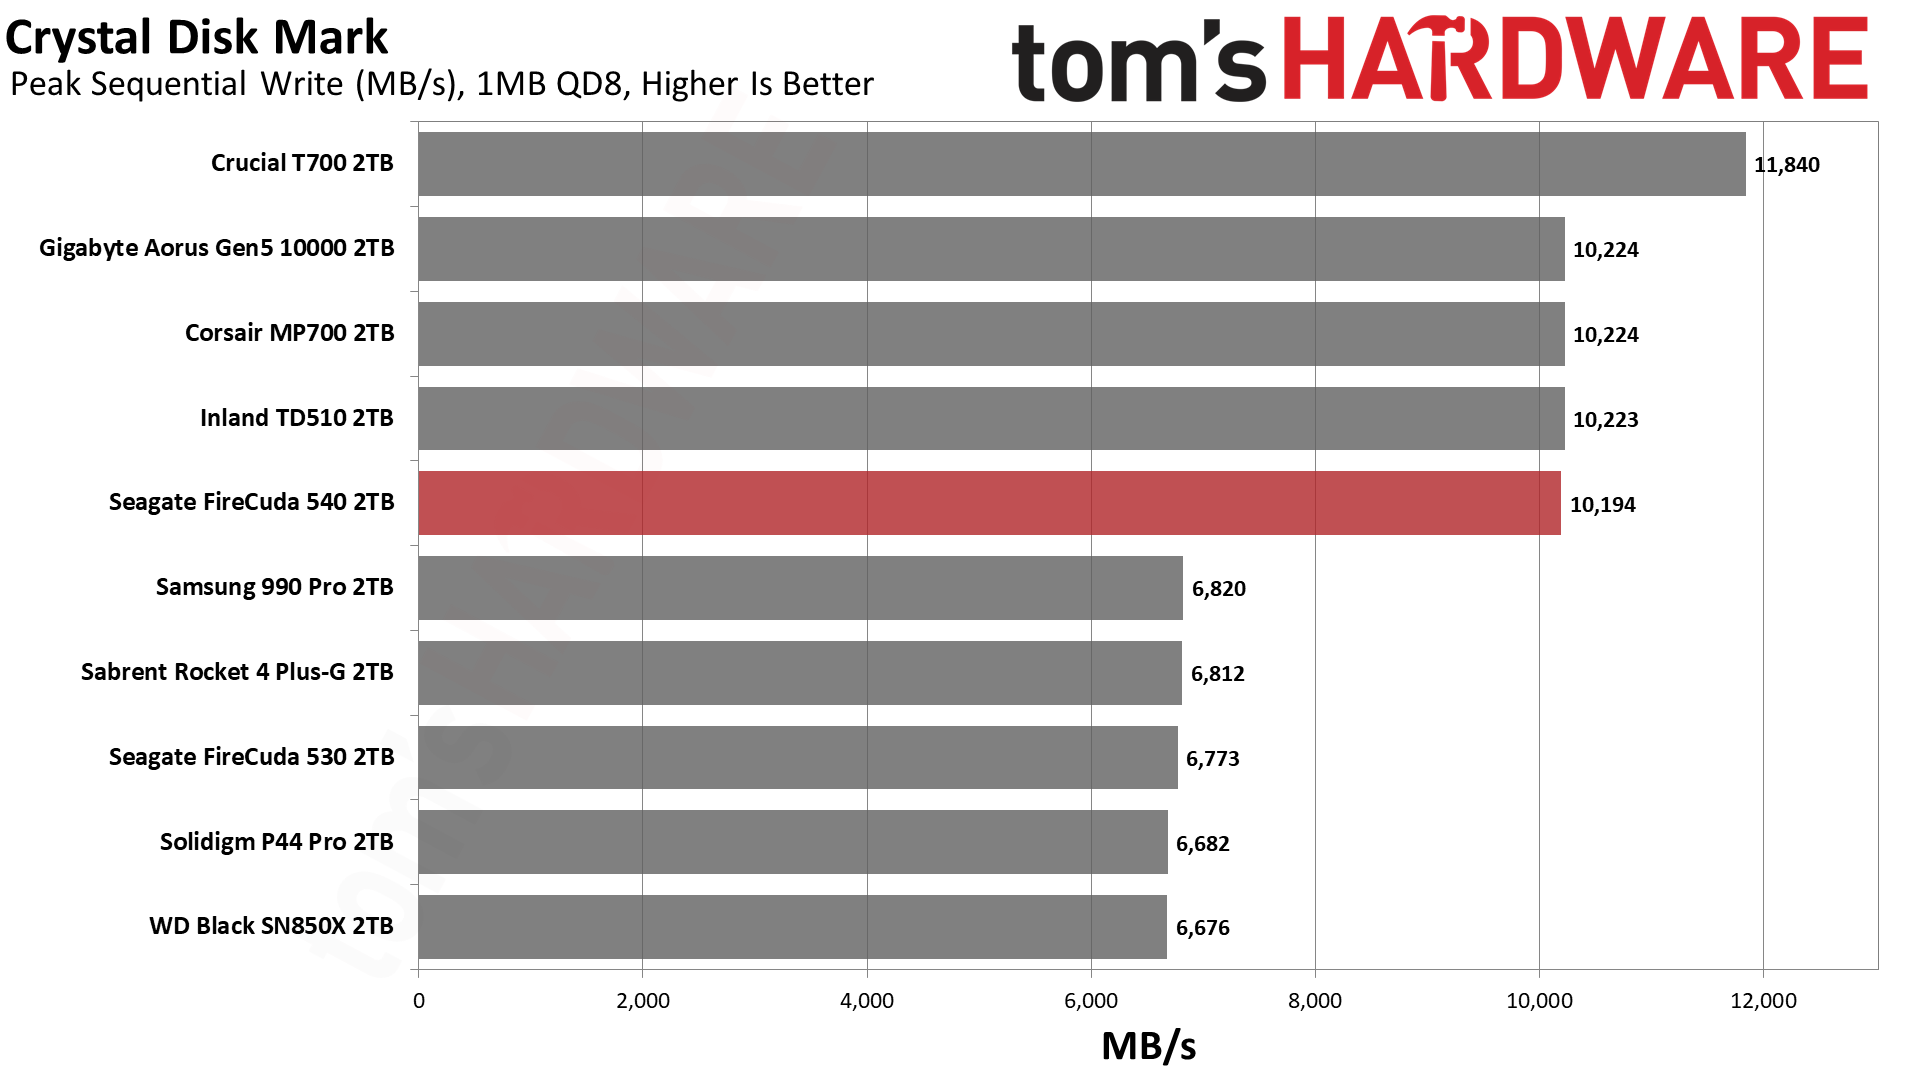
There are no surprises with ATTO. The FireCuda 540 closely follows the TD510, Aorus 10000, and MP700, all of which only trail the T700 by a small amount. This is further reflected by Crystal Disk Mark’s sequential results. The only area of disappointment for the FireCuda 540 and other similar drives is that random 4K performance at low queue depth is relatively lackluster. This should improve over time with faster and more mature flash.
Sustained Write Performance
Official write specifications are only part of the performance picture. Most SSDs implement a write cache, which is a fast area of (usually) pseudo-SLC programmed flash that absorbs incoming data. Sustained write speeds can suffer tremendously once the workload spills outside of the cache and into the "native" TLC or QLC flash.
We use Iometer to hammer the SSD with sequential writes for 15 minutes to measure both the size of the write cache and performance after the cache is saturated. We also monitor cache recovery via multiple idle rounds.
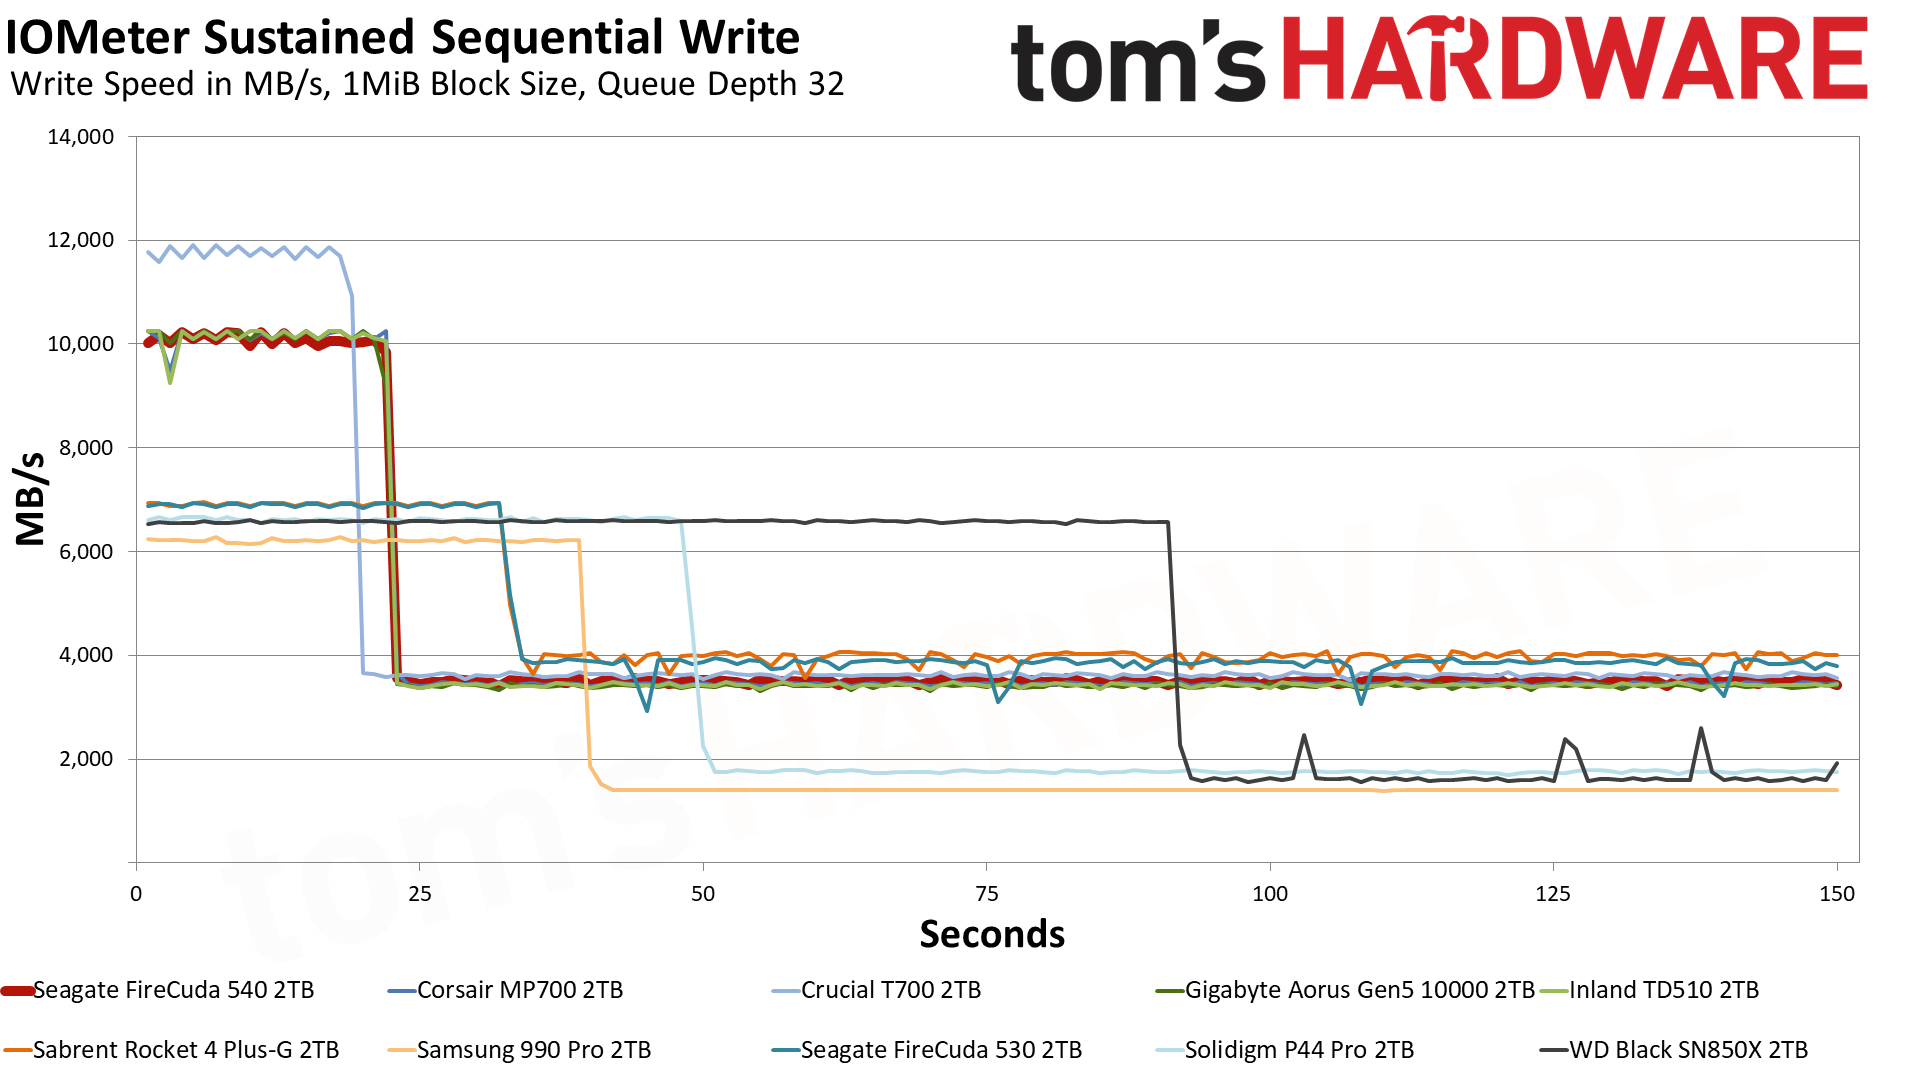
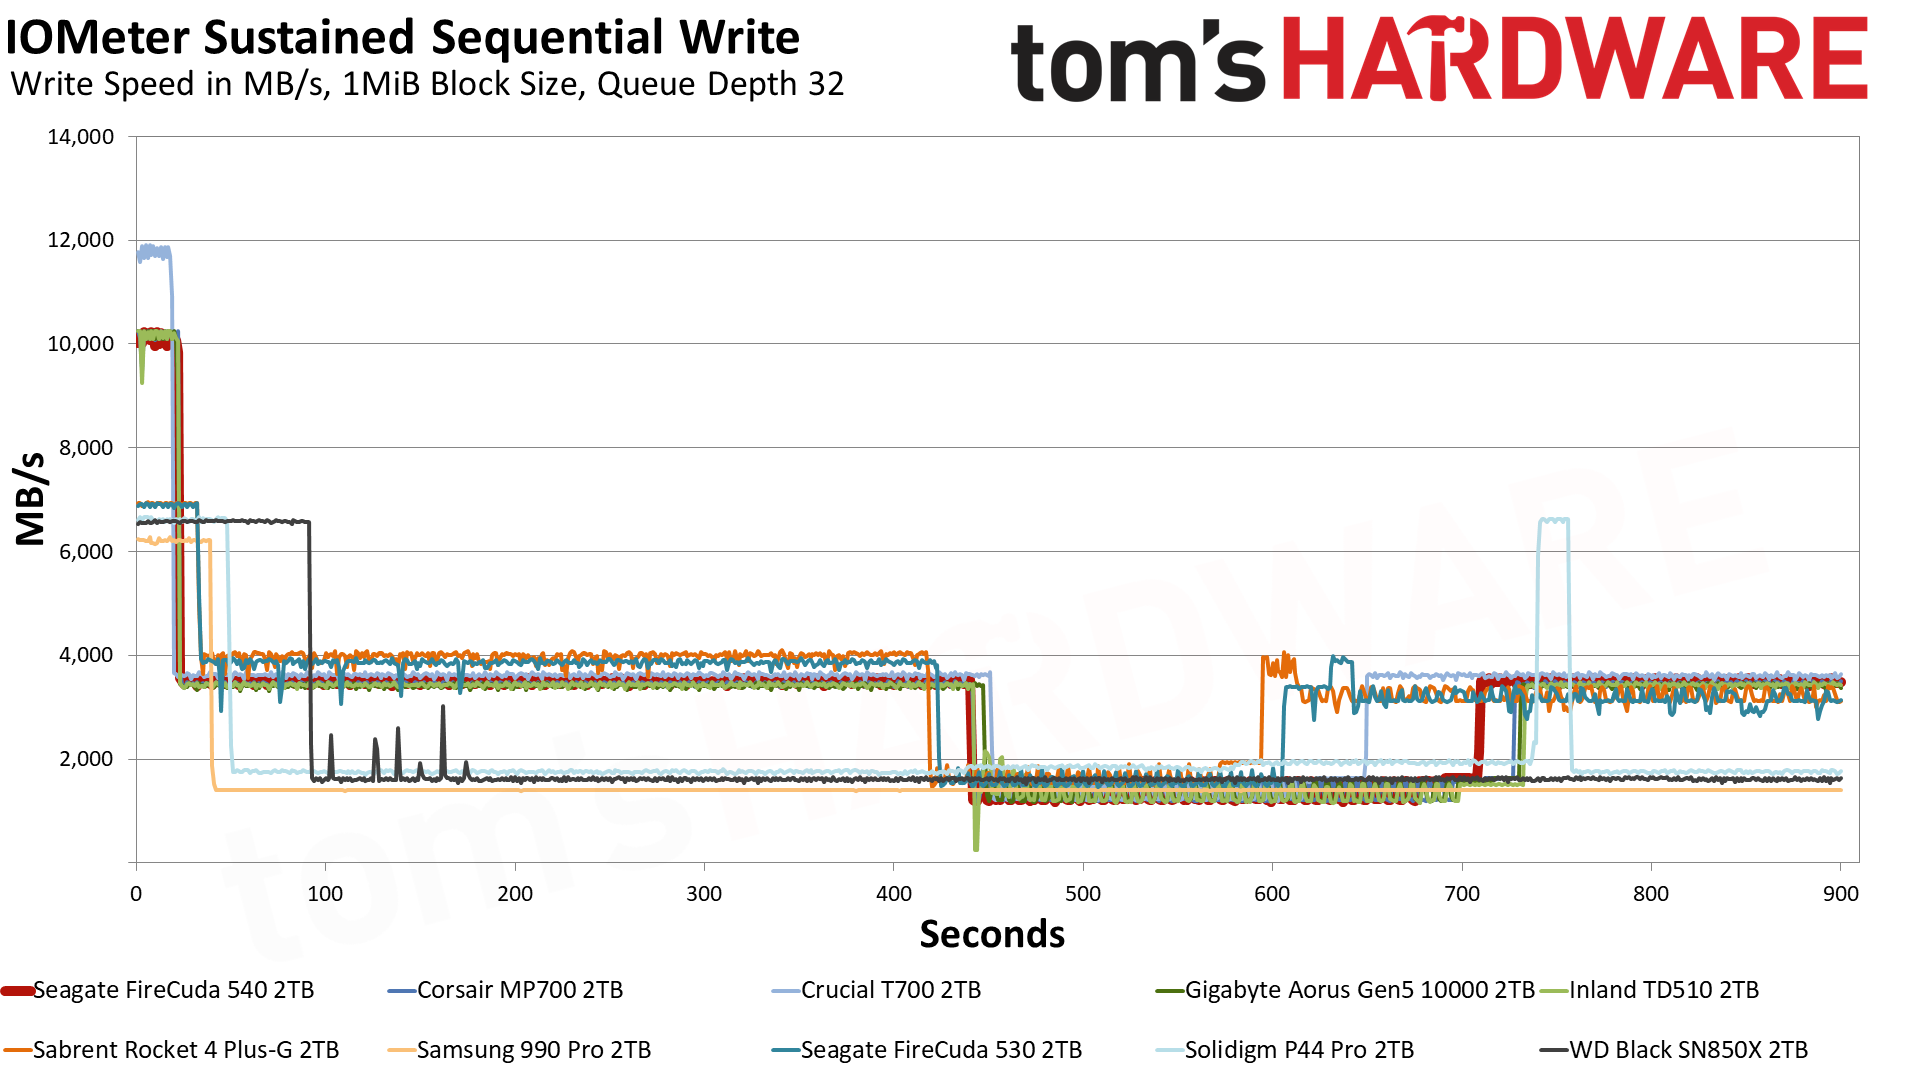
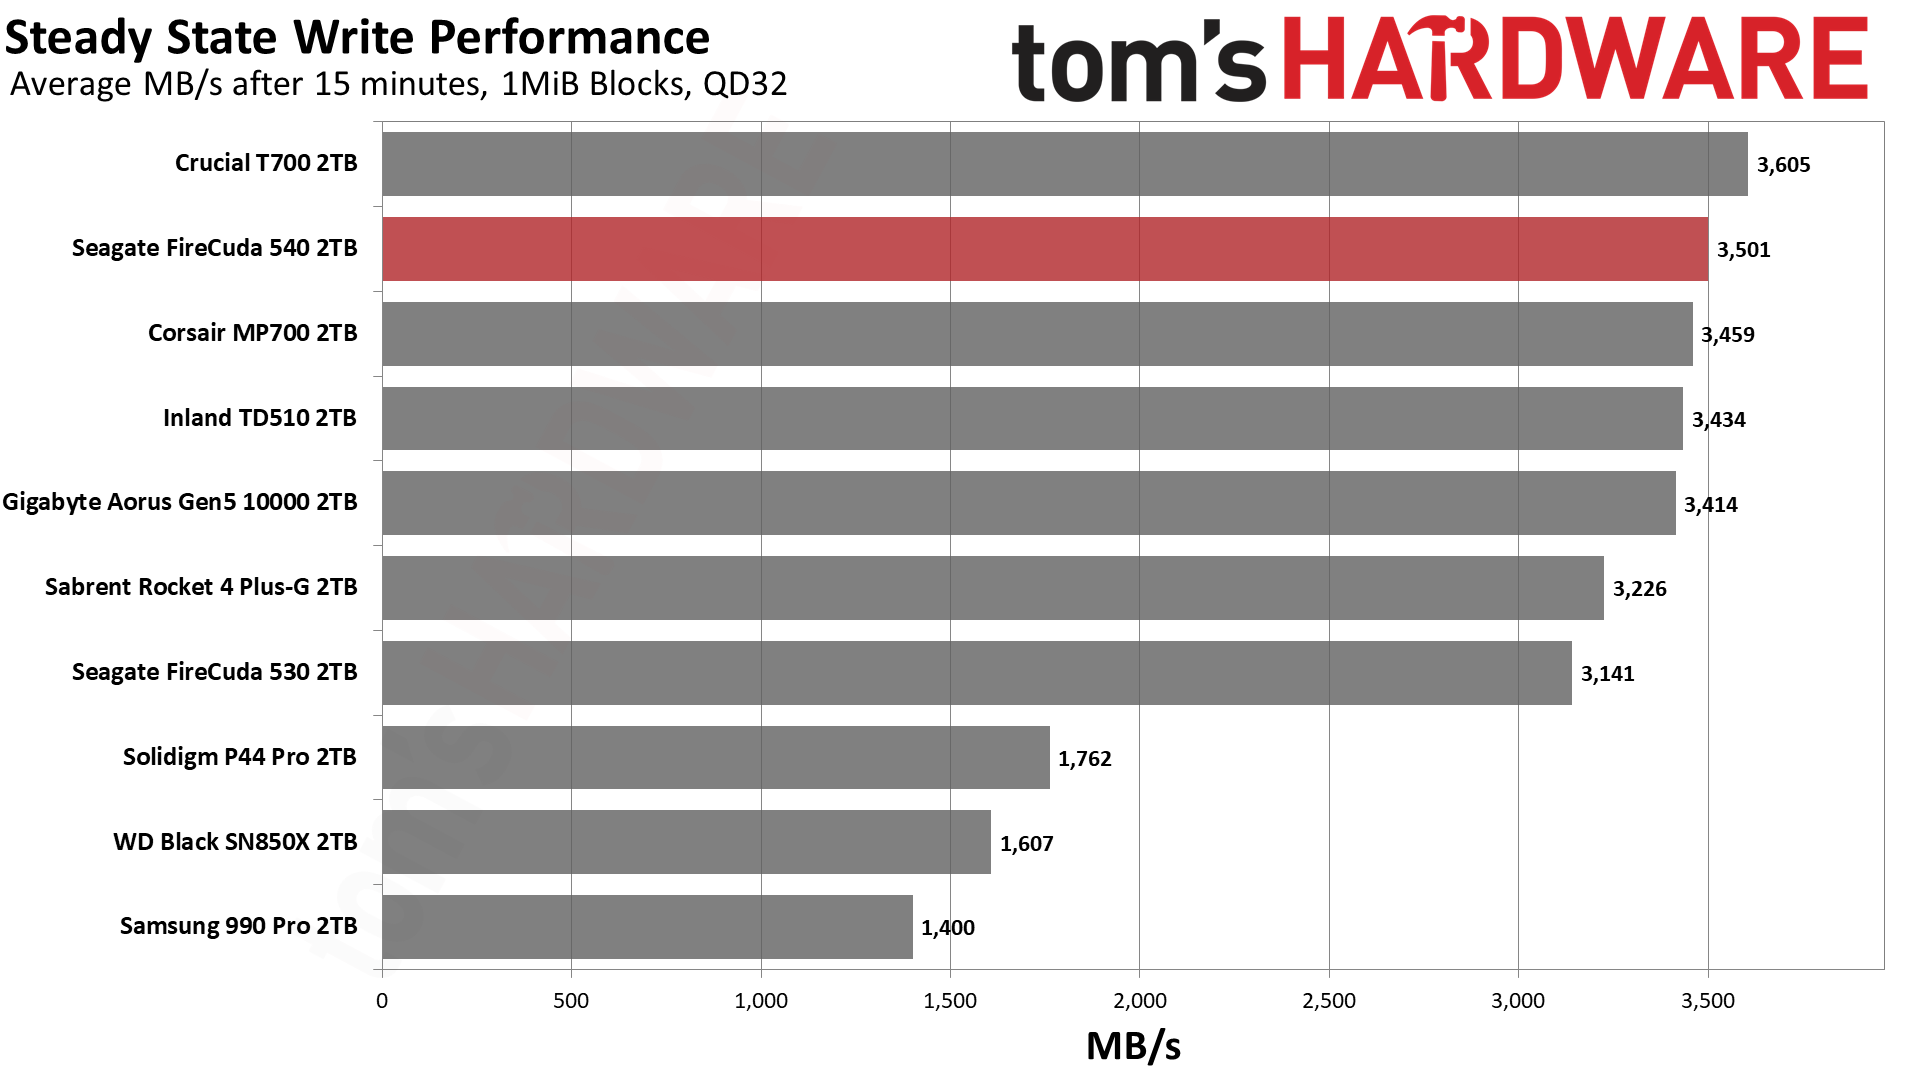
Although E26 drives can use all of their flash for the pSLC mode - that is, to provide a cache of up to 1/3 of available user space - the drives tested so far have been more conservative. This improves sustained write performance and may also keep the drives from overheating more quickly. The FireCuda 540 does not stray from this path, writing at 10 GB/s for over 20 seconds with a 220GB pSLC cache before dropping down to TLC speeds. The overall steady-state write performance is pegged at 3.5 GB/s.
This doesn’t seem particularly overwhelming given that this flash has 50% more planes than the previous generation, and yet the older Rocket 4 Plus-G can hit over 3.2 GB/s in a steady state. One reason for this is that 4TB drives are required to hit the right amount of interleaving due to using a denser flash. Another reason is, as discussed above, that maintaining high levels of performance with so much cutting-edge flash might be challenging, given the power-hungry operating conditions.
It’s also been argued that such performance isn’t needed outside enterprise, although I think it’s becoming clear that these drives are already leaning towards workstation use. Certainly, they are intended for high-end desktops at a minimum, which is underlined by how Seagate approached this SSD’s design.
Given idle time, the FireCuda 540 tends to stick to TLC speeds, not freeing up pSLC until absolutely necessary. This can reduce write amplification in some cases and will also improve cached reads. This has benefits, as we’ve seen with Solidigm's driver, although it’s also likely designed around future DirectStorage workloads, which require careful I/O balancing.
Power Consumption
We use the Quarch HD Programmable Power Module to gain a deeper understanding of power characteristics. Idle power consumption is an important aspect to consider, especially if you're looking for a laptop upgrade as even the best ultrabooks can have mediocre storage.
Some SSDs can consume watts of power at idle while better-suited ones sip just milliwatts. Average workload power consumption and max consumption are two other aspects of power consumption, but performance-per-watt is more important. A drive might consume more power during any given workload, but accomplishing a task faster allows the drive to drop into an idle state more quickly, ultimately saving energy.
For temperature recording we currently poll the drive’s primary composite sensor during testing with a 24C ambient.
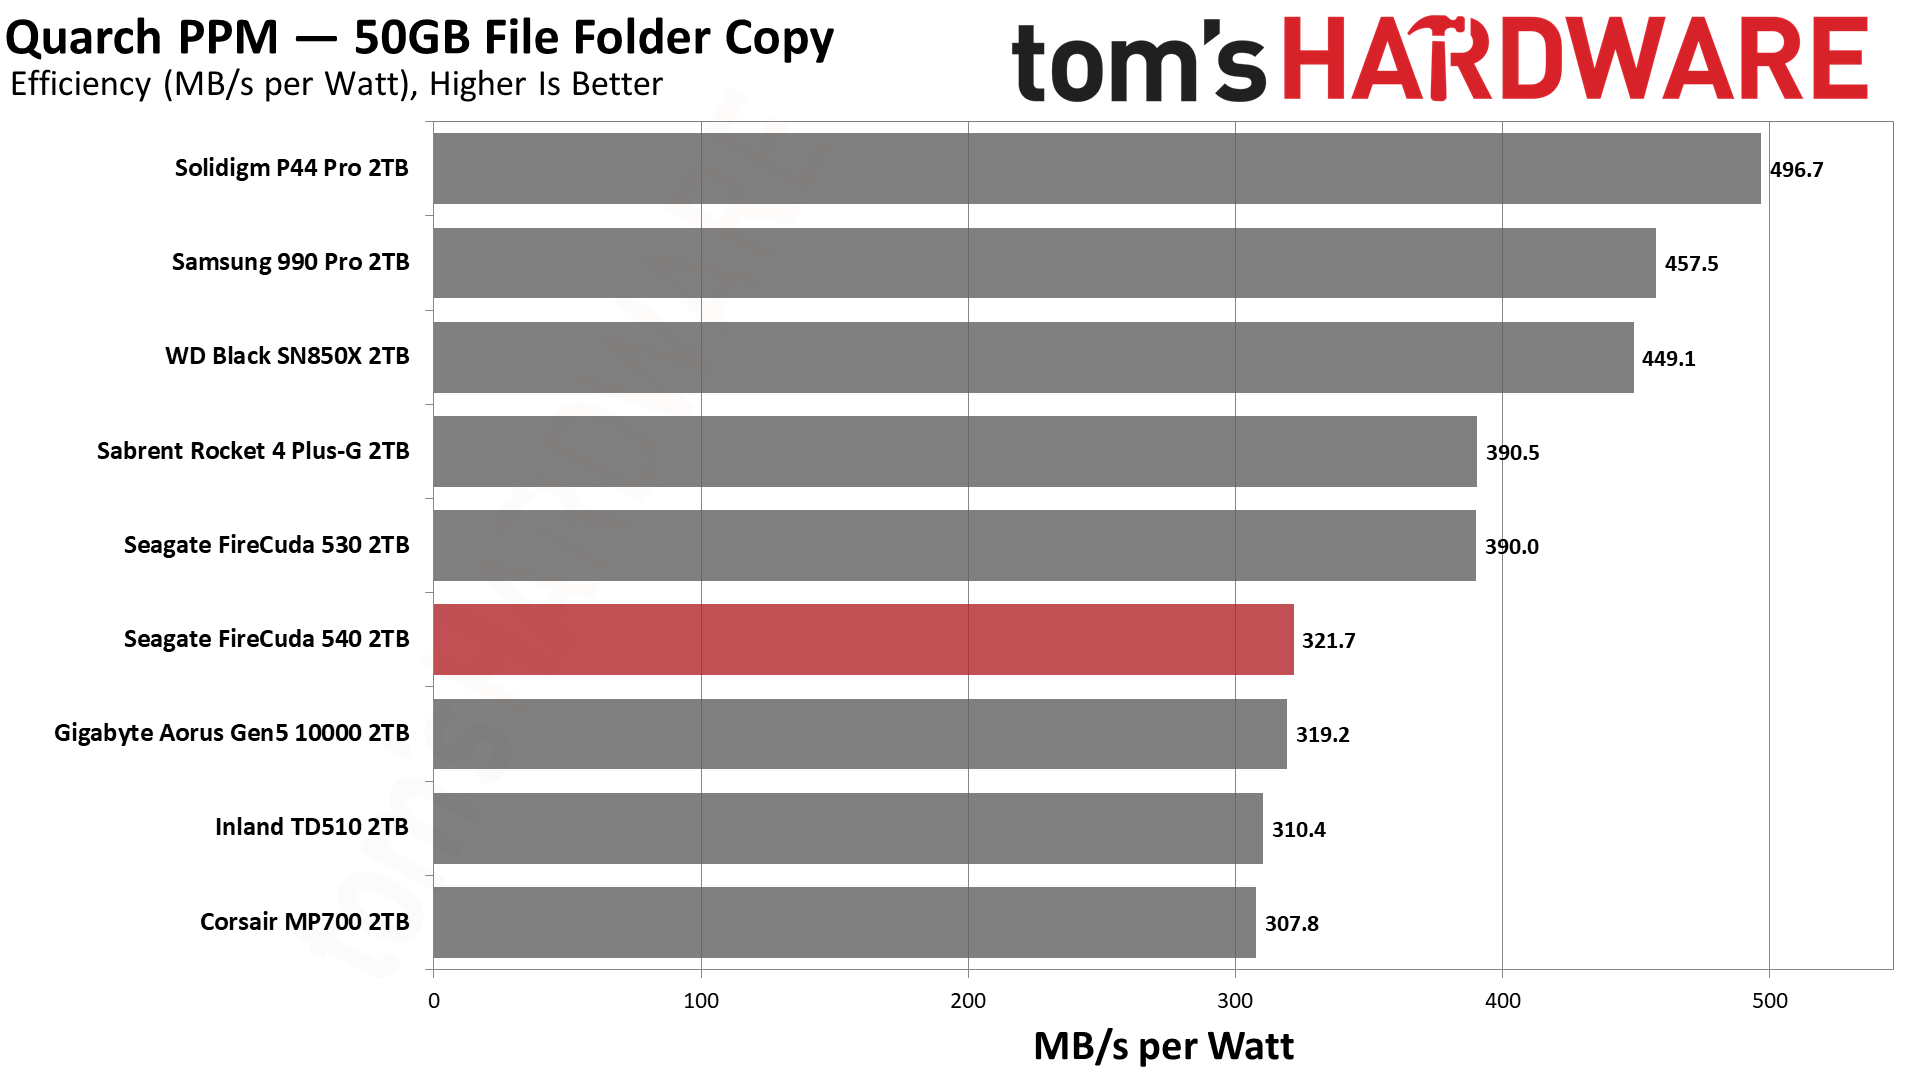
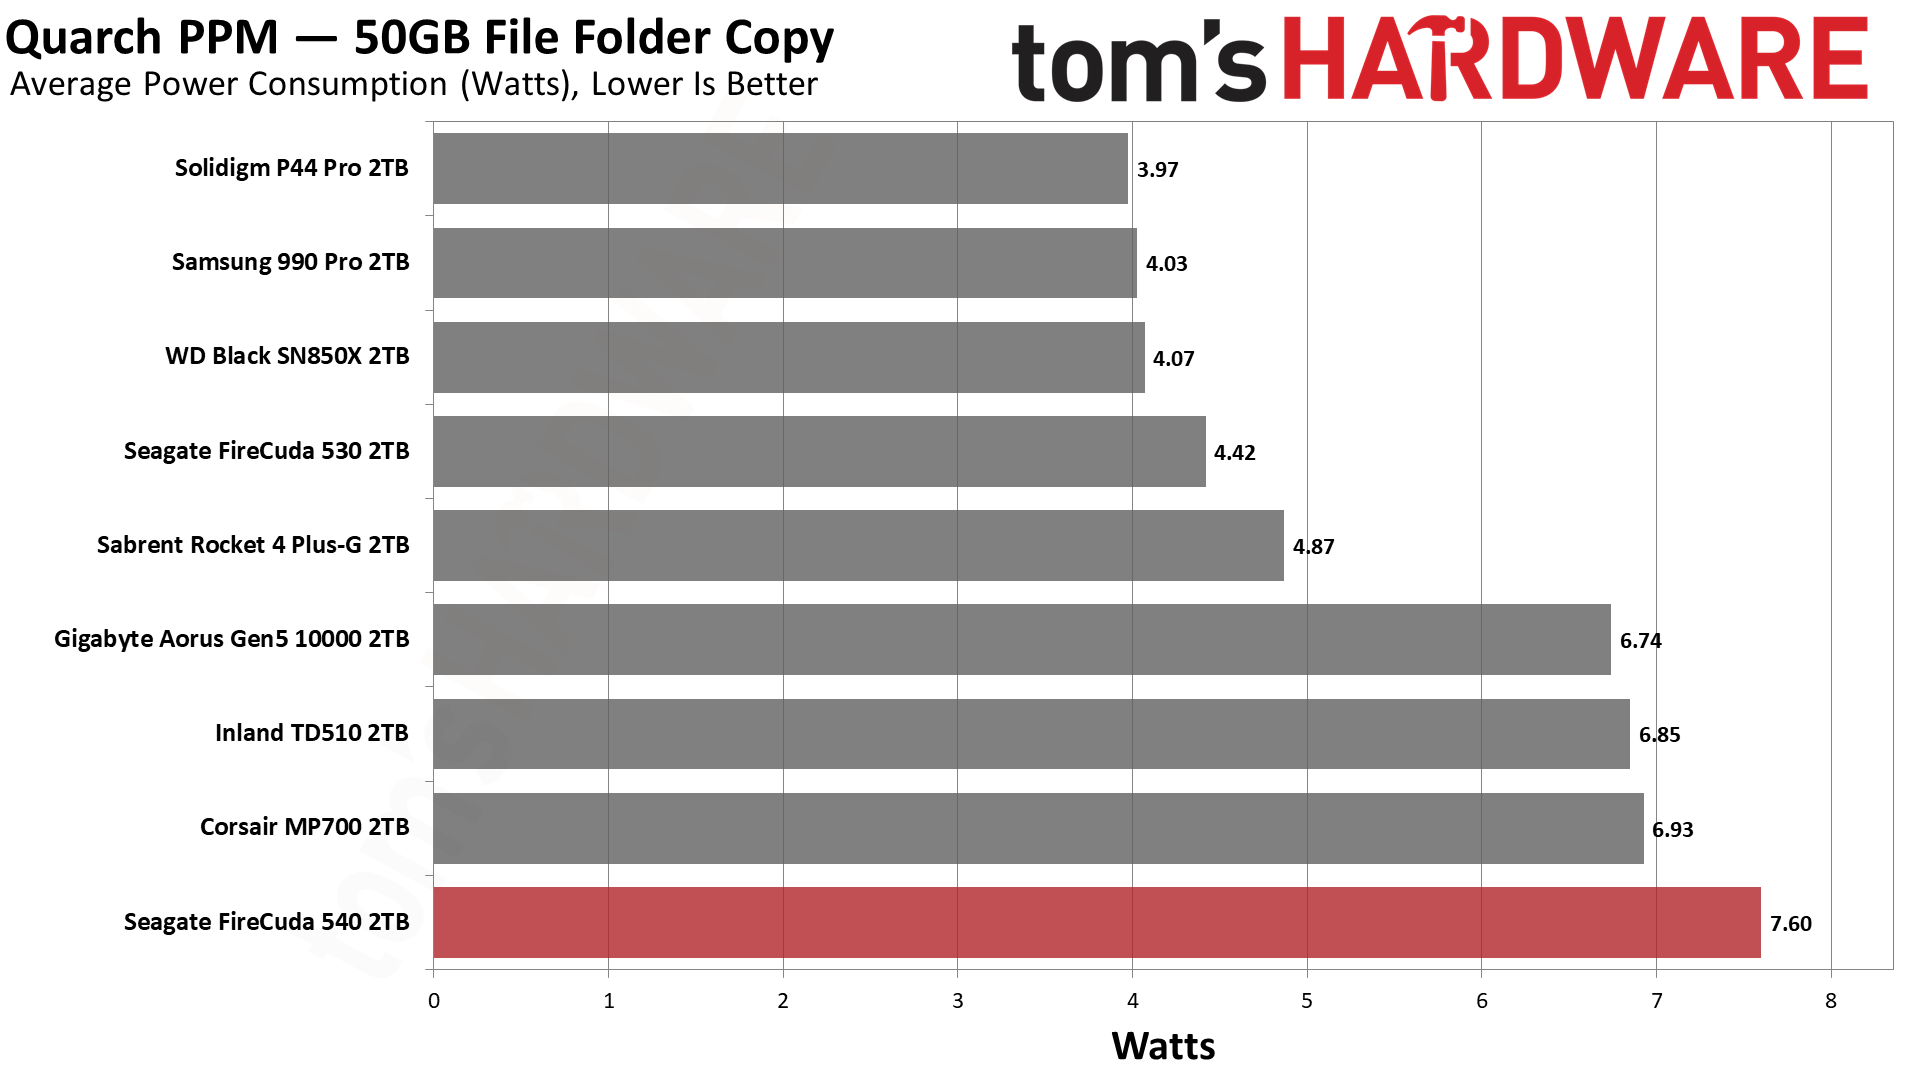
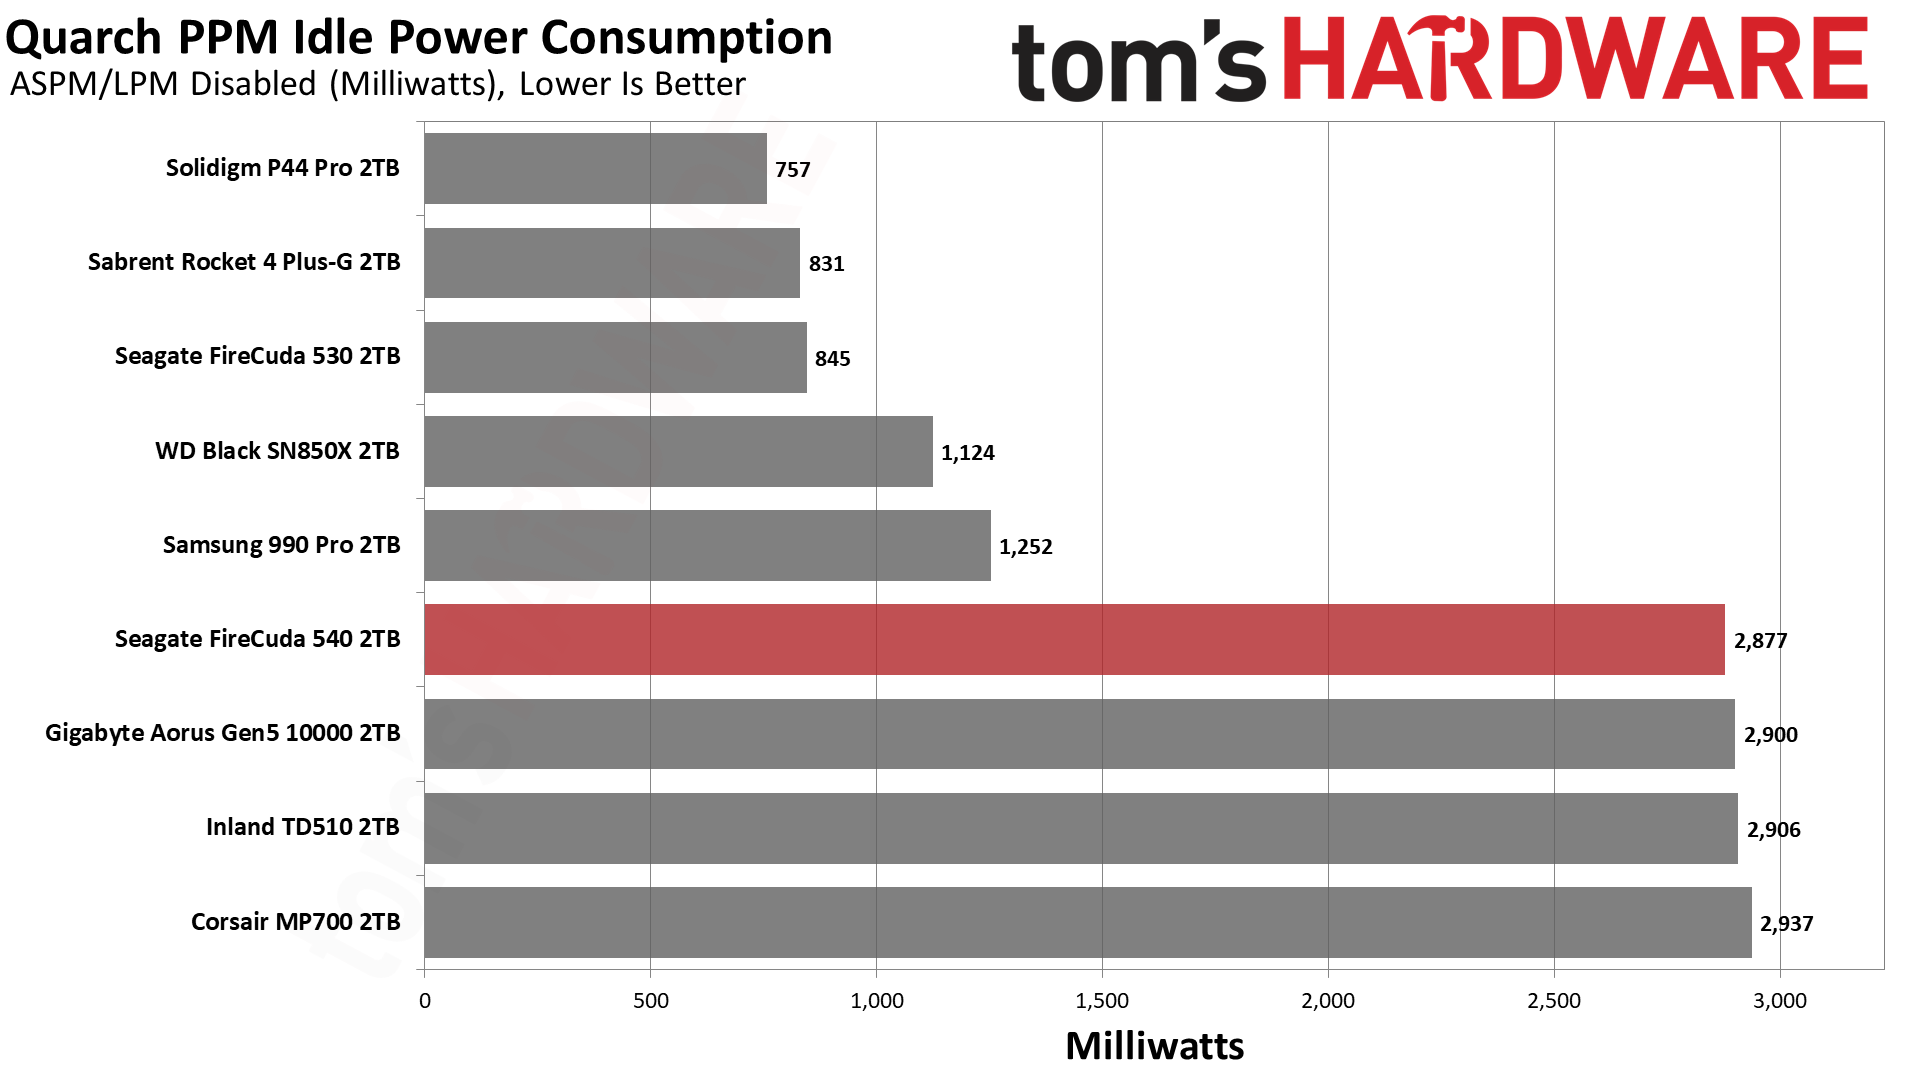
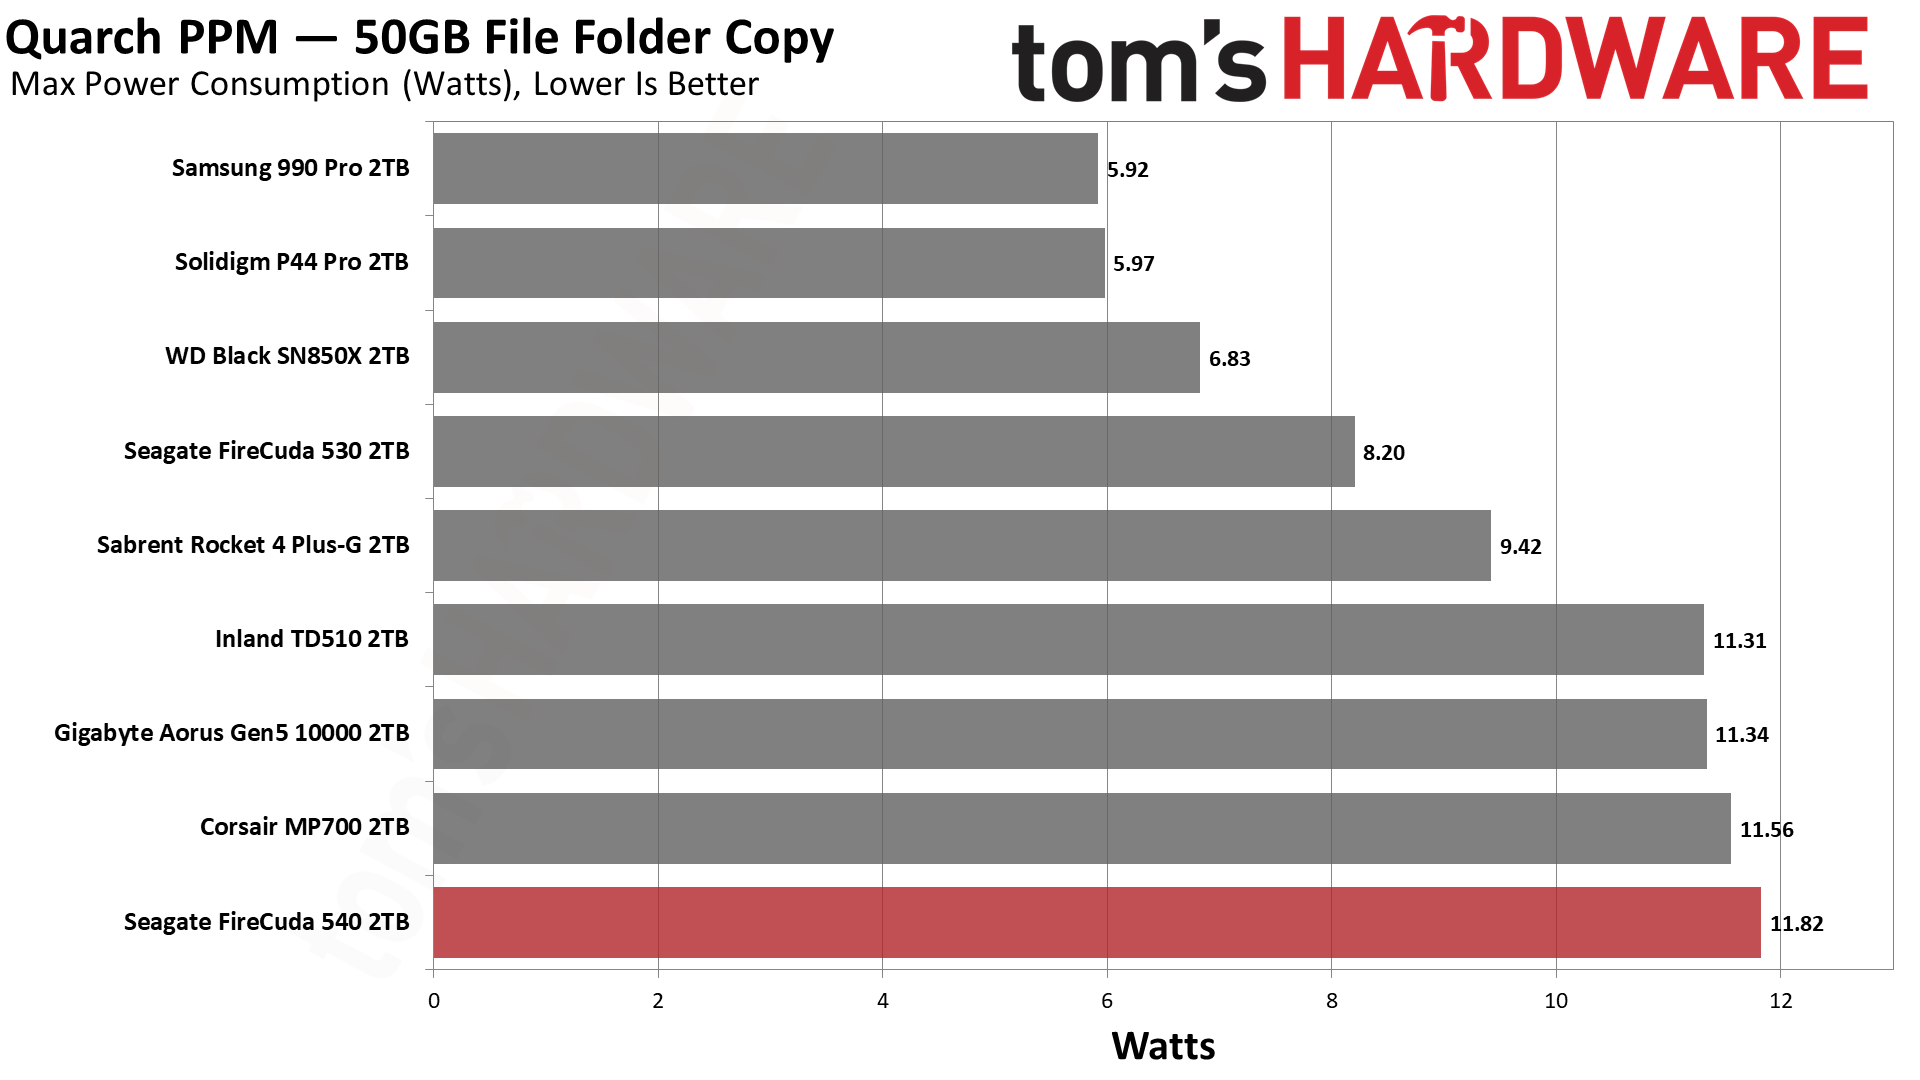
The FireCuda 540 has the typical poor power efficiency we’ve come to expect from E26 drives, and idle power draw also remains high. The latter is something we had hoped would improve from the prototype. The argument could be made that we have unfairly disabled power-saving features in the idle test. Still, this drive is not going into environments where one can realistically expect a lot of power-saving. An extra watt or two may not matter in such a system, but it does add up over time. According to Seagate, the 2TB drive can reach 11.5W with writes with a PS3 idle state at 144mW.
Thermally, the FireCuda 540 did eventually throttle during our testing when we tested without a heatsink. Active cooling directed at the drive kept it at or below 58C, which is well within reason. The drive utilizes a composite sensor with thresholds at 81C, 83C, and 85C, with DRAM and controller protection thresholds at 88C and 115C, respectively. Throttling by means of delaying I/O is engaged at the primary threshold of 81C and does not disengage until the drive cools to 77C or less. It’s definitely worth cooling this drive if you want it to enjoy a long, performant life.
Test Bench and Testing Notes
| CPU | Intel Core i9-12900K |
| Motherboard | Asus ROG Maximus Z790 Hero |
| Memory | 2x16GB G.Skill DDR5-5600 CL28 |
| Graphics | Intel Iris Xe UHD Graphics 770 |
| CPU Cooling | Enermax Aquafusion 240 |
| Case | Cooler Master TD500 Mesh V2 |
| Power Supply | Cooler Master V850 i Gold |
| OS Storage | Sabrent Rocket 4 Plus-G 2TB |
| Operating System | Windows 11 Pro |
We use an Alder Lake platform with most background applications such as indexing, Windows updates, and anti-virus disabled in the OS to reduce run-to-run variability. Each SSD is prefilled to 50% capacity and tested as a secondary device. Unless noted, we use active cooling for all SSDs.
Conclusion
On the face of it, the Seagate FireCuda 540 should and does score in line with the Inland TD510, the Corsair MP700, and the Gigabyte Aorus 10000. None of these drives can reach the heights of the Crucial T700, but on the other hand, there are a lot of fast drives inbound. Right here and right now, though, the FireCuda sets itself apart with its three-year data recovery service, its high TBW endurance rating, and its all-around solid software support. It doesn’t do anything new, but with a drive this fast, that’s okay.
The TD510 and Aorus 10000 come with heatsinks, but this can be undesirable depending on your build. Certainly, the reference heatsink on the former leaves much to be desired. The TD510 is less expensive and has a six-year warranty, but weak support otherwise. The Aorus, for its part, has been difficult to find, and its optional large heatsink might not fit all builds - plus, it adds additional cost. This leaves the MP700 as the closest direct competitor to the FireCuda 540, but all else being equal, the latter is the superior choice on paper.
The problem is that value comes down to pricing, as it always does. Seagate can add a small price premium to this drive and make out okay because it has unique features that are worthwhile to many. It needs to differentiate this product because, let’s face it, there will be a dozen drives out there with the same hardware. In some respects, the FireCuda 540’s differentiation makes it more appealing in general, say, versus high-end PCIe 4.0 drives, but if the price gap is too large, then it’s a difficult proposal to accept unless reliability is your number one concern.
There are certainly better drives for laptops, the PS5, and everyday PCs. The WD Black SN770, for example, is regularly far more inexpensive, is very efficient, and performs at a high-end level where it counts. Drives like the FireCuda 540 are instead intended for high-end use, including content creation, where the storage price tends to be less of a factor when compared to overall build cost. For that scenario, the FireCuda is a decent choice, given all of its support features and high overall performance. It makes sense for Seagate to specialize in this way, and that makes the drive worthwhile.
MORE: Best SSDs
MORE: Best External SSDs and Hard Drives
MORE: How We Test HDDs And SSDs
MORE: All SSD Content

Shane Downing is a Freelance Reviewer for Tom’s Hardware US, covering consumer storage hardware.
-
lmcnabney At 5x the price of the cheaper 4x4 modules this is just a toy for the rich so they can save maybe a whole second every time they load a modern game.Reply -
dk382 Seagate's Firecuda series have always been great SSDs. It's a shame that they always seem to be in such low supply and priced so high. My Firecuda 510 still barely has a dent in its health rating after four years of use, three of which was as an OS drive.Reply -
everettfsargent Could someone please explain iometer and sequential writes to an ssd? Also after a full write to a disk should not the test stop?Reply
Elsewheres it has been suggested to use ms windows diskspd cli instead. And elsewheres it has been suggested that iometer in a decade old or even older?
Writing more then 100% to an ssd makes no sense whatsoever. Someone please explain. You can somewhat see this in both the 2gb and 4gb seagate 530 ssd's at roughly 450 and 900 seconds into each test.
Finally, one would need to read from a much faster drive into ddr memory (ok, so maybe not, because you can copy directly from one storage medium to another, i. e. a raid volume for example) before writing to a secondary drive such as these ssd's, that would be realworld throughput. Just moving the same bits over and over from memory, i guess would work, and that is what i am assuming is meant by a synthetic benchmark. However writing past 100% of a physical drive's size is not meaningful to me for any real filesystem where the write volume is not normally overwritten ever as far as i know.
Thanks in advance. -
hotaru.hino Reply
Not sure if this answers your question, but the methodology for that test in particular was explained at https://forums.tomshardware.com/threads/details-for-sustained-sequential-write-performance-test.3603980/#post-21790529everettfsargent said:Could someone please explain iometer and sequential writes to an ssd? Also after a full write to a disk should not the test stop?
Elsewheres it has been suggested to use ms windows diskspd cli instead. And elsewheres it has been suggested that iometer in a decade old or even older?
Writing more then 100% to an ssd makes no sense whatsoever. Someone please explain. You can somewhat see this in both the 2gb and 4gb seagate 530 ssd's at roughly 450 and 900 seconds into each test.
Finally, one would need to read from a much faster drive into ddr memory (ok, so maybe not, because you can copy directly from one storage medium to another, i. e. a raid volume for example) before writing to a secondary drive such as these ssd's, that would be realworld throughput. Just moving the same bits over and over from memory, i guess would work, and that is what i am assuming is meant by a synthetic benchmark. However writing past 100% of a physical drive's size is not meaningful to me for any real filesystem where the write volume is not normally overwritten ever as far as i know.
Thanks in advance. -
everettfsargent hotaru.hino,Reply
Thanks i can see where everything is "zeroed" out so to speak. Also this test appears to be universal at least for the early part of the test where the dram cache is nit filled yet as most manufacturers apoear to quote similar numbers for max read/write speeds.
The only real reason i asked was in looking at the iometer results as a function of time and doing a mental integration (very roughly mind you) of that time series and going, wait a minute that is over 100% of a full capacity ssd drive write???
Also, a sequential write or read makes perfect sense for newly formatted spinners but makes absolutely no sense for ssd's.
I will now go back to lurking mode but would appreciate any additional information or insights (im thinking this is only useful for new unused blank ssd's).
It does make for a nice time series though, just not one for a drive past 100% of its capacity (brand new or otherwise). -
everettfsargent I even have more questions now. Pcie 3.0, 4.0 and 5.0 and dram caches. What is being written to, dram or physical ssd media, and the number of layers in these new 5.0 ssd's (that may explain the heat issues seen in this newest generation of 5.0 ssd's). More layers, same horizontal memory footprints (same M.2 physical dimensions), higher MBps on average (due to more layers?) equals more heat to dissipate?Reply
I currently think the iometer test is somewhat meaningless in real world tests and is only meaningful when moving very large amounts of data in one go (and where the dram cache is exceeded). -
dimar Would be nice to have some SSDs that stay at 30 deg C without heatsink, so I don't have to worry burning down my laptop or office desktop.Reply -
MattCorallo The 540s seem to have a firmware data corruption bug. I've tried a few of these after RMA'ing them repeatedly - pop a Firecuda 540 in a ceph cluster and watch ceph start to throw hundreds of data corruption rejections. Given Ceph is really just a "pretty high flush workload", I'd bet you can get the same result writing a ton to btrfs/zfs with `while true; do sync; done` running in the background and then trying to read it back or even high-writes PostgreReply
