Display Calibration 101: Step-By-Step With Datacolor's Spyder4Elite
In every monitor review, we recommend that enthusiasts calibrate their screens. The benefits are many, but how can achieve this without spending thousands of dollars on exotic gear? Today, we’ll show you how, and for less than the price of your monitor!
Test Patterns 101: What We Measure
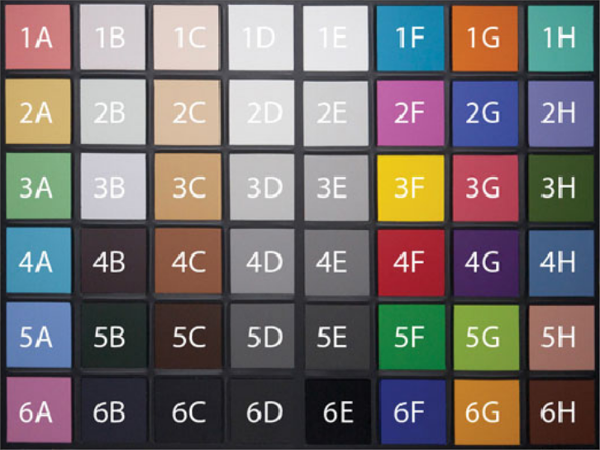
To create a calibration test suite, one needs a method of pattern generation. Most patterns are simple squares of color or gray that the meter reads to determine what adjustments are needed. The accuracy of these patterns is terribly important since measuring the wrong thing will result in a monitor that looks worse than before!
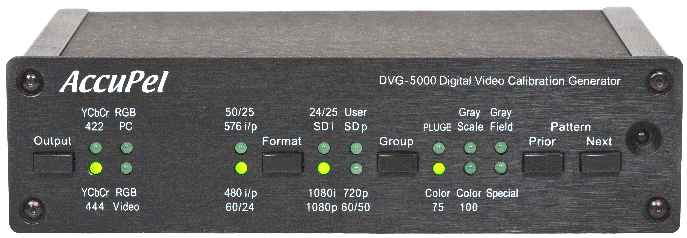
We use a standalone signal generator that sends reference patterns to the display. It’s made by Accupel and costs around $1500. While extremely useful in the lab, it isn’t exactly practical for most computer users. The alternative of course, is to use your computer to generate the patterns.
In the case of phones and tablets, we didn’t have a decent solution until recently. Datacolor recently came out with a product called SpyderGallery, which not only generates patterns on iOS- and Android-based devices, but also creates calibration look-up tables for them. While it’s impossible to actually and fully calibrate a smartphone or tablet because the controls simply aren’t there and the OSes are locked down, this method compensates via software, allowing the user to view more accurate images through the SpyderGallery app.
All modern fixed-pixel displays create images in RGB format. That is, each pixel is made up of a red, green, and blue sub-pixel. These sub-pixels are lit to one of 256 luminance levels to render the required color. Thanks to this, it’s easy to create a pattern from simple RGB values. For example, this much red plus that much green plus so much blue equals forest green. In the case of reference patterns, a red primary would be R255, G0, B0, in other words, the maximum red signal without the other two primaries in the mix. Gray patterns are no different, simply input the appropriate RGB values for whatever shade of gray you desire.
Calibration software like CalMAN or Spyder4Elite can generate patterns on the fly for a meter to measure. Automating the process in software is a tremendous time-saver, especially when measuring 30+ patterns for a color saturation test!
The patterns themselves are either fields or windows of a particular color or gray level. For instance, when measuring grayscale, 11 patterns are displayed one after the other, from full black to full white, in 10 percent increments. When measuring color, the patterns are color primaries (red, green, blue) and secondaries (cyan, magenta, yellow) and can vary in saturation and brightness level. We’ll cover those terms in more detail in our next article. All you need to know now is that these patterns are what the meter is measuring.
Now, let’s look more at the software itself and how it turns the measurement data into something we can actually use to improve our display.
Get Tom's Hardware's best news and in-depth reviews, straight to your inbox.
Current page: Test Patterns 101: What We Measure
Prev Page Color Meters 101: How We Measure Next Page The Software: Tying It All Together
Christian Eberle is a Contributing Editor for Tom's Hardware US. He's a veteran reviewer of A/V equipment, specializing in monitors. Christian began his obsession with tech when he built his first PC in 1991, a 286 running DOS 3.0 at a blazing 12MHz. In 2006, he undertook training from the Imaging Science Foundation in video calibration and testing and thus started a passion for precise imaging that persists to this day. He is also a professional musician with a degree from the New England Conservatory as a classical bassoonist which he used to good effect as a performer with the West Point Army Band from 1987 to 2013. He enjoys watching movies and listening to high-end audio in his custom-built home theater and can be seen riding trails near his home on a race-ready ICE VTX recumbent trike. Christian enjoys the endless summer in Florida where he lives with his wife and Chihuahua and plays with orchestras around the state.
-
Someone Somewhere I've been doing this for years.Reply
However, I wouldn't recommend Colorvision - their support for open source software is pitiful.
It would be nice to have the option to calibrate the monitor instead of just using colour profiles though. It can get irritating to run the same test on multiple OSs or computers attached to the same monitor. -
envy14tpe Thank you so much for doing this article. I think calibrating a monitor (at home) is very important for accuracy.Reply
I use the Spyder Express 4 and love the results. There are 3 models of the Spyder 4 and buyers need to choose which is best for their use.
Would it be possible to make the images a larger file so people can see the difference more clearly? -
daglesj I have a Spyder 3 Pro.Reply
Great device when you first unbox it, then not so good when you find the colours and visuals look far worse after you finish with odd tinges and hues.
Then you read up and find the the devices are not actually calibrated and set properly when they leave the factory.
Pretty useless. I wouldn't buy another spyder. Look elsewhere for proper results. -
Traciatim I've been looking at picking up a calibration tool set for a while so I liked reading this article. My question though is that I want to use my setup to calibrate TV's for friends, Monitors, Laptops, multi monitor setups, TV's with PCs and Multiple other devices attached . . . I was looking at getting the Spyder4 Elite and the TV HD upgrade but it seems like if I calibrate a TV with a PC attached using the TV HD version and then try to do the PC with the software then is that going to mess up the previous settings?Reply
If anyone has any experience with these tools in multi-use and multi-display scenarios or has a better option on what tools to get I would really appreciate any info.
-
WyomingKnott "All modern fixed-pixel displays create images in RGB format." Sharp states that their Aquos line has a yellow sub-pixel. It might be interesting to compare one of their TVs to a similar RGB panel.Reply -
Someone Somewhere None of the connections allow it to receive data with a yellow channel though, so it's all interpolated in the display.Reply -
ddpruitt Great article, I always try to do this with monitors and displays. Most are set up so horribly out of the box and people always use what feels good instead of what's right. I have never used a color calibrator because there's so little factual information. I'll probably ending getting one of these now.Reply -
ojas I wish you could cover some free/open source software, $249 is still a bit much for some like me...plus exchange rate is getting painful these days :(Reply

