Display Calibration 101: Step-By-Step With Datacolor's Spyder4Elite
In every monitor review, we recommend that enthusiasts calibrate their screens. The benefits are many, but how can achieve this without spending thousands of dollars on exotic gear? Today, we’ll show you how, and for less than the price of your monitor!
Spyder4Elite How-To: Wrapping Up
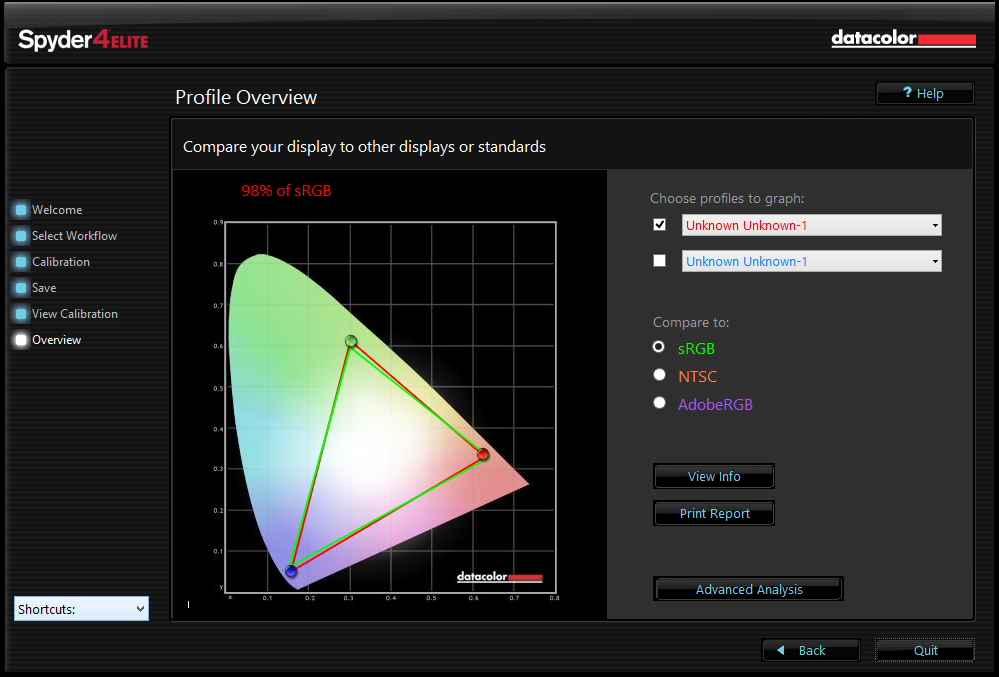
On the final screen is a CIE chart that displays the calibrated result. You can toggle between three different gamuts (sRGB, NTSC, and AdobeRGB) to see how your display stacks up.
If you have multiple profiles saved, you can plot up to two of them at a time on the same CIE chart in order to compare their results.
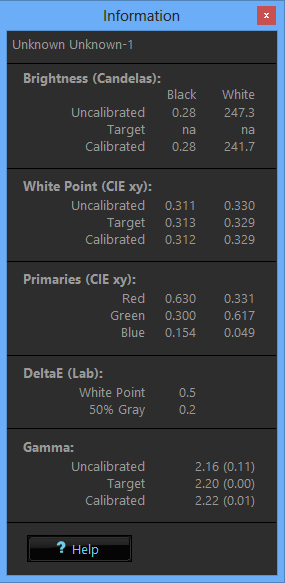
The View Info button opens a new window displaying detailed Brightness, White Point, Primaries, DeltaE, and Gamma measurements.
The Print Report button combines the CIE chart and contents of the View Info window on a single page.
We’d like to see additional graphs for white balance and gamma added to this window; perhaps a future version will include them. However, for those interested in seeing full measurements, there are individual tests available when you click the Advanced Analysis button.
Advanced Analysis
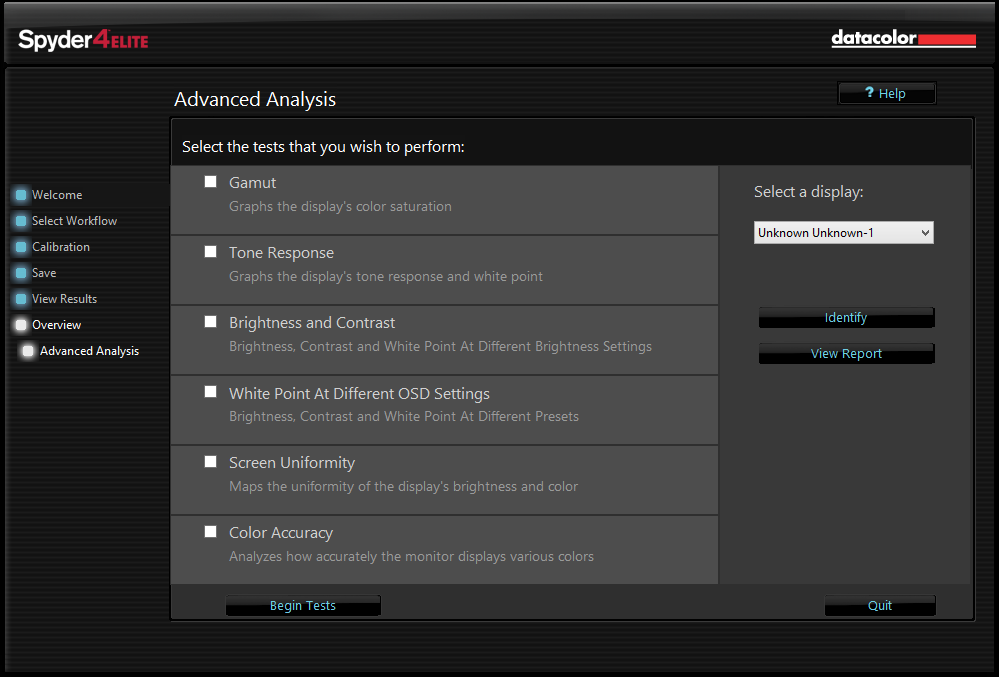
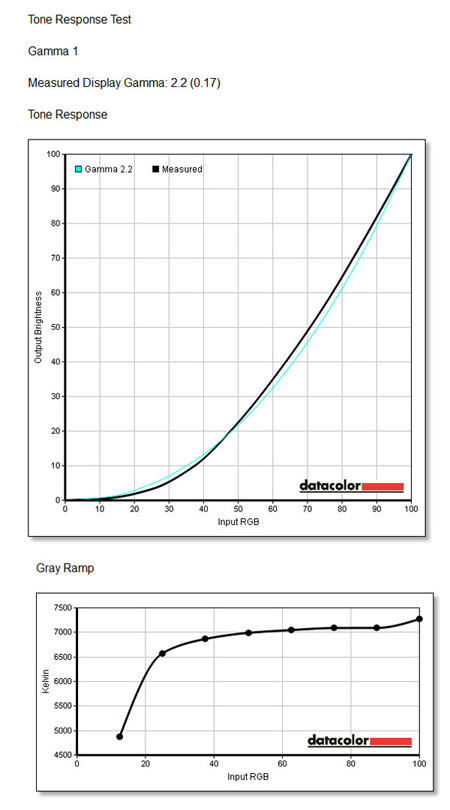
From here, you can perform the Gamut, Tone Response (gamma), Brightness and Contrast, White Point At Different OSD Settings, Screen Uniformity, and Color Accuracy tests seen in our laptop reviews. All results are displayed in a slick printable graphs or tables. These kinds of graphs make it easy to see just what your display is doing. Below are the results of the Tone Response (gamma) test performed on our AOC I2757FH.
Get Tom's Hardware's best news and in-depth reviews, straight to your inbox.
The upper Tone Response chart shows the reference in blue and the actual measurement in black. In the lower Gray Ramp graph, the color temp is plotted on the X axis and the signal level, in percent, on the Y axis. This is our AOC I2757FH again, and you can see it needs a bit of tweaking in the grayscale department and the white balance is running just a little towards blue. But we're getting a little ahead of ourselves, we'll explain what all that means next time, when we delve into the principles of color science behind calibration.
Current page: Spyder4Elite How-To: Wrapping Up
Prev Page Spyder4Elite How-To: Overview Next Page See How Easy Calibrating Your Display Can Be?
Christian Eberle is a Contributing Editor for Tom's Hardware US. He's a veteran reviewer of A/V equipment, specializing in monitors. Christian began his obsession with tech when he built his first PC in 1991, a 286 running DOS 3.0 at a blazing 12MHz. In 2006, he undertook training from the Imaging Science Foundation in video calibration and testing and thus started a passion for precise imaging that persists to this day. He is also a professional musician with a degree from the New England Conservatory as a classical bassoonist which he used to good effect as a performer with the West Point Army Band from 1987 to 2013. He enjoys watching movies and listening to high-end audio in his custom-built home theater and can be seen riding trails near his home on a race-ready ICE VTX recumbent trike. Christian enjoys the endless summer in Florida where he lives with his wife and Chihuahua and plays with orchestras around the state.
-
Someone Somewhere I've been doing this for years.Reply
However, I wouldn't recommend Colorvision - their support for open source software is pitiful.
It would be nice to have the option to calibrate the monitor instead of just using colour profiles though. It can get irritating to run the same test on multiple OSs or computers attached to the same monitor. -
envy14tpe Thank you so much for doing this article. I think calibrating a monitor (at home) is very important for accuracy.Reply
I use the Spyder Express 4 and love the results. There are 3 models of the Spyder 4 and buyers need to choose which is best for their use.
Would it be possible to make the images a larger file so people can see the difference more clearly? -
daglesj I have a Spyder 3 Pro.Reply
Great device when you first unbox it, then not so good when you find the colours and visuals look far worse after you finish with odd tinges and hues.
Then you read up and find the the devices are not actually calibrated and set properly when they leave the factory.
Pretty useless. I wouldn't buy another spyder. Look elsewhere for proper results. -
Traciatim I've been looking at picking up a calibration tool set for a while so I liked reading this article. My question though is that I want to use my setup to calibrate TV's for friends, Monitors, Laptops, multi monitor setups, TV's with PCs and Multiple other devices attached . . . I was looking at getting the Spyder4 Elite and the TV HD upgrade but it seems like if I calibrate a TV with a PC attached using the TV HD version and then try to do the PC with the software then is that going to mess up the previous settings?Reply
If anyone has any experience with these tools in multi-use and multi-display scenarios or has a better option on what tools to get I would really appreciate any info.
-
WyomingKnott "All modern fixed-pixel displays create images in RGB format." Sharp states that their Aquos line has a yellow sub-pixel. It might be interesting to compare one of their TVs to a similar RGB panel.Reply -
Someone Somewhere None of the connections allow it to receive data with a yellow channel though, so it's all interpolated in the display.Reply -
ddpruitt Great article, I always try to do this with monitors and displays. Most are set up so horribly out of the box and people always use what feels good instead of what's right. I have never used a color calibrator because there's so little factual information. I'll probably ending getting one of these now.Reply -
ojas I wish you could cover some free/open source software, $249 is still a bit much for some like me...plus exchange rate is getting painful these days :(Reply


