Almost 20 TB (Or $50,000) Of SSD DC S3700 Drives, Benchmarked
We've already reviewed Intel's SSD DC S3700 and determined it to be a fast, consistent performer. But what happens when we take two-dozen (or about $50,000) worth of them and create a massive RAID 0 array? Come along as we play around in storage heaven.
Results: Server Profile Testing
Workload Profiles
For as long as programs to exercise I/O activity have existed, professionals have sought to emulate specific workloads with them. We put our SSD DC S3700s through their paces with a handful of tasks based on basic enterprise-style I/O patterns
| Workload Profiles | ||
|---|---|---|
| Web Server | 100% Read / 0% Write | 0.5 KB 22%, 1 KB 15%, 2 KB 8%, 4 KB 23%, 8 KB 15%, 16 KB 2%, 32 KB 6%, 64 KB 7%, 128 KB 1%, 512 KB 1% |
| Database | 67% Read / 33% Write | 100% 8 KB |
| MS Exchange Server Emulation | 62% Read /38% Write | 100% 32 KB |
| File Server | 80% Read /20% Write | 0.5 KB 10%, 1 KB 5%, 2 KB 5%, 4 KB 60%, 8 KB 2%, 16 KB 4%, 32 KB 4%, 64 KB 10% |
Web Server Workload Profile
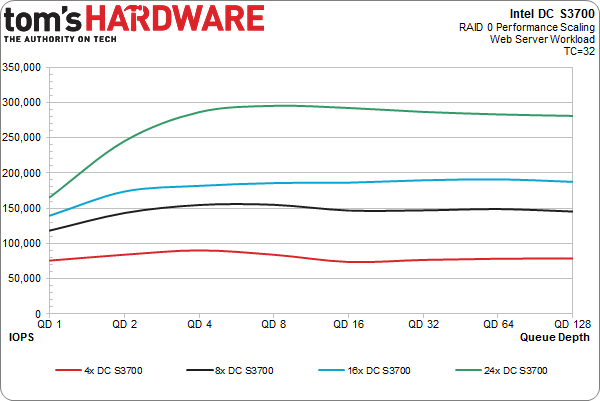
The Web server profile is fairly complex, consisting of eight different transfer sizes. Though dominated by .5 KB, 4 KB, and 8 KB transfers, there are several other sizes in the mix too. This profile involves 100% reads, but our SSD DC S3700-based arrays are almost equally strong when it comes to random writes.
Scaling appears identical to what we saw previously as drives are added. Again, performance doubles from the four- to eight-drive arrays, while the 24x configuration is a bit over 100% compared to the 8x setup. We could serve quite a few webpages with two dozen SSD DC S3700s.
Database Workload Profile
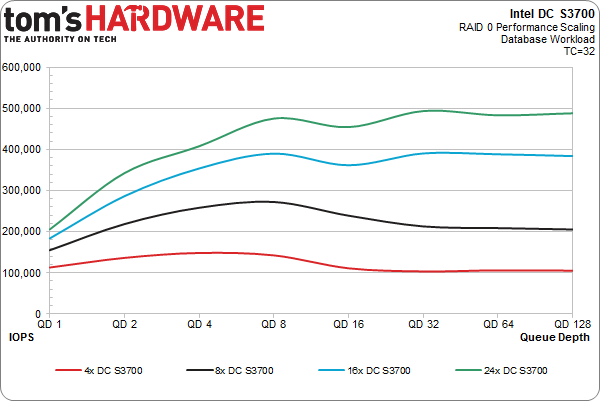
The database workload is super simple. It's just an 8 KB transfer size split between 67% reads and 33% writes.
Get Tom's Hardware's best news and in-depth reviews, straight to your inbox.
The 24x array just touches the 500,000 IOPS mark. That's hardly surprising, since we should see almost exactly half of the I/O every second with two times the 4 KB transfer size. Since both the 4 KB read and write tests yield close to 1 million IOPS, 500,000 IOPS in the database profile is expected. Bandwidth is just IOPS multiplied by transfer size, so it stays essentially the same in all of these tests.
MS Exchange Workload Profile
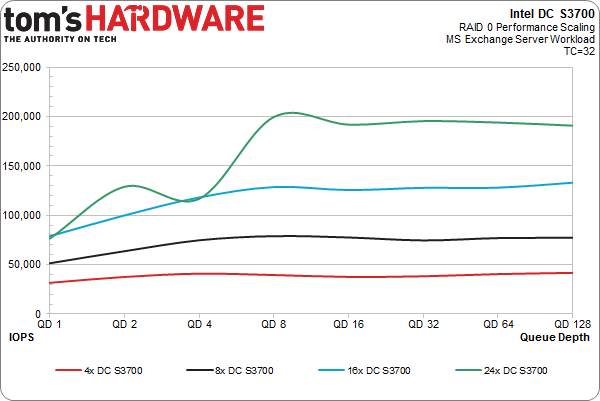
Most traditional Iometer-style email server workloads are perfectly adequate. Just to mix things up, we're emulating MS Exchange mailbox activity with 32 KB blocks split between 62% reads and 38% writes.
These are really the first results we can't adequately explain. Run after run, we're touching 200,000 IOPS with our 24x array. That wouldn't be so strange, except 200,000 IOPS is a monumental 6.25 GB/s. The 3 TB array consisting of four SSD DC S3700s maintains 40,000 IOPS, regardless of queue depth. At over 1,200 MB/s of throughput, those are totally consistent results. We double that with eight drives and quadruple it with twenty-four. Perhaps we've found the perfect storm of settings? Since the outcome seems too good to be true, take these results with a grain of salt.
File Server Workload Profile
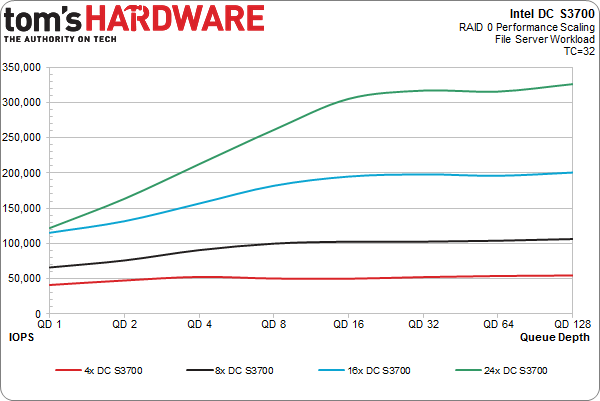
The file server profile is almost as complex as the Web server profile, except 20% of the transactions are writes and the majority of accesses are 4 KB. It's not a terrible representation of an average consumer/client workload, either.
On average, each I/O is worth approximately 11 KB of throughput.
The scaling is absolutely smooth and beautiful as more SSD DC S3700s are added to the mix. From 50,000 IOPS with the four-disk array up to 325,000 with the 24x arrangement, performance increases linearly with both drive count and workload intensity.
Current page: Results: Server Profile Testing
Prev Page Results: 128 KB Sequential Performance Scaling In RAID 0 Next Page Results: Going For Broke-
sodaant Those graphs should be labeled IOPS, there's no way you are getting a terabyte per second of throughput.Reply -
cryan mayankleoboy1IIRC, Intel has enabled TRIM for RAID 0 setups. Doesnt that work here too?Reply
Intel has implemented TRIM in RAID, but you need to be using TRIM-enabled SSDs attached to their 7 series motherboards. Then, you have to be using Intel's latest 11.x RST drivers. If you're feeling frisky, you can update most recent motherboards with UEFI ROMs injected with the proper OROMs for some black market TRIM. Works like a charm.
In this case, we used host bus adapters, not Intel onboard PHYs, so Intel's TRIM in RAID doesn't really apply here.
Regards,
Christopher Ryan -
cryan DarkSableIdbuaha.I want.Reply
And I want it back! Intel needed the drives back, so off they went. I can't say I blame them since 24 800GB S3700s is basically the entire GDP of Canada.
techcuriousI like the 3D graphs..
Thanks! I think they complement the line charts and bar charts well. That, and they look pretty bitchin'.
Regards,
Christopher Ryan
-
utroz That sucks about your backplanes holding you back, and yes trying to do it with regular breakout cables and power cables would have been a total nightmare, possible only if you made special holding racks for the drives and had multiple power suppy units to have enough sata power connectors. (unless you used the dreaded y-connectors that are know to be iffy and are not commercial grade) I still would have been interested in someone doing that if someone is crazy enough to do it just for testing purposes to see how much the backplanes are holding performance back... But thanks for all the hard work, this type of benching is by no means easy. I remember doing my first Raid with Iwill 2 port ATA-66 Raid controller with 4 30GB 7200RPM drives and it hit the limits of PCI at 133MB/sec. I tried Raid 0, 1, and 0+1. You had to have all the same exact drives or it would be slower than single drives. The thing took forever to build the arrays and if you shut off the computer wrong it would cause huge issues in raid 0... Fun times...Reply


