System Builder Marathon, March 2010: System Value Compared
Power And Efficiency
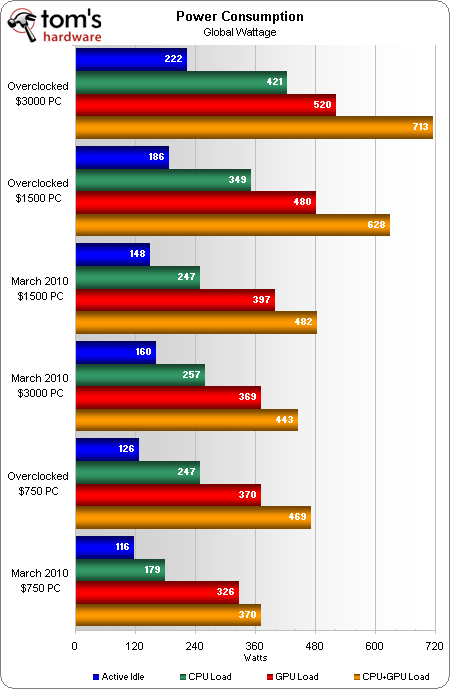
While power differences are significant, we really expected even larger differences between the overclocked/overvolted $3,000 system and the stock-voltage overclocked $1,500 build. Given its far lower performance, the $750 system’s efficiency is already starting to look a little weak.
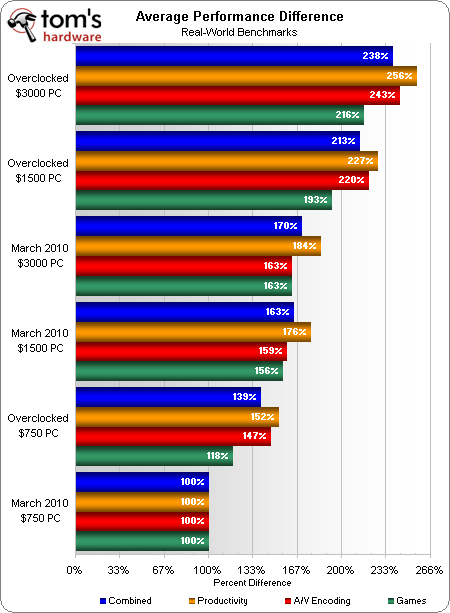
Putting the performance differences into numbers gives us perspective, while also allowing us to further calculate efficiency.
All three machines were built for overclocking and the overclocked $3,000 PC leads the overclocked $750 PC by an impressive 71% (238% ÷ 139%, above). Those with high expectations and less cash might instead find the overclocked $1,500 system’s 53% gain acceptable.
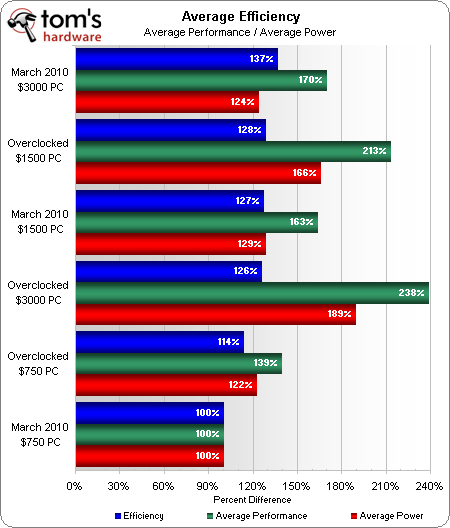
Efficiency is determined by dividing average performance by average power consumption, using the slowest configuration as the baseline.
With 70% higher performance than the slowest configuration while consuming 24% more power, the stock-speed $3,000 machine leads our efficiency chart. Thanks to its use of stock CPU core voltage in overclocking, the $1,500 PC gains 1% in efficiency at the higher speed. Another impressive efficiency increase is the $750 overclocked configuration, as enabling its fourth core improved performance significantly at a marginal power consumption increase.
Current page: Power And Efficiency
Prev Page Benchmark Results: SiSoftware Sandra Next Page The Harder They FallGet Tom's Hardware's best news and in-depth reviews, straight to your inbox.
-
dirtmountain The performance of the $750 system is great for the price and i certainly agree with your statement "Yet the real winner is not the machine but its builder, as Paul Henningsen achieved a best value coup with AMD’s low-cost, overclockable, and unlockable Athlon II X3 435 processor."Reply
A big +1 to Mr. Henningsen and the other builders. -
shubham1401 Wow!!Reply
Now I'm even more impressed with the Athlon II X3 435.
The 750$ Rig was the most impressive for me. -
skora Its nice to know "Go BIG or Go Home" can GO AWAY!!!Reply
Drop to a 500gb HDD and step up for the 1gb 4850s, and you have a very well balanced high power system with budget parts. Bravo Paul. Good showing Don and Tom. -
gkay09 I too agree that the credit should go to the builder - Mr. HenningsenReply
But I would say that it should also go to AMD for giving such a CPU...
Low-Mid segment, AMD still rules in terms of value and performance... -
Onus Outstanding results. I hope this helps kids who are building with Daddy's money understand that they don't need to waste it on a big edong. Furthermore, for all practical intents and purposes, FPS may be capped at 120Hz for 3D displays and 60Hz for the other 99.9+% of us, and higher framerates ignored in the value comparisons as not being a visible improvement. Unlocking being partly a matter of luck though, it does still support the value of a quad-core processor, even in a budget build.Reply
On the subject of AVG, I'd leave it in the benchmarks as a valid example of a program a lot of people use, making its results relevant even if they look a little odd.
-
axekick I built my first build last October using a very similar setup.Reply
Antec 300 Illusion (same case)
Gygabyte GA-MA790GPT-UD3H (same motherboard)
Western Digital Caviar Black WD5001AALS
G.Skill (2x2GB) DDR3 1333
AMD Phenom II X3 720
Sapphire Vapor-X Radeon HD 5750 (recently added)
Corsair 450VX
Samsung SH-S223B DVD Burner
At the time it cost slightly less, without OS and including the recently added Radeon HD 5750 totals $737.55
I have very similar benchmarks, slightly better actually and am very satisfied with the system. I have successfully unlocked the fourth core of the BE 720 and ran benchmarks after overclocking the processor and video card. It's an outstanding system for the price, more than I need. Actually I have locked back down the fourth core and do not keep it over-clocked as I don't do a lot of gaming. -
gilbertfh IMO both the $750 and $1500 systems perform extremely well for the cost. From the looks of it the $3000 pc would be more of a status symbol.Reply -
bustapr I hope u guys start selling PCs on Newegg. "THG SMB Gaming PCs", I would like to buy that $750 PC, already built at that price or similar. It would save me alot of trouble building and ordering parts and it will become an instant best seller. You guys can destroy cyberpower and alienware and others. Paul Henningson, you can get rich fast.Reply -
jeverson I'm just a little curious though about the S.T.A.L.K.E.R. results. It says that the benchmark is using DX11. The $750 system is being evaluated there but is using HD4xxx video cards. How are you getting results for DX11 for that build? Anyway, great job as always guys! Although, I would have to say that to me the winning PC would be the $1500 OC as it was capable of staring down the $3k box and not flinch. Of course, I also say it because I have a 24" monitor and the $750 rig just doesn't cut it there unfortunately. Lastly, in one of the articles you guys asked if you should go back to the old $500/$1k/$2k builds. I think you guys are now in the new "sweet spots" for PC now. $750-$800/$1200-$1500/$2500-Obscene are good ranges these days. Hmm... maybe the "Obscene" should be a forth "bonus" build ;)Reply


