Why you can trust Tom's Hardware
Comparison Products
Today we’re comparing the Vulcan to a few other SATA and entry-level NVMe SSDs. As SATA competitors, we include the WD Blue 3D, Samsung 860 EVO, and the Crucial MX500. And, for good measure, we threw in an Adata XPG SX8200 Pro, Crucial P1, and WD Blue SN500 M.2 NVMe SSDs, as well as a 6TB WD Black HDD.
Game Scene Loading - Final Fantasy XIV
The Final Fantasy XIV StormBlood benchmark is a free real-world game benchmark that easily and accurately compares game load times without the inaccuracy of using a stopwatch.
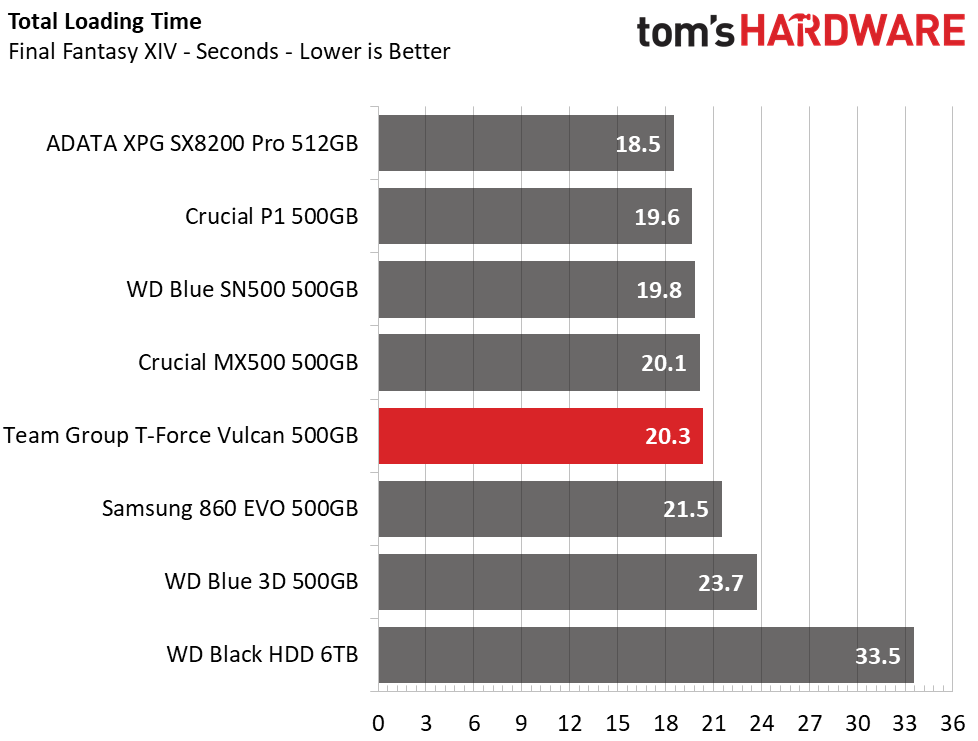
Team Group’s T-Force Vulcan did very well in this test. With a total load time score of 20.3 seconds, it is a split-second slower than the MX500, but faster than the Samsung 860 EVO. It ranks in 5th place overall. Opting for a faster NVMe SSD can help improve load time, but it is of less benefit doing so than going from an HDD to any SSD.
Transfer Rates – DiskBench
We use the DiskBench storage benchmarking tool to test file transfer performance with our own custom 50GB block of data. Our data set includes 31,227 files of various types, like pictures, PDFs, and videos. We copy the files to a new folder and then follow up with a reading test of a newly-written 6.5 GB file.
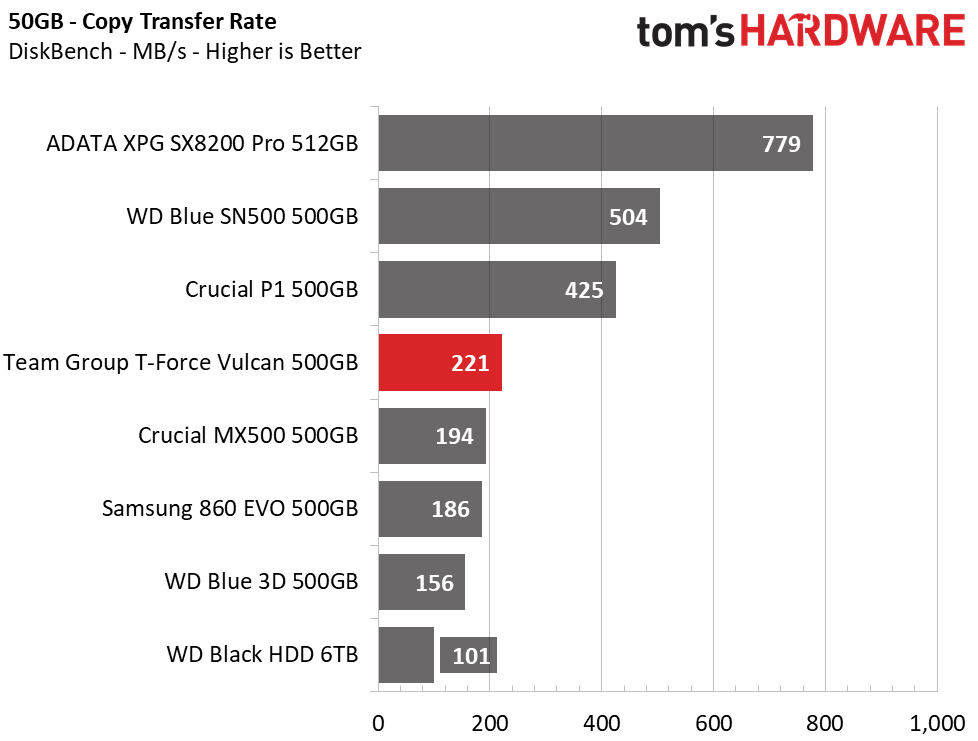
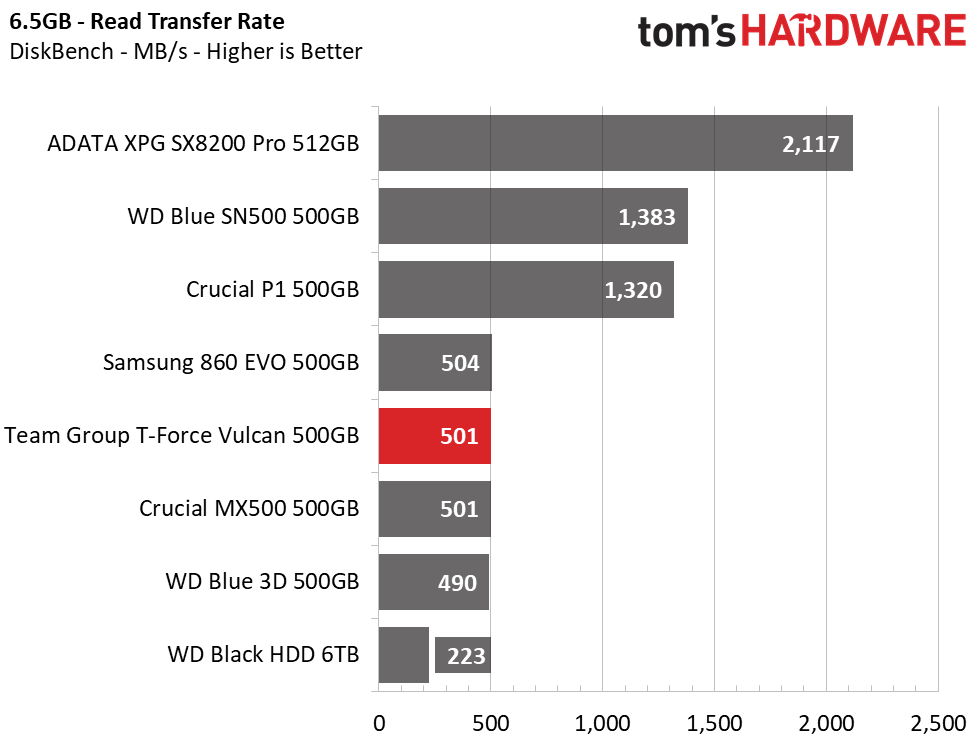
The Vulcan is the fastest SATA SSD in the bunch here. With a read rate of 501 MBps and a copy rate of 221 MBps, it delivers performance that is twice as fast as an HDD, but half the performance of entry-level NVMe SSDs when moving around files.
Trace Testing – PCMark 8 Storage Test 2.0
PCMark 8 is a trace-based benchmark that uses Microsoft Office, Adobe Creative Suite, World of Warcraft, and Battlefield 3 to measure the performance of storage devices in real-world scenarios.
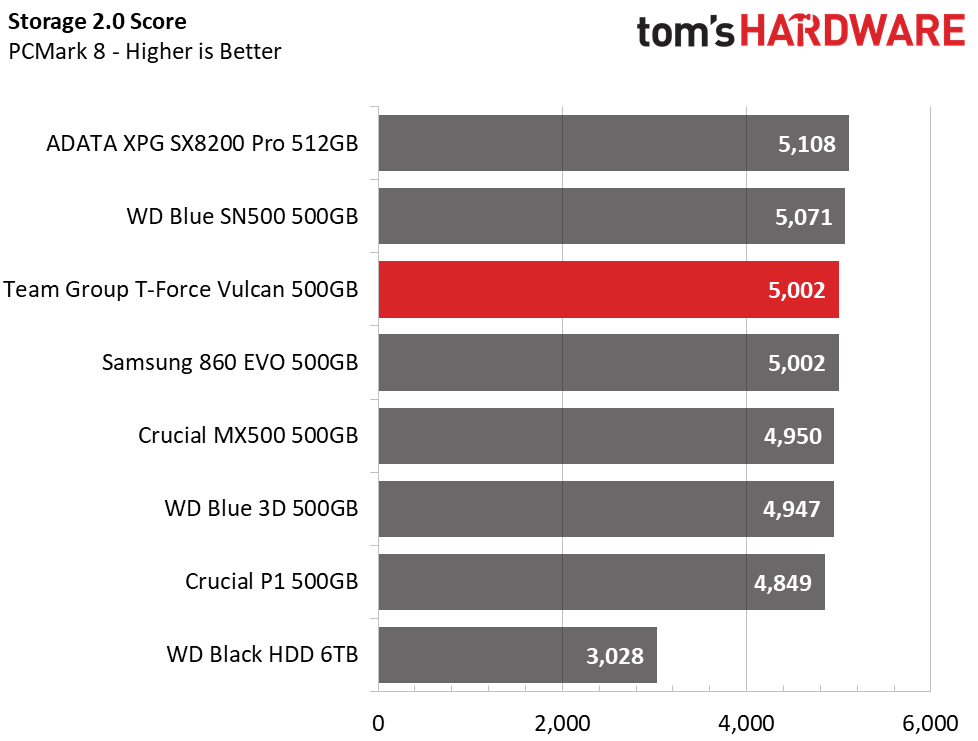
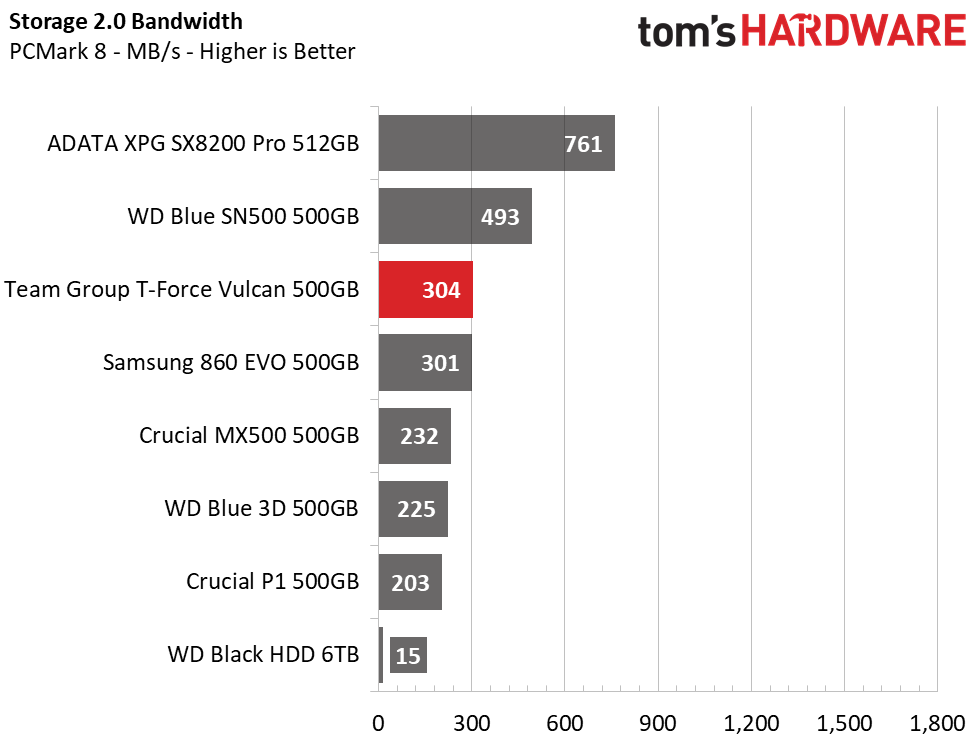
Team Group’s T-Force Vulcan scored extremely well in PCMark 8 as well. Surprisingly, it ties the Samsung 860 EVO and outclasses the Crucial MX500. It even outranked Crucial’s P1. But, most importantly, it absolutely destroyed the HDD’s result. With a total overall score of 5,002 points and an average bandwidth of 304 MBps, it ranks third overall.
Get Tom's Hardware's best news and in-depth reviews, straight to your inbox.
Trace Testing – SPECworkstation 3
Like PCMark 8, SPECworkstation 3 is a trace-based benchmark, but it is designed to push the system harder by measuring workstation performance in professional applications. The full suite consists of more than 30 workloads, but we've opted to only run the storage benchmark which uses only 15 of them and categorizes the results into 5 market segments for scoring: Media & Entertainment, Product Development, Life Sciences, Energy, and General Operations.
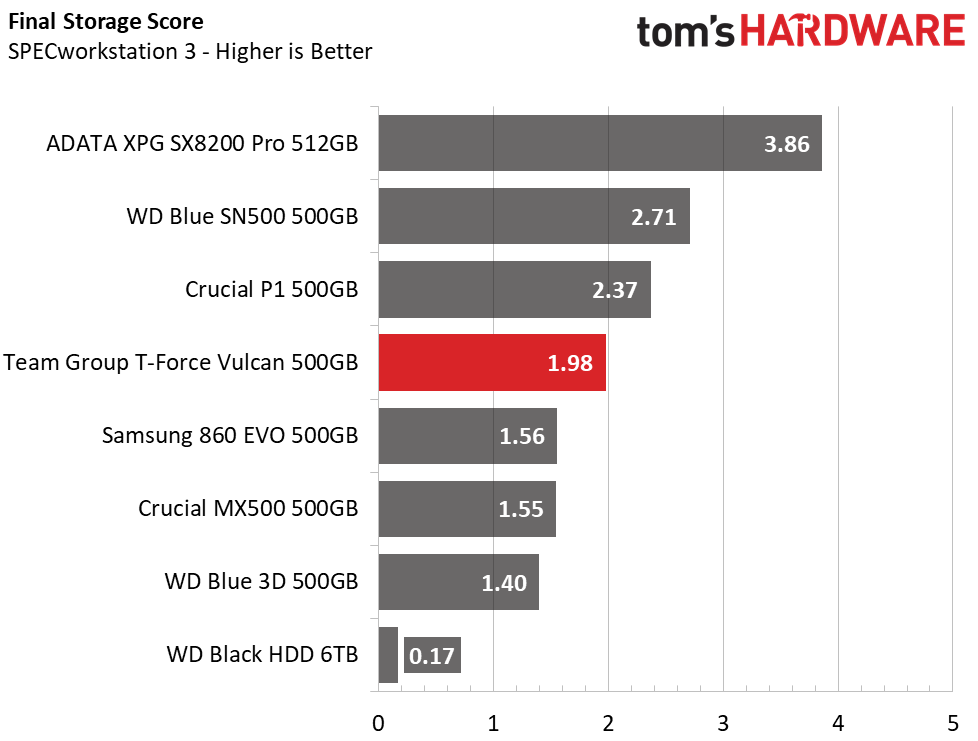
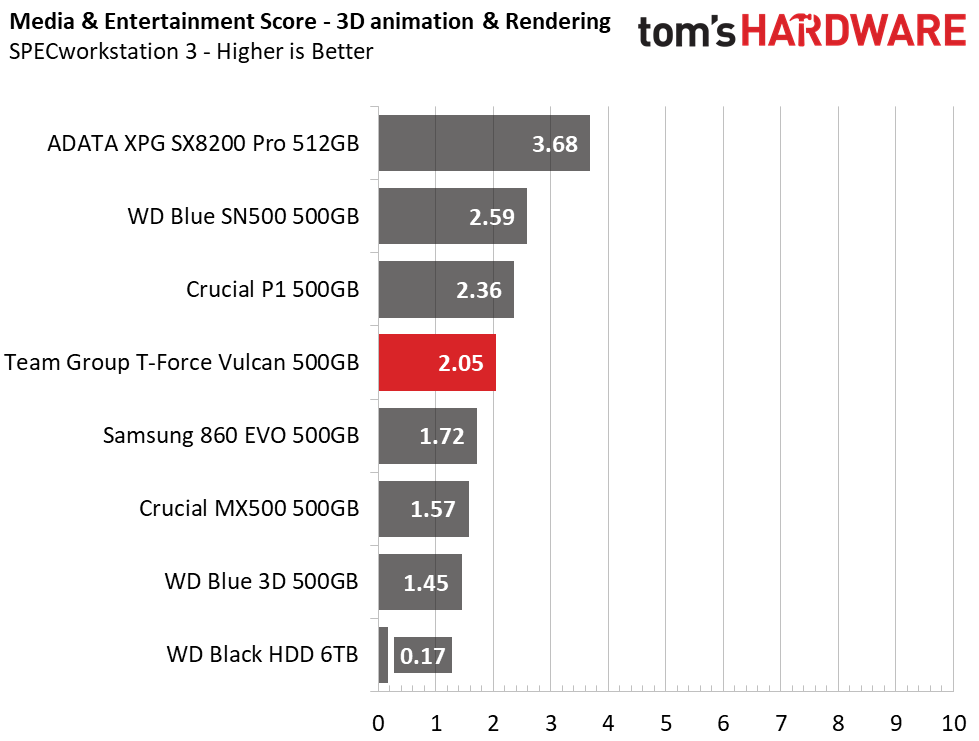
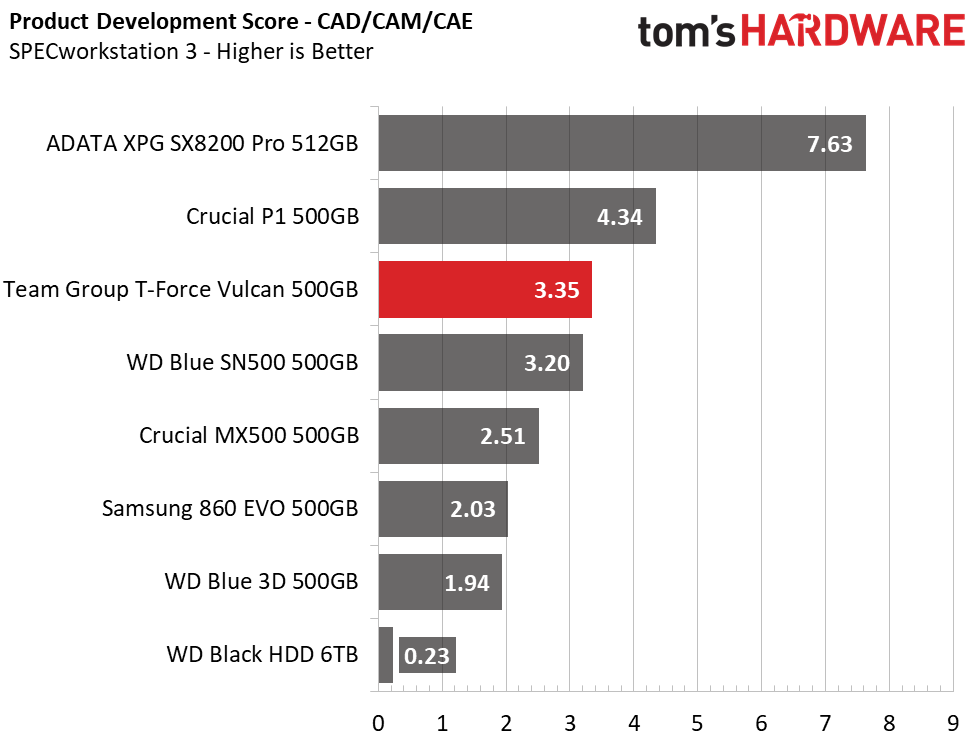
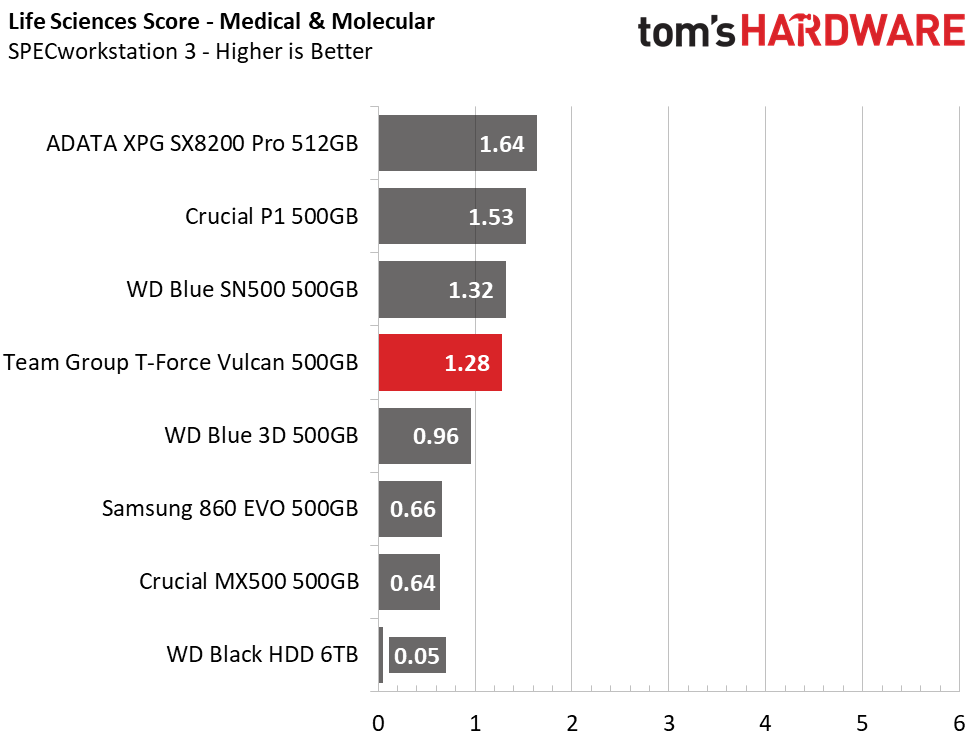
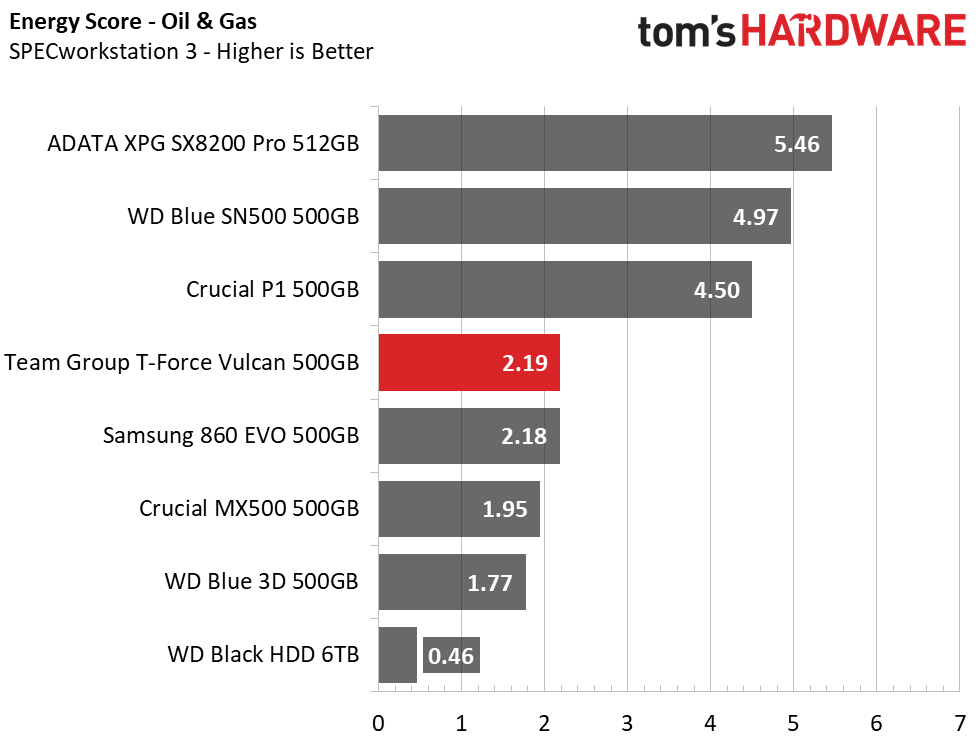
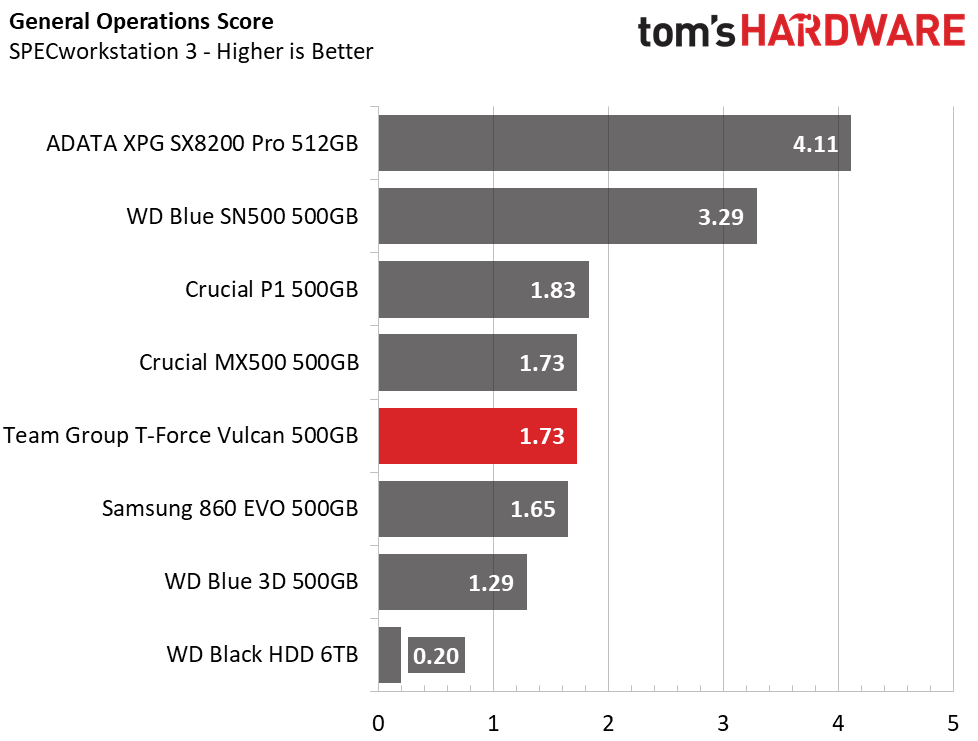
Once again, the T-Force Vulcan surprised us with a very impressive score that ranks it as the fastest SATA SSD on these charts. This time around though, Crucial’s P1 outranks it once again. An overall score of 1.98 places the Vulcan in fourth place overall.
Synthetic Testing - ATTO
ATTO is a simple and free application that SSD vendors commonly use to assign sequential performance specifications to their products. It also gives us insight into how the device handles different file sizes.
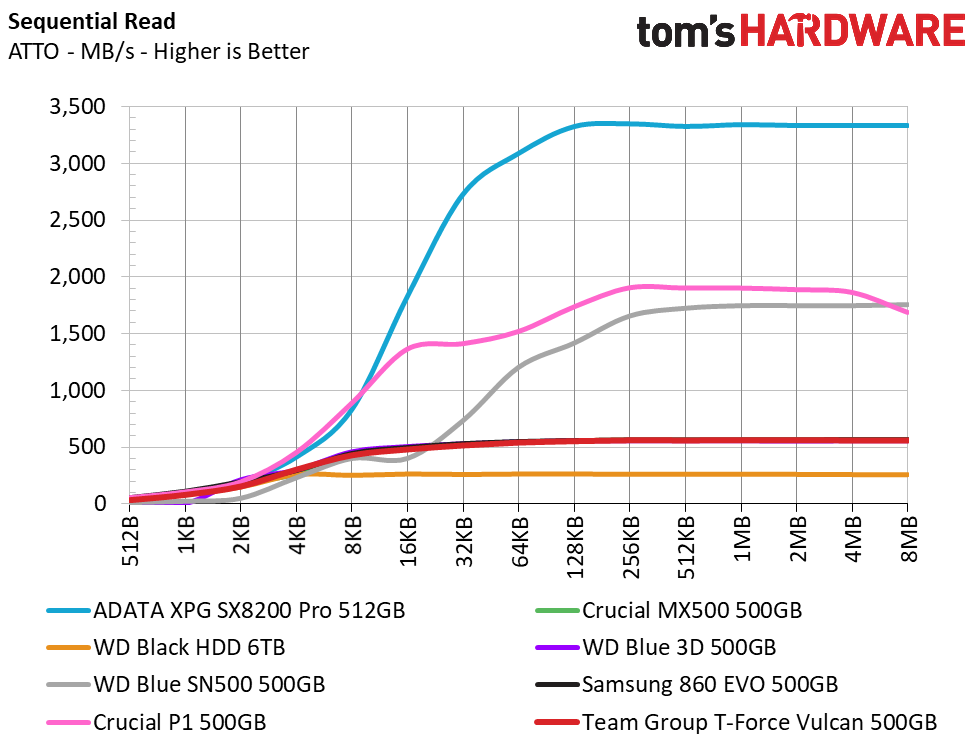
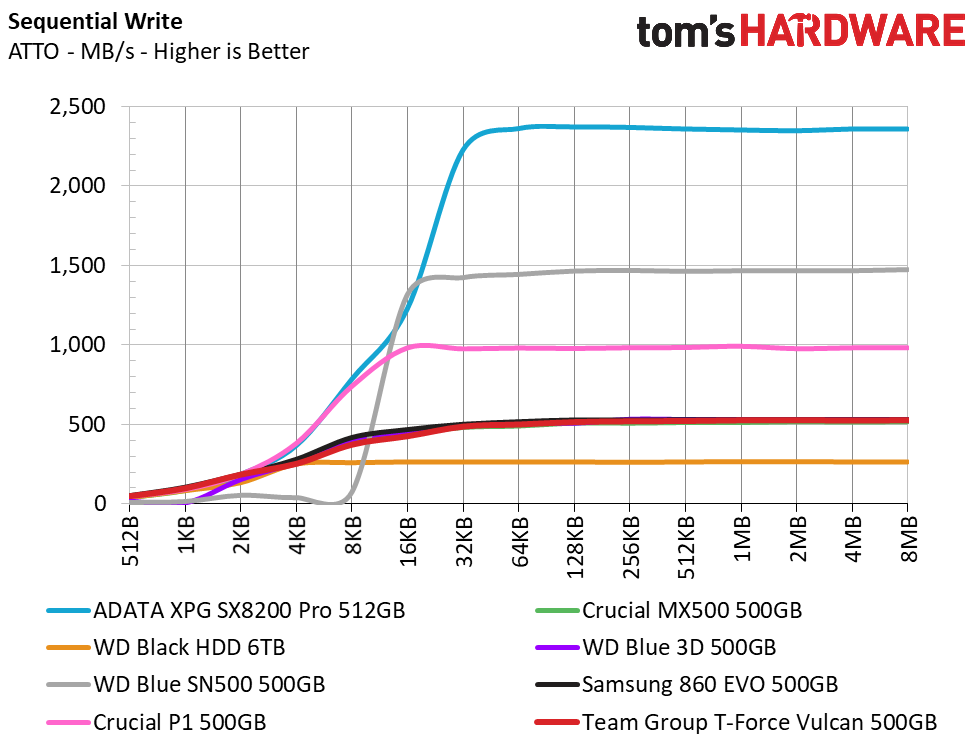
The Vulcan delivered average results for a SATA SSD here. Sequential speeds of 563 MBps read and 527 MBps were recorded. This pales in comparison to the kind of speed NVMe SSDs can provide, but that extra speed does usually come at a higher cost per GB.
Synthetic Testing - iometer
iometer is an advanced and highly configurable storage benchmarking tool that vendors often use to measure the performance of their devices.

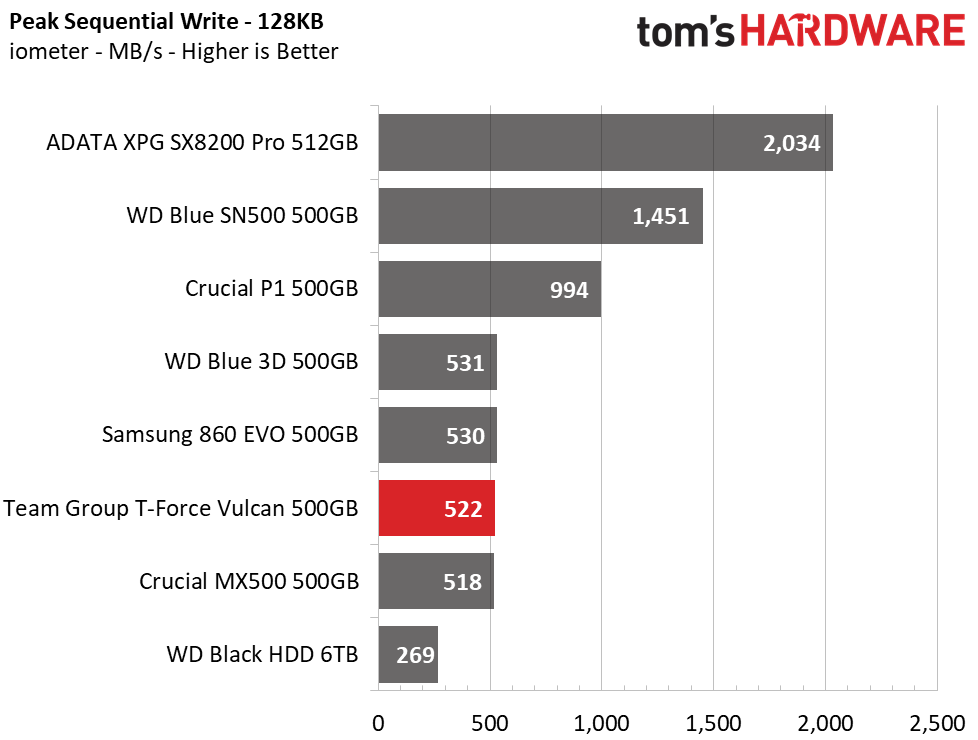
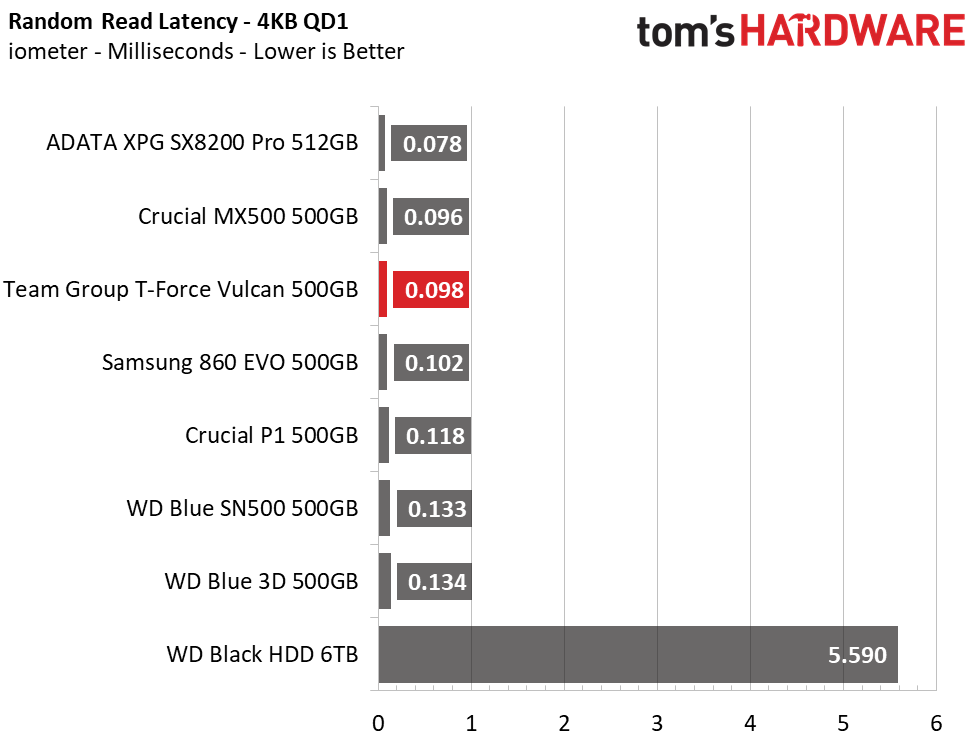
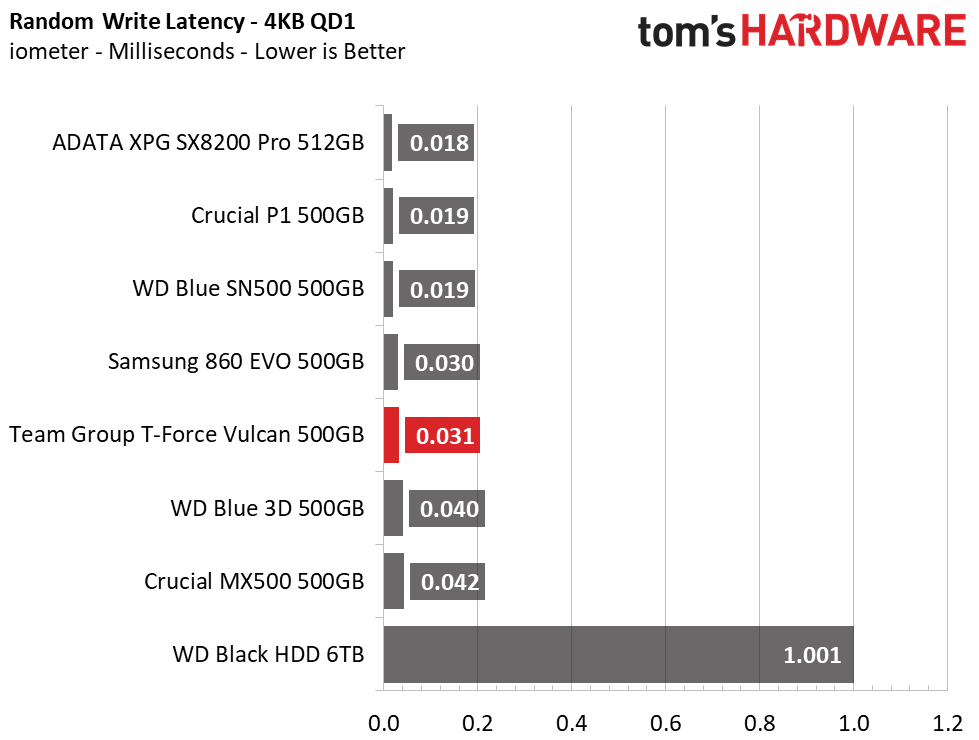
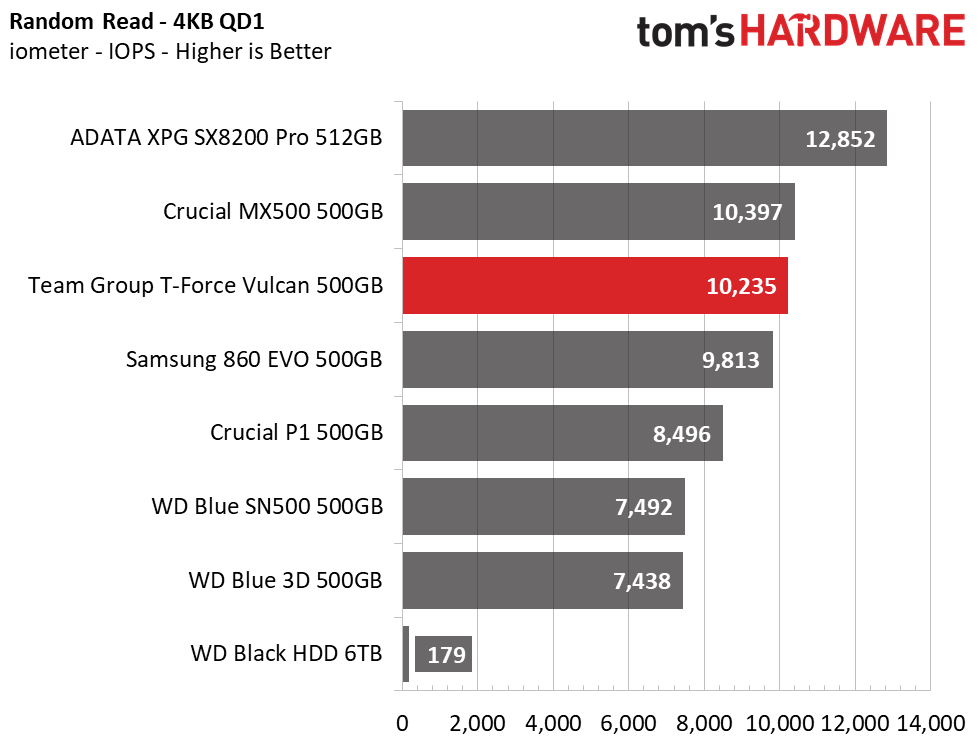
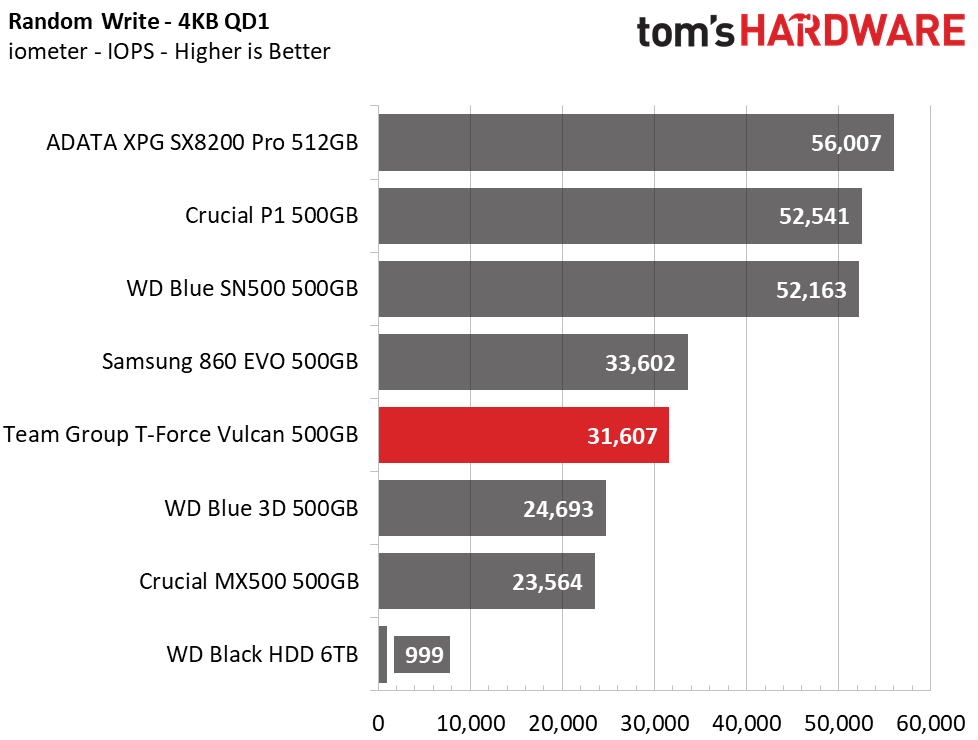
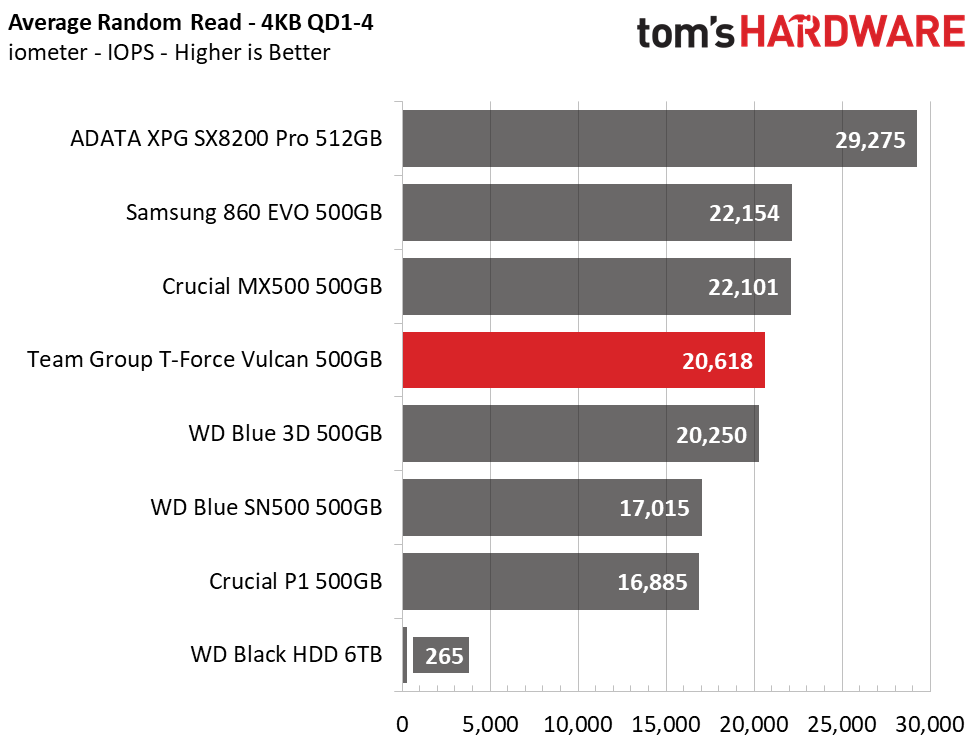
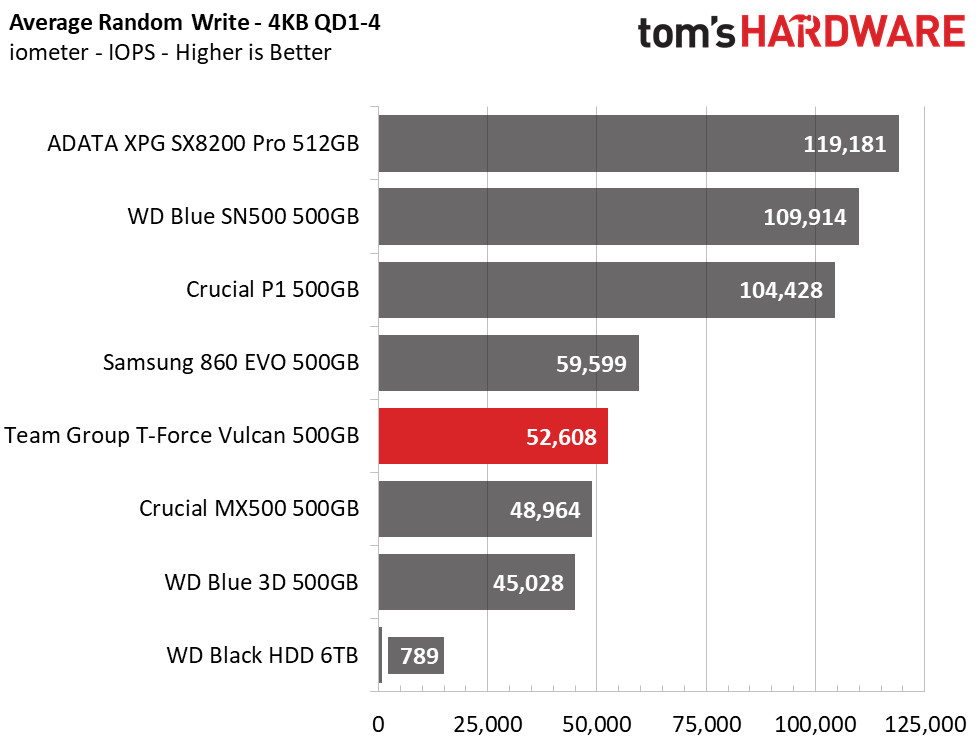
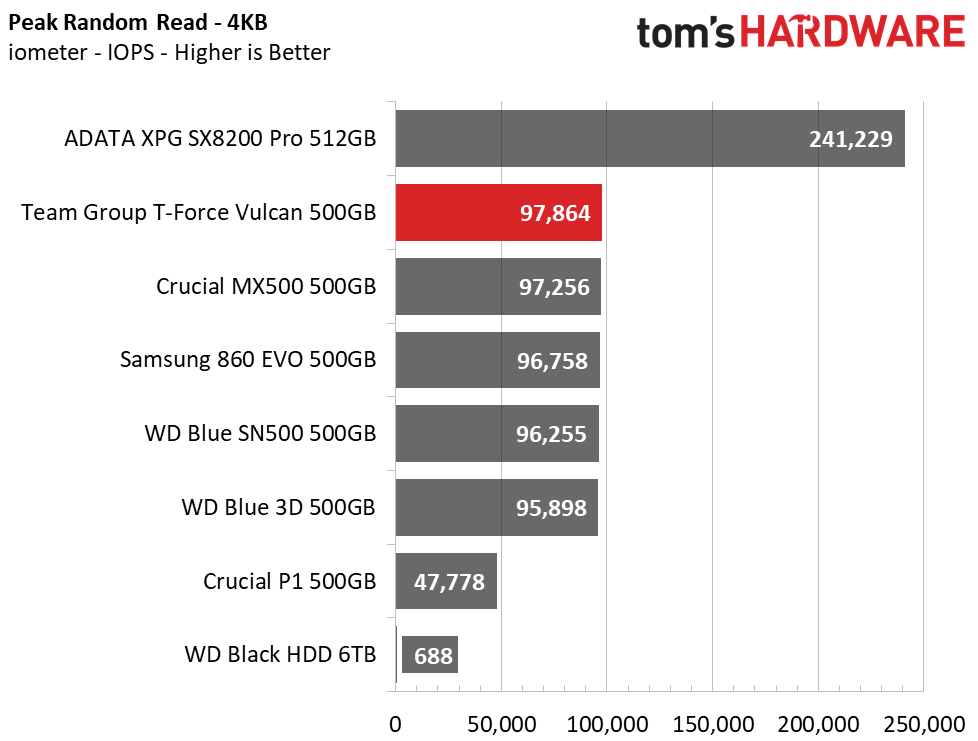
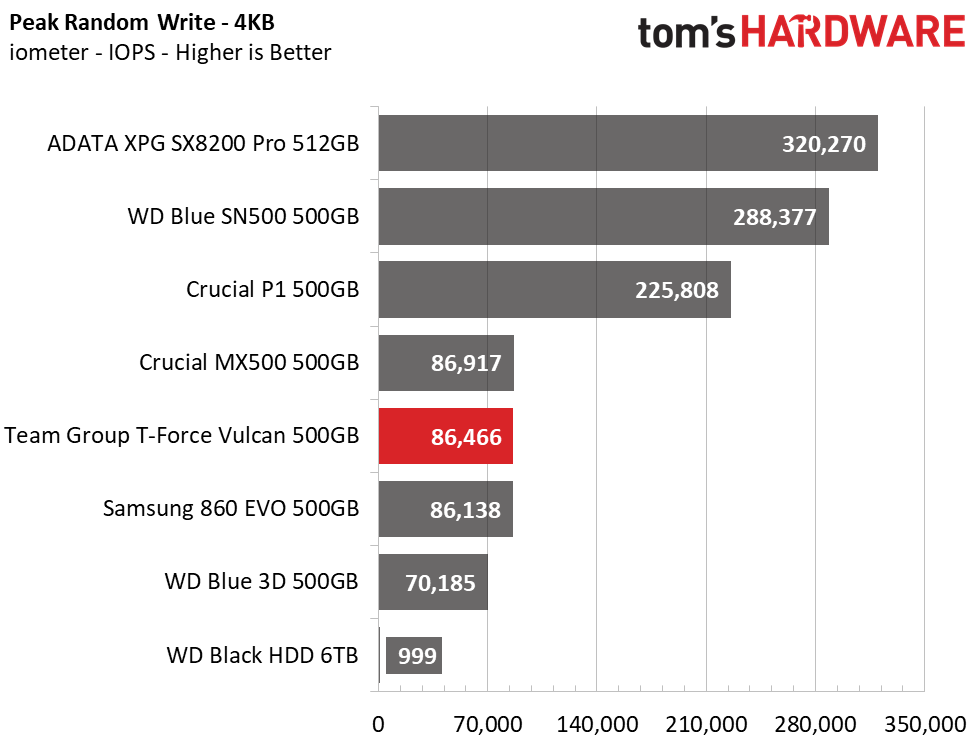
Like in ATTO, peak sequential performance comes in at ~560/520 MBps read/write. Random performance shows that the Vulcan is very responsive and even outranks the WD Blue SN500 and Crucial P1 at a QD of 1. Averaging the performance at QDs 1-4, it ranks fourth in read and fifth in write performance overall. Peak random performance comes in at 97,864/86,466 IOPS read/write.
Sustained Sequential Write Performance
Official write specifications are only part of the performance picture. Most SSD makers implement a pseudo-SLC cache buffer, which is a fast area of SLC-programmed flash that absorbs incoming data. Sustained write speeds can suffer tremendously once the workload spills outside of the pSLC cache and into the "native" TLC or QLC flash. We use iometer to hammer the SSD with sequential writes for 15 minutes to measure both the size of the pSLC buffer and performance after the buffer is saturated.
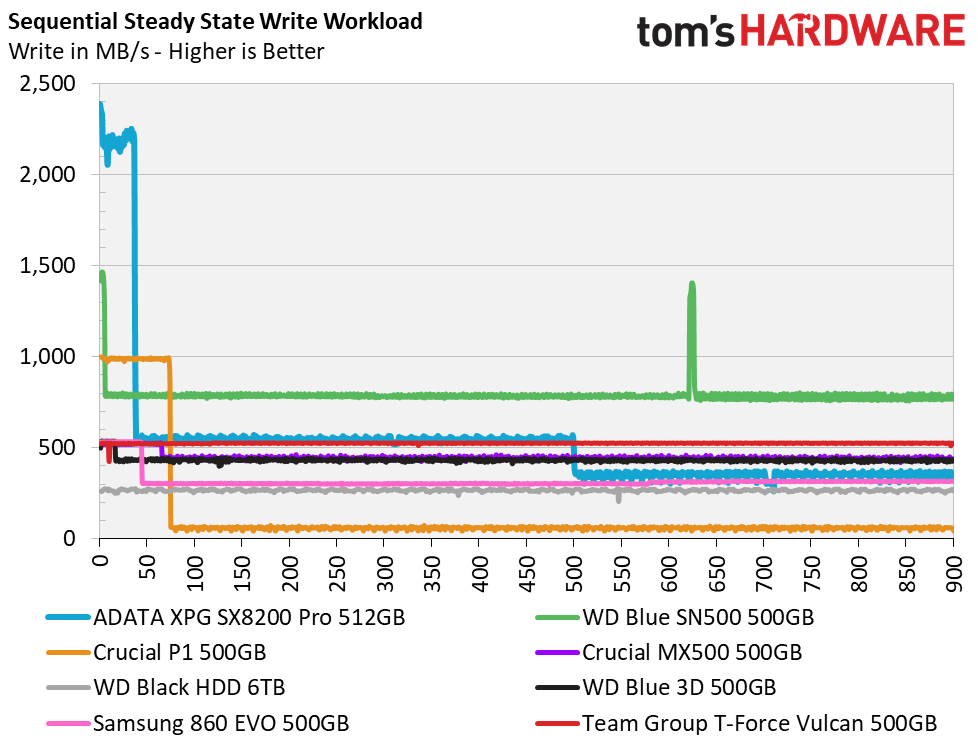
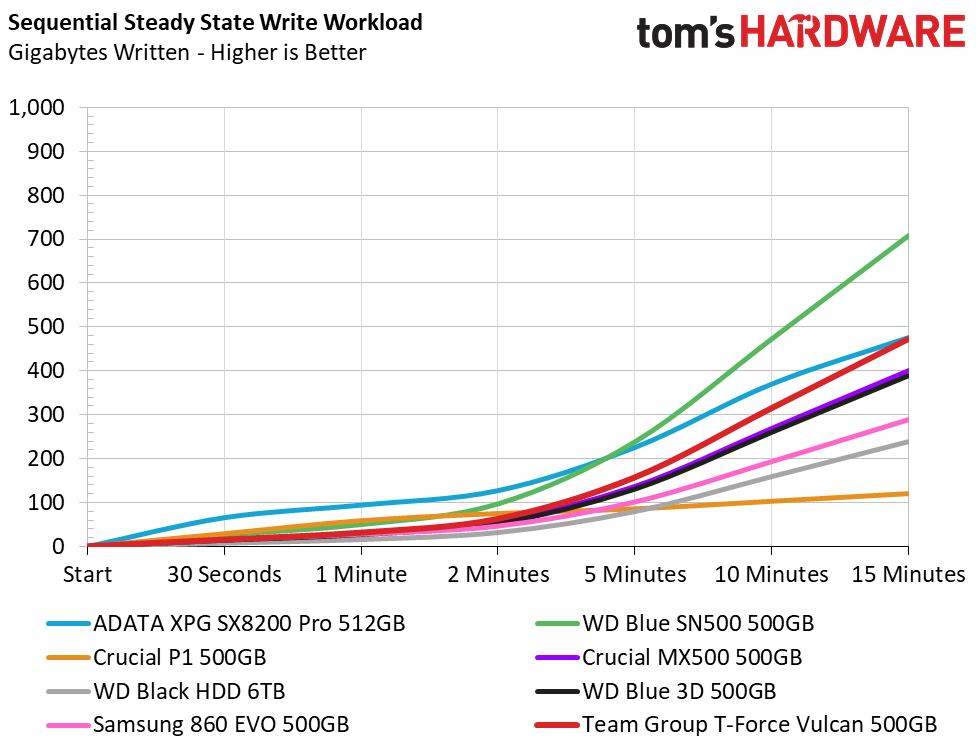
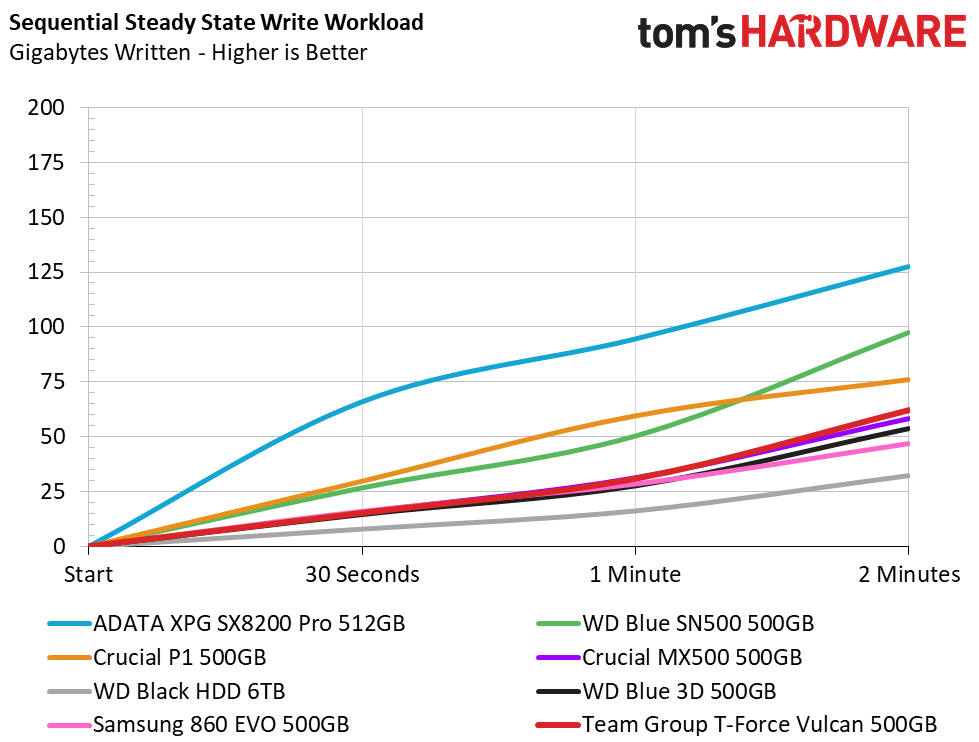
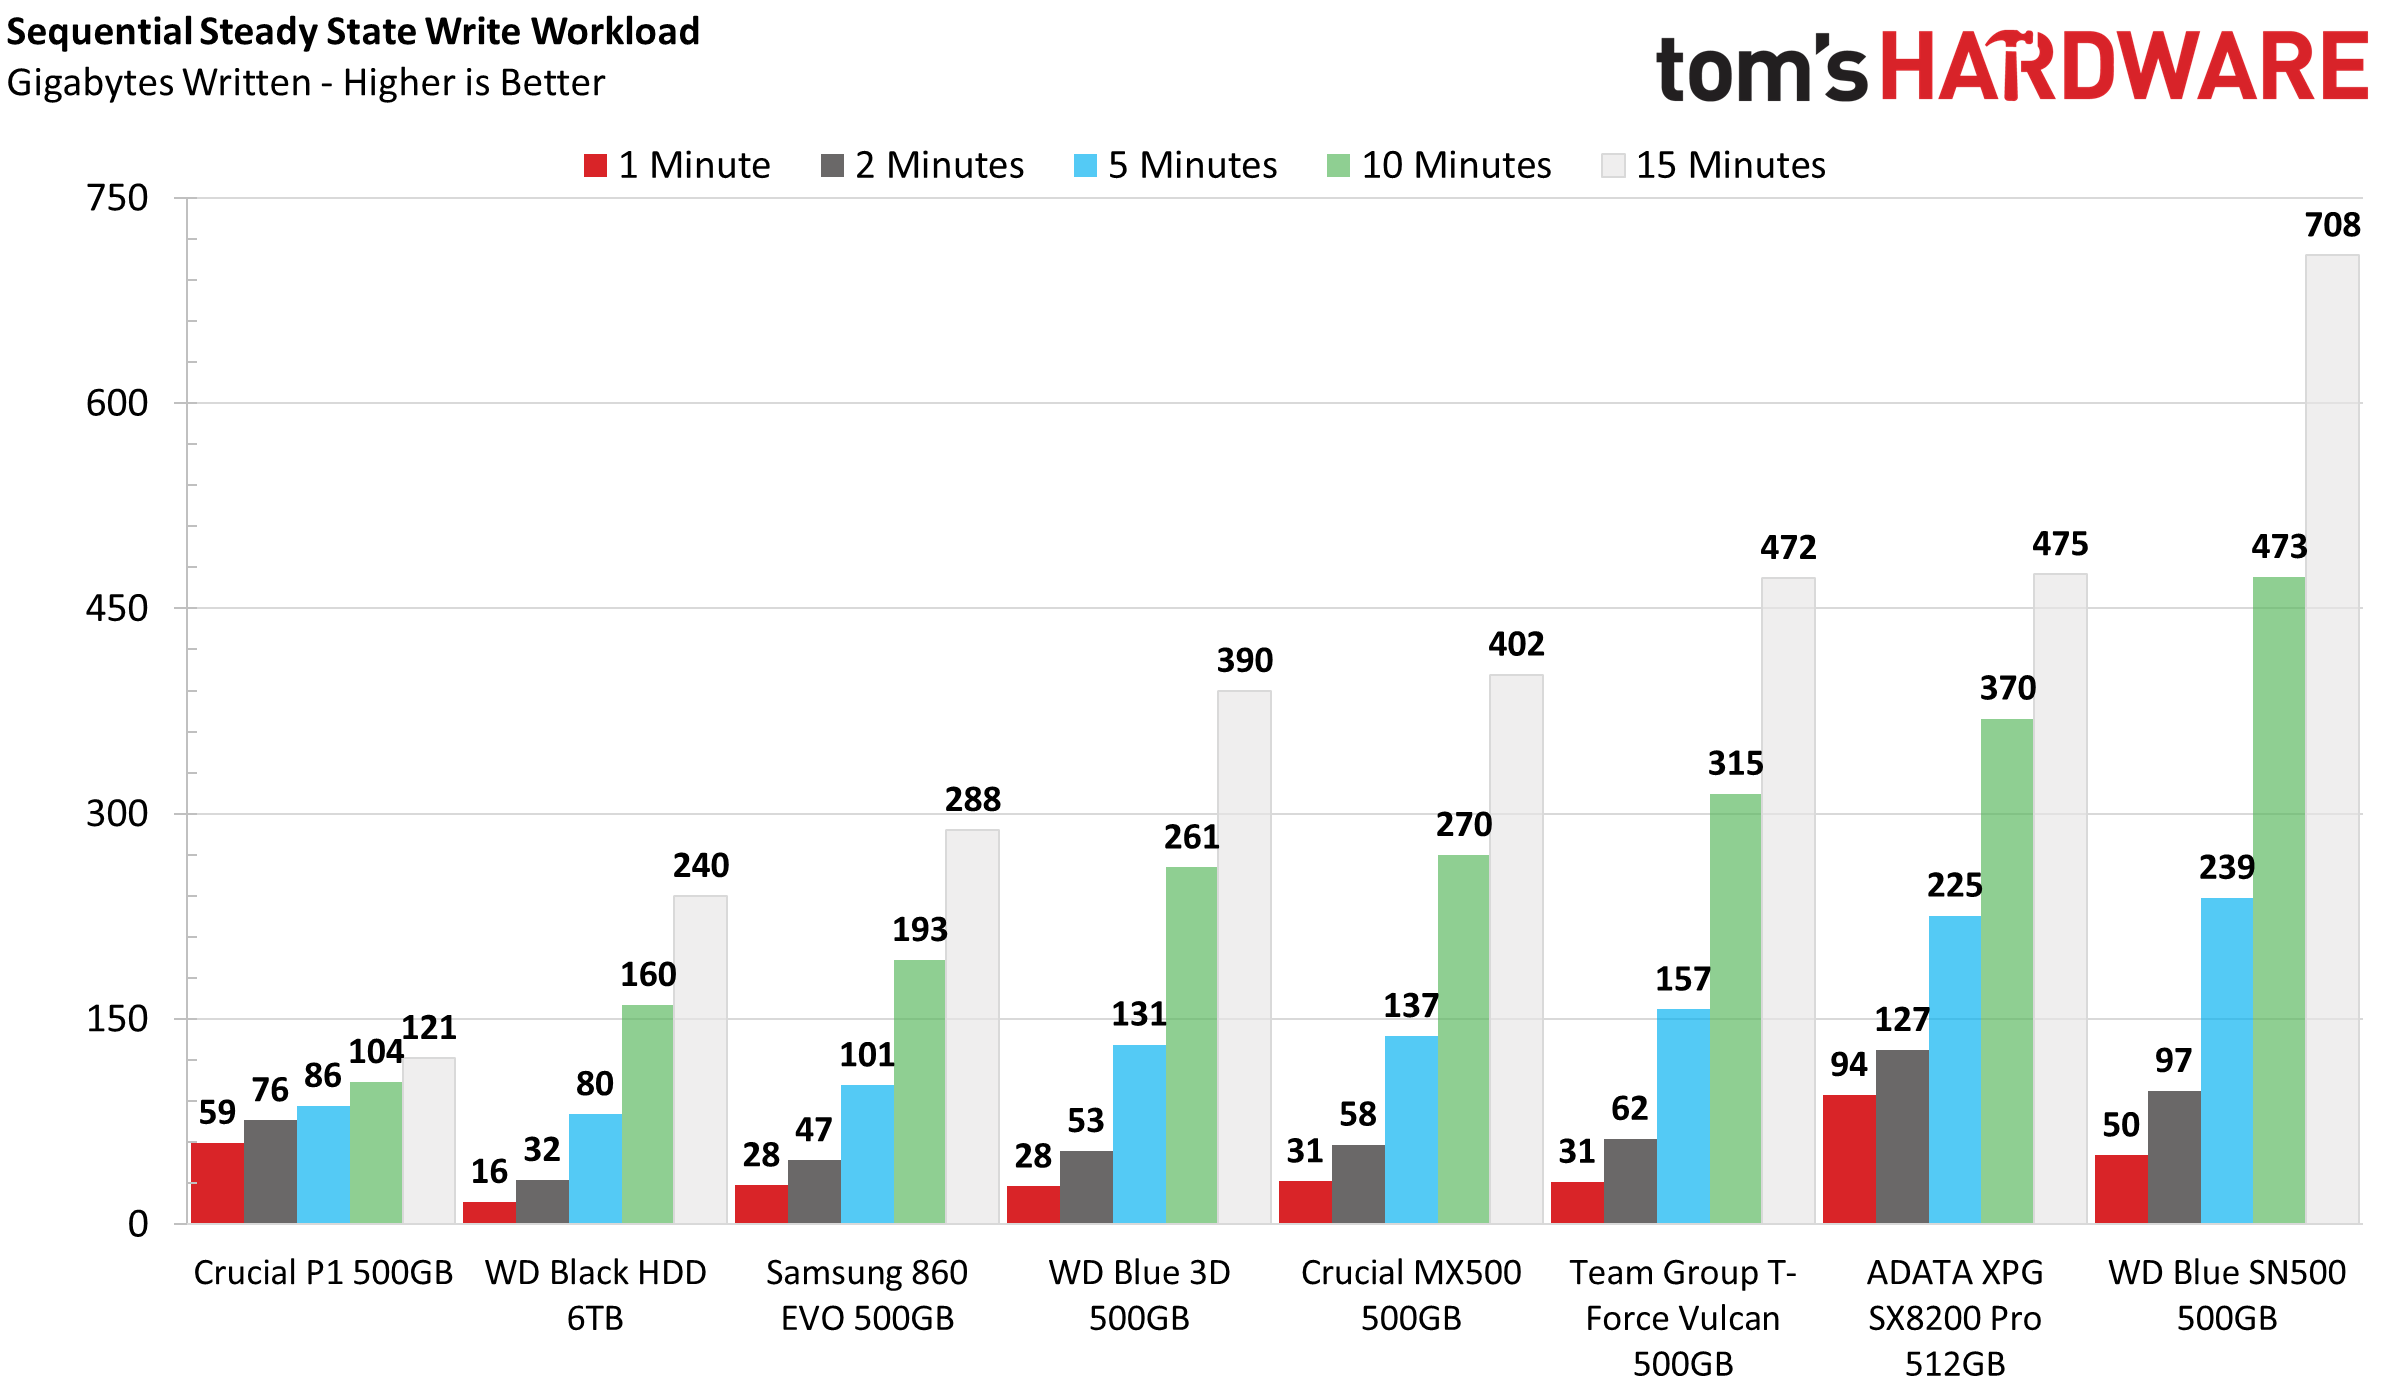
Sequential write performance is quite impressive on the T-Force Vulcan. It wrote at an average rate of 525 MBps, very consistently. It ranks third on overall in write performance. It managed to best some of the best SATA SSDs available and almost surpassed the Adata XPG SX8200 Pro. It may have if the test went on for a longer time.
Power Consumption
We use the Quarch HD Programmable Power Module to gain a deeper understanding of power characteristics. Idle power consumption is a very important aspect to consider, especially if you're looking for a new drive for your laptop.
Some SSDs can consume watts of power at idle while better-suited ones sip just milliwatts. Average workload power consumption and max consumption are two other aspects of power consumption, but performance-per-watt is more important. A drive might consume more power during any given workload, but accomplishing a task faster allows the drive to drop into an idle state faster, which ultimately saves power.
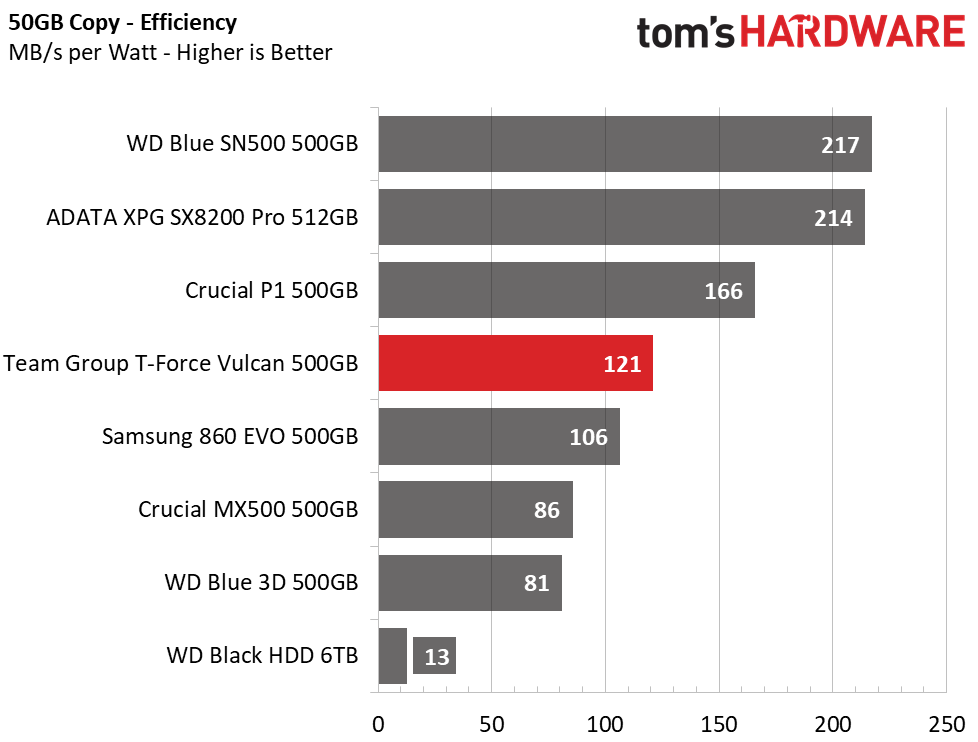
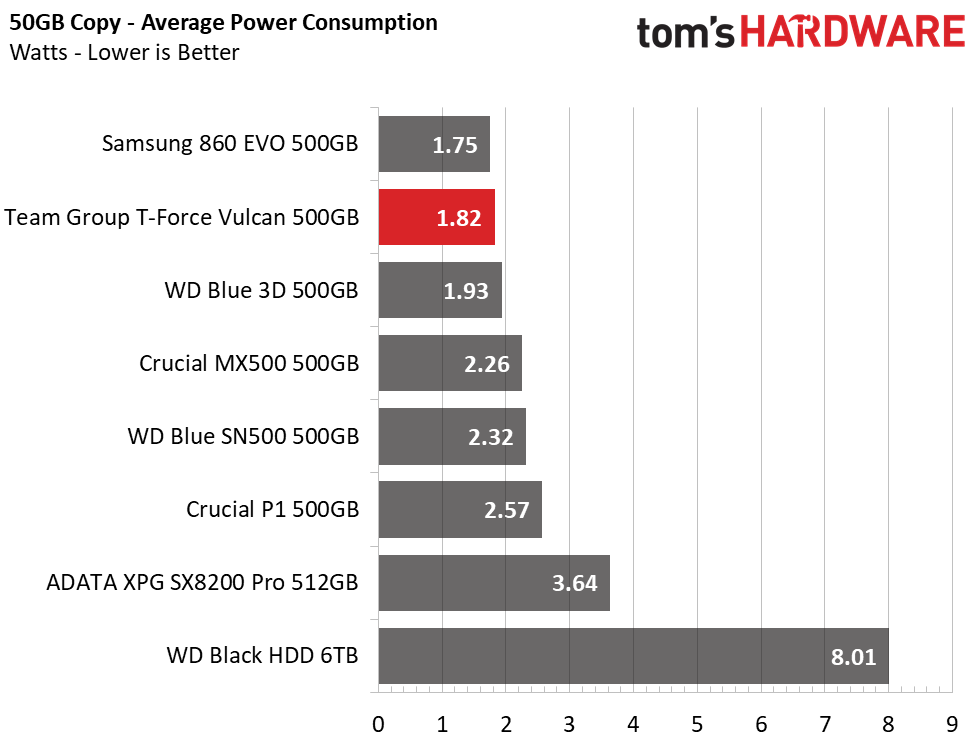
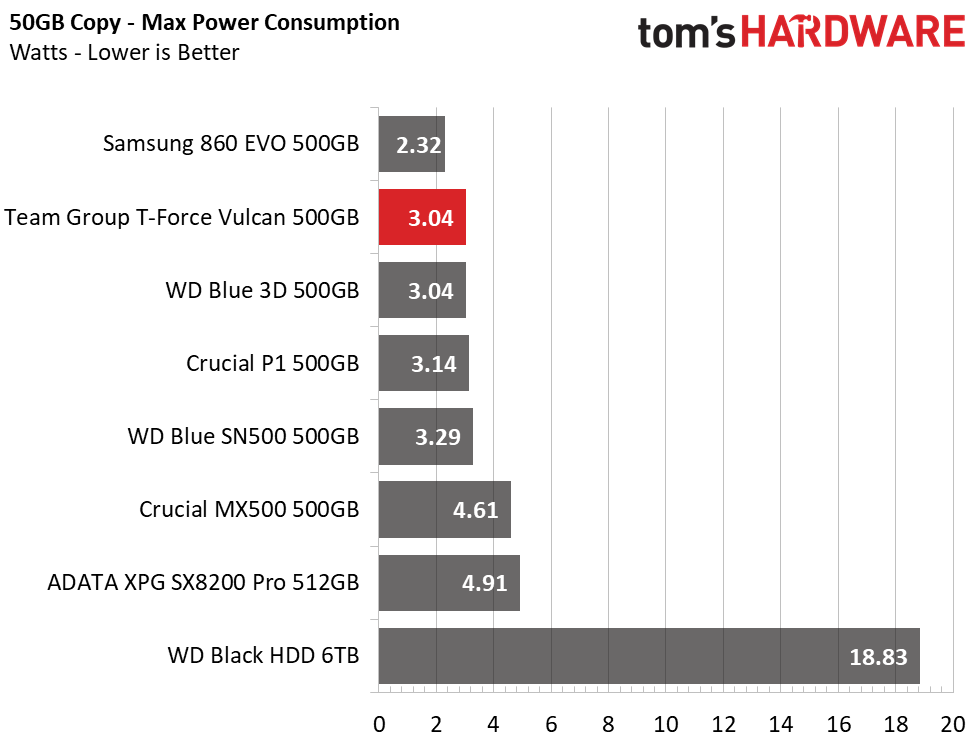
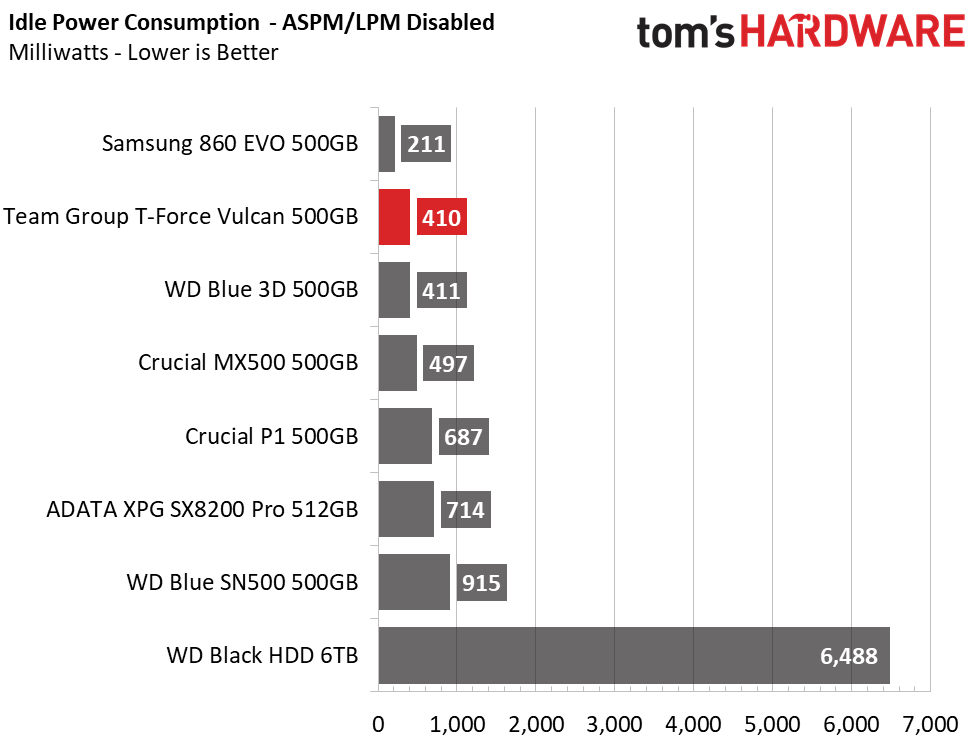
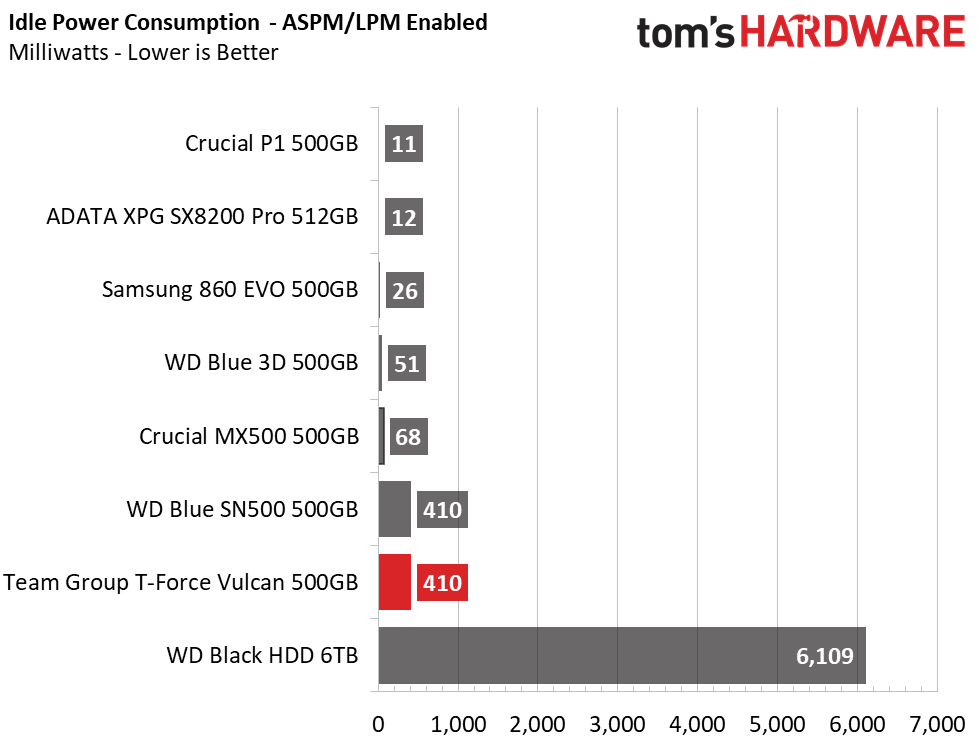
When copying files around, Team Group’s T-Force Vulcan is the most-efficient SATA SSD of this bunch. It ranks fourth overall, falling behind the Crucial P1. Average and maximum power consumption results are well regulated and actually lower than the MX500’s. Idle power consumption, however, doesn’t drop below 410mW, unlike other SATA SSDs that go down to as low as 26mW at idle.
MORE: Best SSDs
MORE: How We Test HDDs And SSDs
MORE: All SSD Content

Sean is a Contributing Editor at Tom’s Hardware US, covering storage hardware.
-
w_barath For 512GB drives, it doesn't appear to compare very favourably to the AData XPG8200, which in turn hasn't compared very favourably to the Silicon Power SU512GBP34A80M28AB in my own work machine.Reply
Tom's doesn't seem to do reviews / benchmarks of the Silicon Power drives though, curiously. When I see exclusions like this the question that comes to mind is "has SP failed to pay its shill dues to THG, or has THG some politically-influenced reason for not covering their products?" -
mdd1963 Gonna have to say at that price point $60/for 500 GB) I'd rather just pay $5 more for a Crucial MX500.....Reply -
cryoburner Reply
Um... A quick search reveals Tom's Hardware reviewed that drive, or at least the 1TB version, four months ago. >_>w_barath said:Tom's doesn't seem to do reviews / benchmarks of the Silicon Power drives though, curiously. When I see exclusions like this the question that comes to mind is "has SP failed to pay its shill dues to THG, or has THG some politically-influenced reason for not covering their products?"
https://www.tomshardware.com/reviews/silicon-power-p34a80-pcie-gen3x4-m-2-nvme-ssd,6180.html
It was a largely positive review, so Silicon Power clearly must have paid their shill dues. : D
If they don't review a particular drive, it might simply be because they weren't sent a sample to review by the manufacturer. It might also be that they don't have the resources to test every product they are sent, so they might focus on testing the ones that they feel do something unique or better than others they have previously tested, or that are expected to be a popular product due to their brand or other factors. -
Scour TeamGroup are stingy with details.Reply
Can anyone tell me how good the GX2 is? Completely different to the Vulcan or not?