Thermaltake Toughpower DPS G RGB 1500W PSU Review
Why you can trust Tom's Hardware
Cross-Load Tests And Infrared Images
Our cross-load tests are described in detail here.
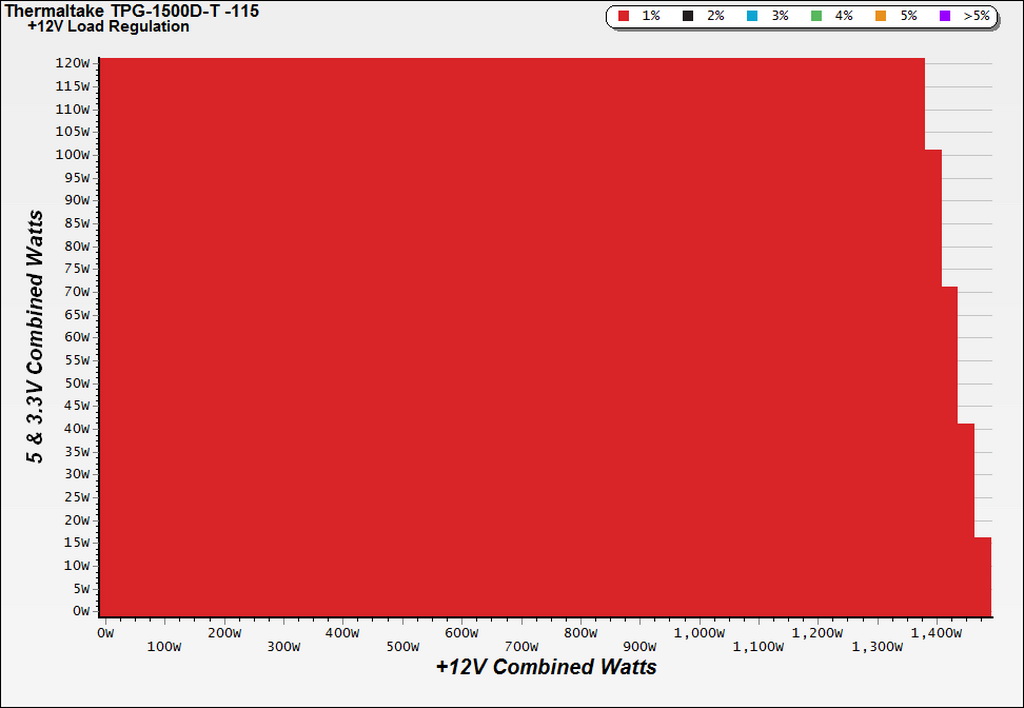
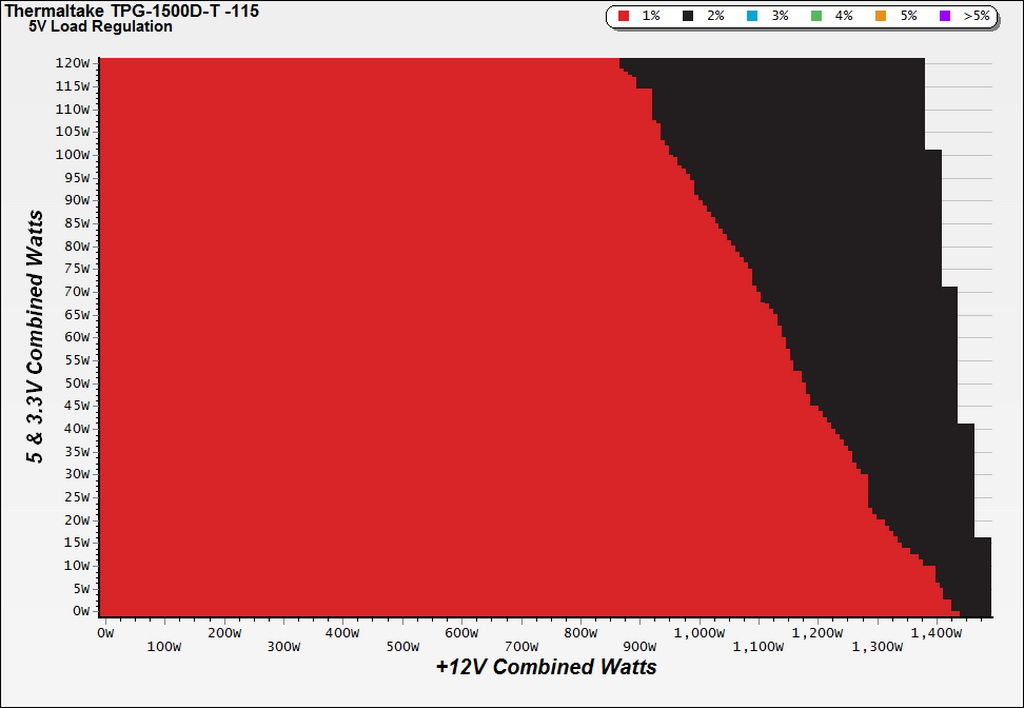
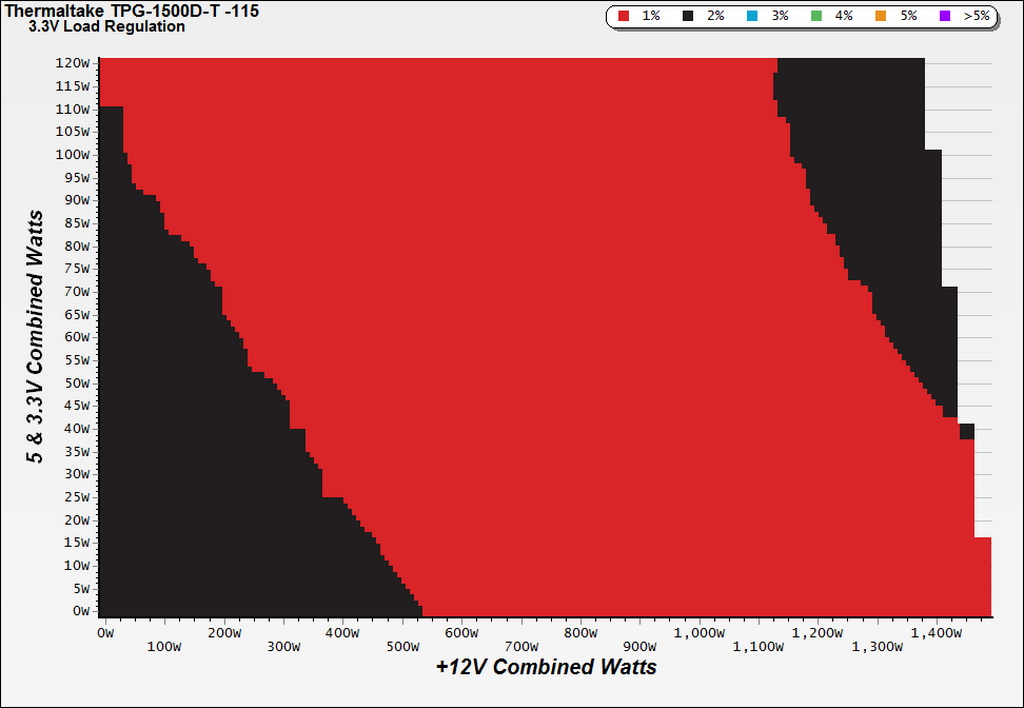
To generate the following charts, we set our loaders to auto mode through our custom-made software before trying more than 25,000 possible load combinations with the +12V, 5V and 3.3V rails. The load regulation deviations in each of the charts below were calculated by taking the nominal values of the rails (12 V, 5 V and 3.3 V) as point zero.
Load Regulation Charts
Efficiency Chart
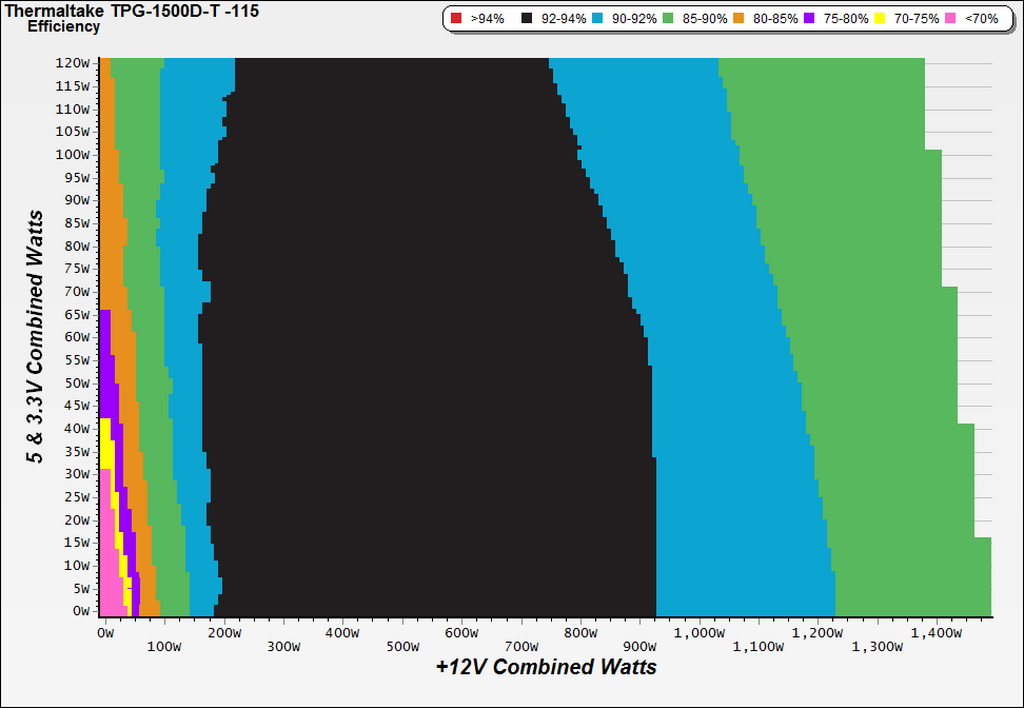
Efficiency falls between 92 to 94 percent in the 200 W to 1000 W region, even with a high load on the minor rails. We would like to see greater-than 90% readings above 1.2 kW loads, though. Moreover, our equipment didn't record over 94% efficiency with any load combination, something we'd expect to see from a Titanium-class PSU.
Ripple Charts
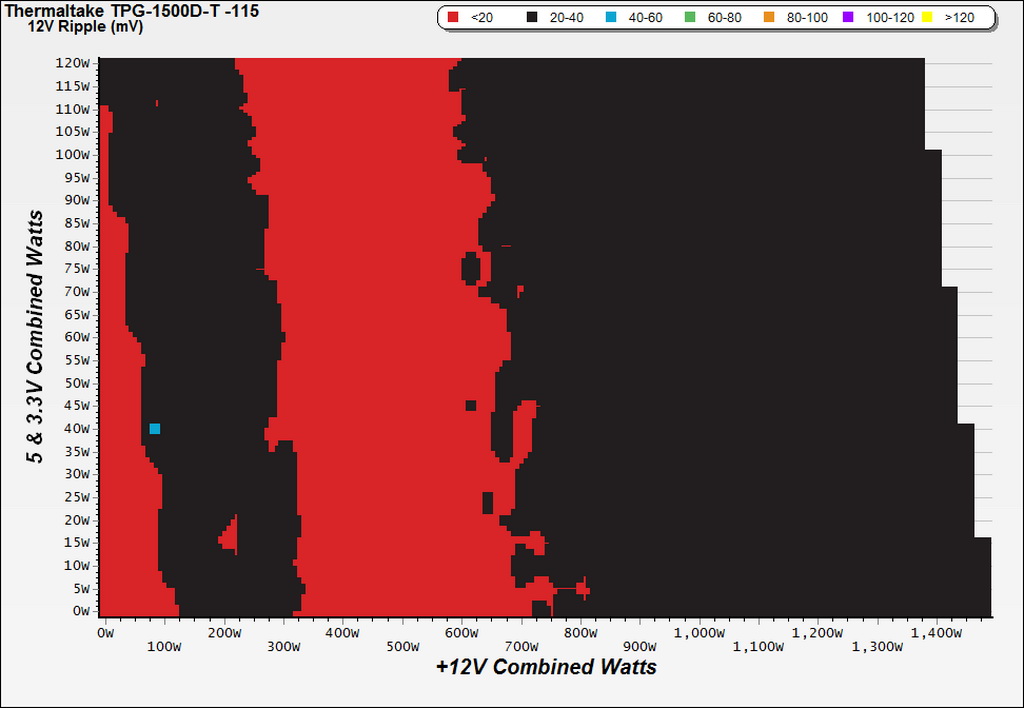
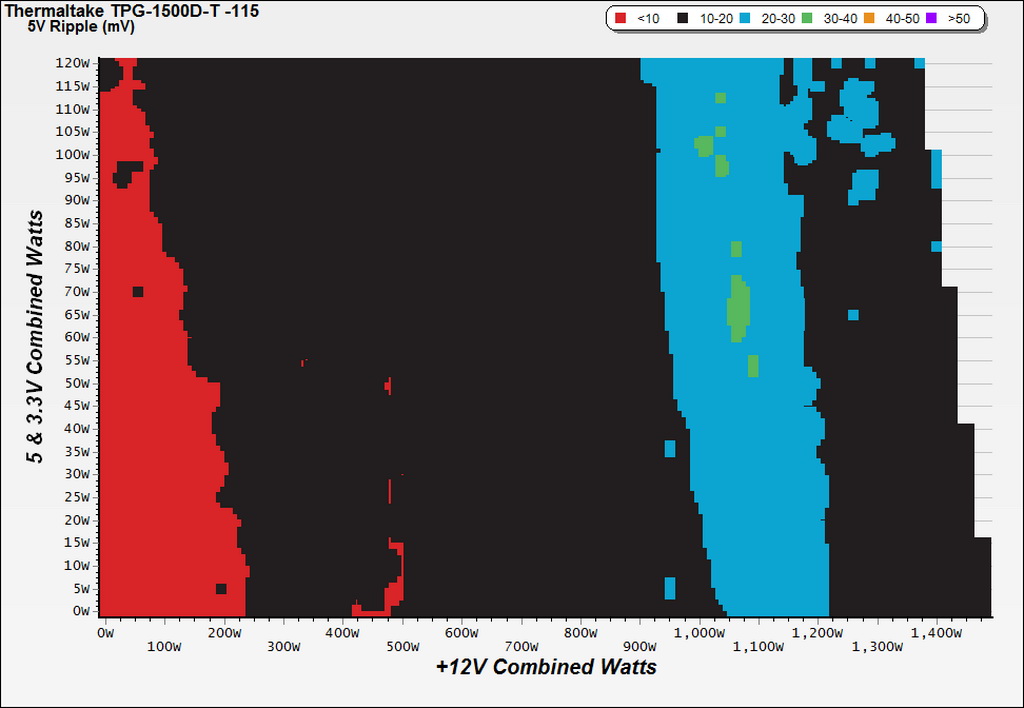
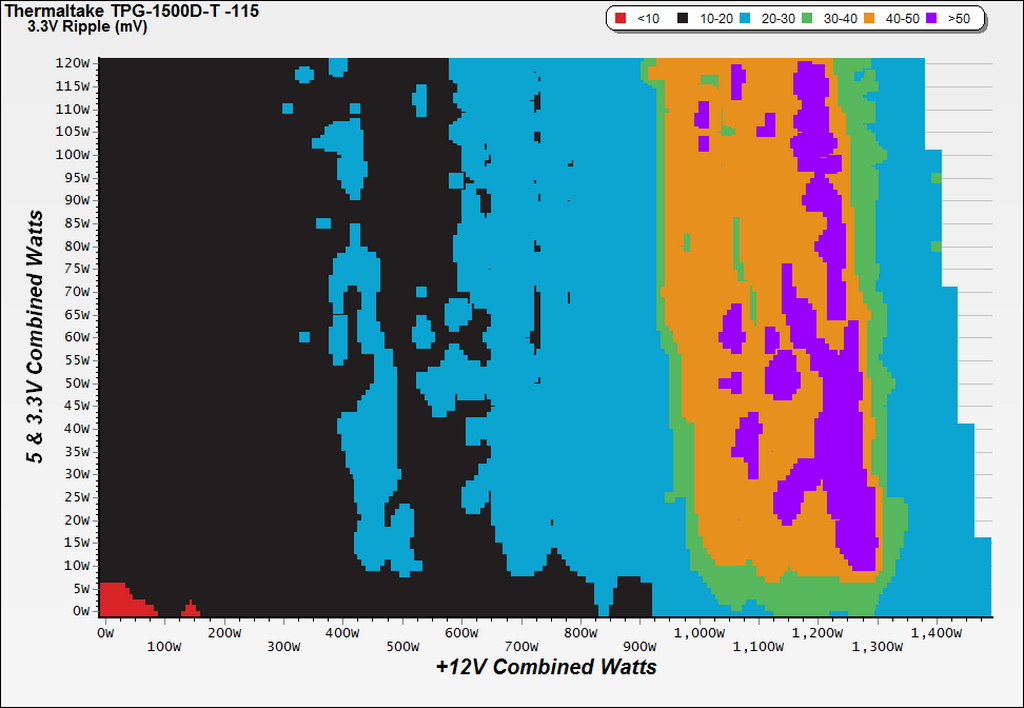
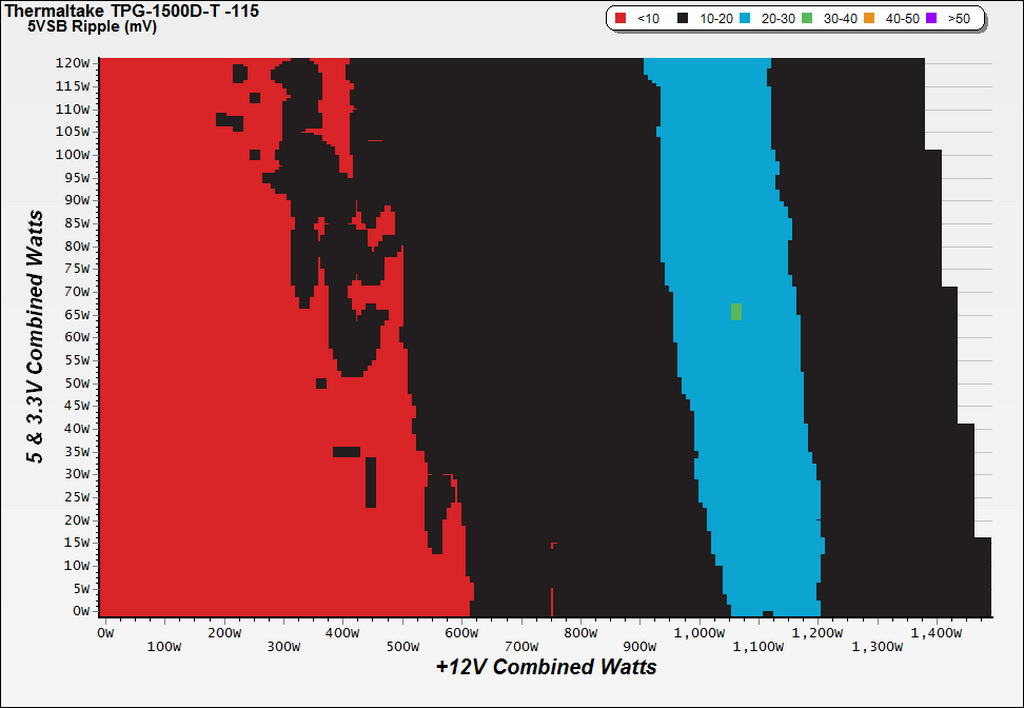
Infrared Images
Toward the end of the cross-load tests, we took some photos of the PSU with our modified FLIR E4 camera that delivers 320x240 IR resolution (76,800 pixels).
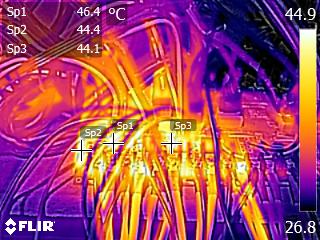
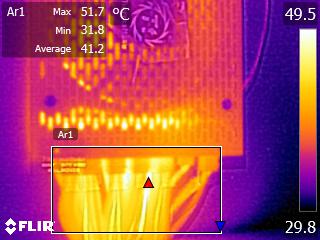
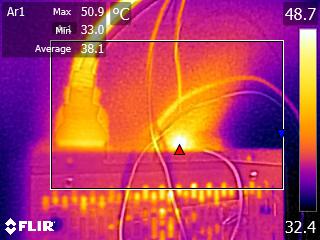
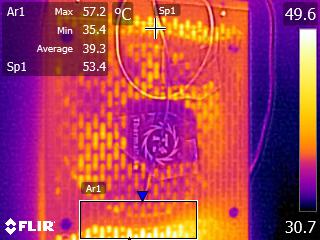
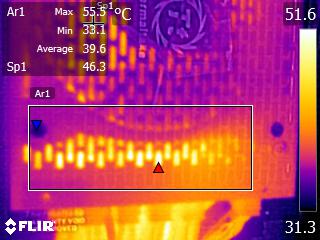
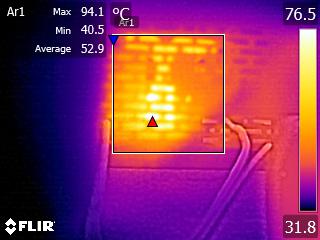
The modular cables' temperatures warm up due to the current passing through them. On the contrary, the temperatures of various parts inside the TPG-1500D-T are rather low, given the huge power levels they handle. The high-speed fan, combined with an aggressive profile under tough conditions, doesn't let the internal temperature spike. No doubt that plays a key role in extending this power supply's reliability over time.
Get Tom's Hardware's best news and in-depth reviews, straight to your inbox.
Current page: Cross-Load Tests And Infrared Images
Prev Page Protection Features Next Page Transient Response Tests
Aris Mpitziopoulos is a contributing editor at Tom's Hardware, covering PSUs.
-
spat55 So basically a poor performing PSU at this price point and the only good thing is a RGB fan I won't see because my PSU is always face down and preferably under a PSU cover, okay got it.Reply -
g-unit1111 What's the point of having an RGB ring on a bottom mounted PSU where nobody will see the fan anyways? :??:Reply
Also those cables - the word "eyesore" comes to mind! I would be replacing those with some custom ones ASAP! :ouch: -
spat55 Reply18628558 said:What's the point of having an RGB ring on a bottom mounted PSU where nobody will see the fan anyways? :??:
Also those cables - the word "eyesore" comes to mind! I would be replacing those with some custom ones ASAP! :ouch:
Yeah it's just a crap unit which is hoping the kids orgasm over those RGB lighting, it's doing my head in but I'm sure it'll soon become mainstream then die. -
powernod Extremely dissapointed by Thermaltake.Reply
Only at the TPG-1250D-T they used the new & excellent CST platform by CWT.
For all the other wattage models so far, ( 850 & 1500watt ) they used mediocre platforms by Enhance.
I had high expectations for Tt's new line of PSUs, but they were proven futile. -
Virtual_Singularity Thanks for another thorough, excellent, psu review, great job Aris. Disappointed by TT, as well. That is one flawed, less than mediocre (esp for the price) unit, OEM'd to Enhance by another predictable 3rd party company. Some pretty lights on the fan and it's 1600 watt helm of their "flagship" series moniker is supposed to justify that $430 pricetag? Fails to meet minimum atx specs in several areas, hold up time for such an expensive unit is also unacceptable. Similar to the MasterWatt Maker, it can't hope to compete with similar units from their competitors, which are lower in price, better in efficiency and overall specs.Reply -
Nuckles_56 The 12V CL1 was certainly one of the more interesting waveforms I've seen in a while. But overall I'm pretty disappointed in Thermaltake for producing such a over priced under performing PSUReply -
Br1414 Typo? 16 amps is the max legal load on a 20 amp 120v plug, thus option A apparently. Option B appears to be the old wall A/C style 20 amp 240 volt plug. Both a t slot styles. So maybe you rig something, but more or less you need an electrician just to use this thing safely! I guess you got the money...Reply -
Valantar Individually sleeved cables in the traditional "ketchup and mustard" colours? Wow, that made me laugh. Out loud. Might be suitable to some kind of early 2000s retro theme build?Reply
Also, I love the pixelated 8-bit-ish thing you've got going on with the ripple graphs on page 9. Perhaps
Otherwise, this was pretty much as expected. A useless product (the world does not need more 1000W+ PSUs), with useless features (RGB in a place where it'll be invisible in 90+% of modern cases), at a useless price point. That it performs badly as well just adds icing to the turd.
