ViewSonic VP2780-4K 27-inch Ultra HD Monitor Review
We've got ViewSonic's VP2780-4K in the lab today. Is this 27-inch, Ultra HD, IPS-based monitor worth your hard-earned money? Let's find out!
Why you can trust Tom's Hardware
Grayscale Tracking And Gamma Response
Our grayscale and gamma tests are described in detail here.
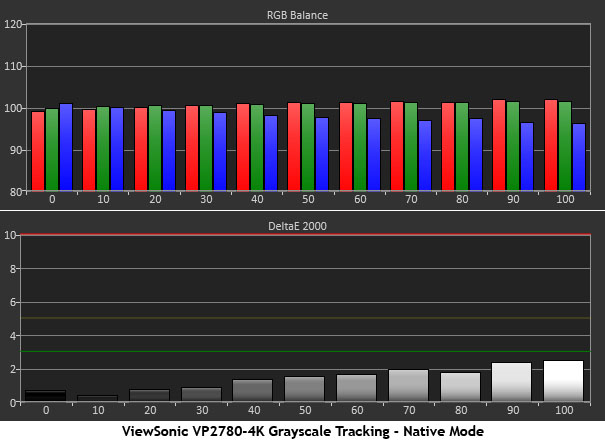
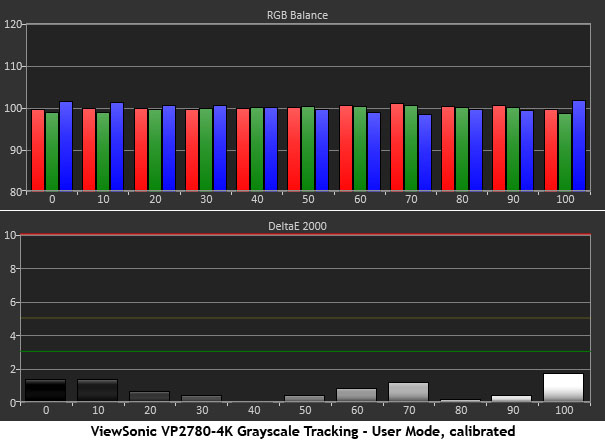
The VP2780-4K ships in its Native mode, which cannot be calibrated. There is an adjustable User mode, but for reasons we’ll explain, it’s not the best choice.
In the default Native mode, there are no visible grayscale errors. Delta E values start to climb a little in the 90 and 100 percent levels, but only a meter can see anything wrong. It matches the results on ViewSonic’s factory calibration sheet included with the monitor.
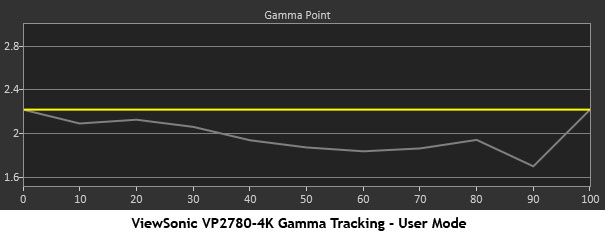
In User mode, extreme accuracy is possible with very precise RGB sliders. As you can see, the resulting chart is almost perfect. Unfortunately that’s the only good thing about the User mode. Gamma controls are locked out in favor of a less-than-ideal curve that affects color saturations negatively. For work requiring critical color accuracy, User mode is not the right choice.
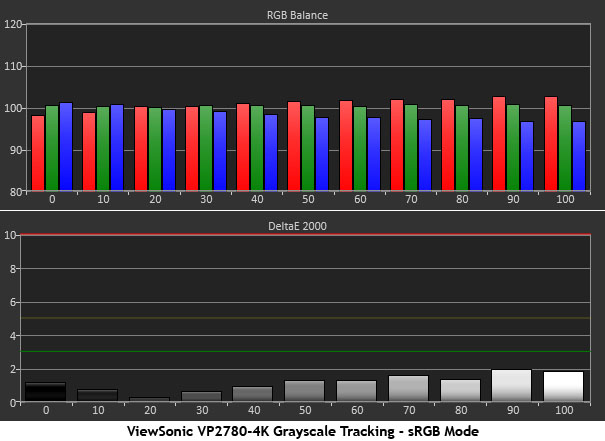
The best way to use the VP2780-4K is in its sRGB mode. All errors are under two Delta E, with many under one. You’ll also get the best gamma and color gamut accuracy.
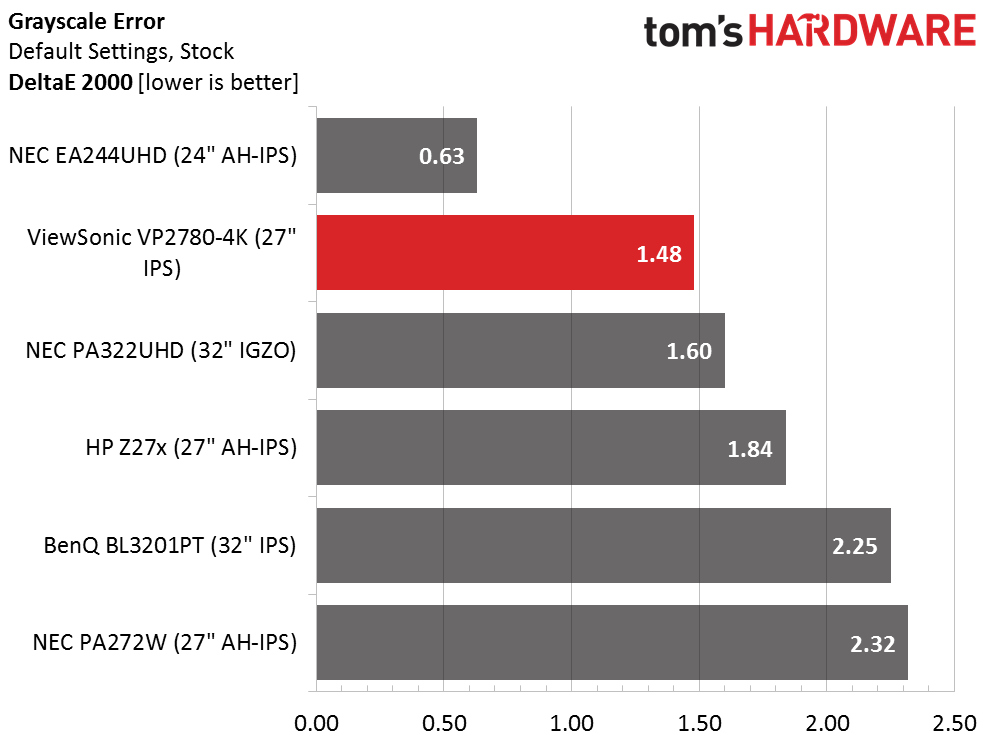
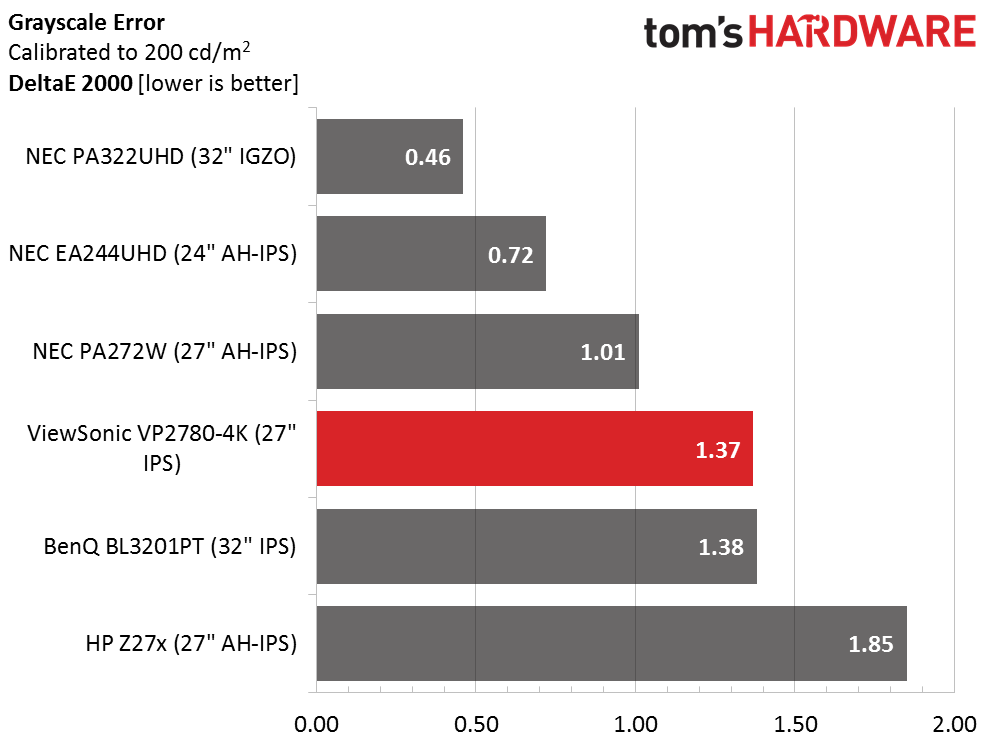
1.48dE represents the Native mode. It’s perfectly usable and beats every other screen in the group except for the amazing EA244UHD.
1.37dE is not the lowest error possible from the VP2780-4K (we achieved .81dE in User mode) but it represents the only other accurate preset: sRGB. It still ranks well with the other professional displays here. The only way to do better is with a software solution like CalMAN that generates a software lookup table.
Get Tom's Hardware's best news and in-depth reviews, straight to your inbox.
Gamma Response
Here is the reason why the User mode doesn’t work for us. The gamma tracking shown here is far too light, especially as brightness levels rise. The net effect is inaccurate color saturation in mid-tones, which we’ll show you on the next page. Since the gamma presets are inexplicably locked out in User mode, there's nothing that can be done about this issue.
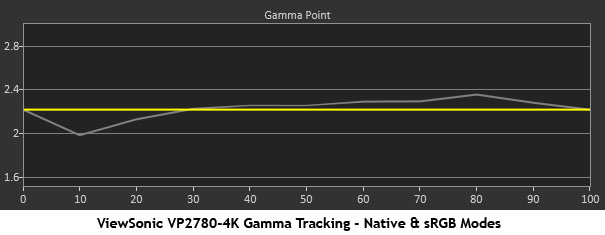
Fortunately, the gamma tracking is pretty good in both Native and sRGB modes. There is a small dip at the 10-percent level, and an even smaller hump at 80 percent. Neither anomaly causes any issues with color saturation. While it’s not the best gamma tracking we’ve seen, it compares reasonably well with the other screens compared here.
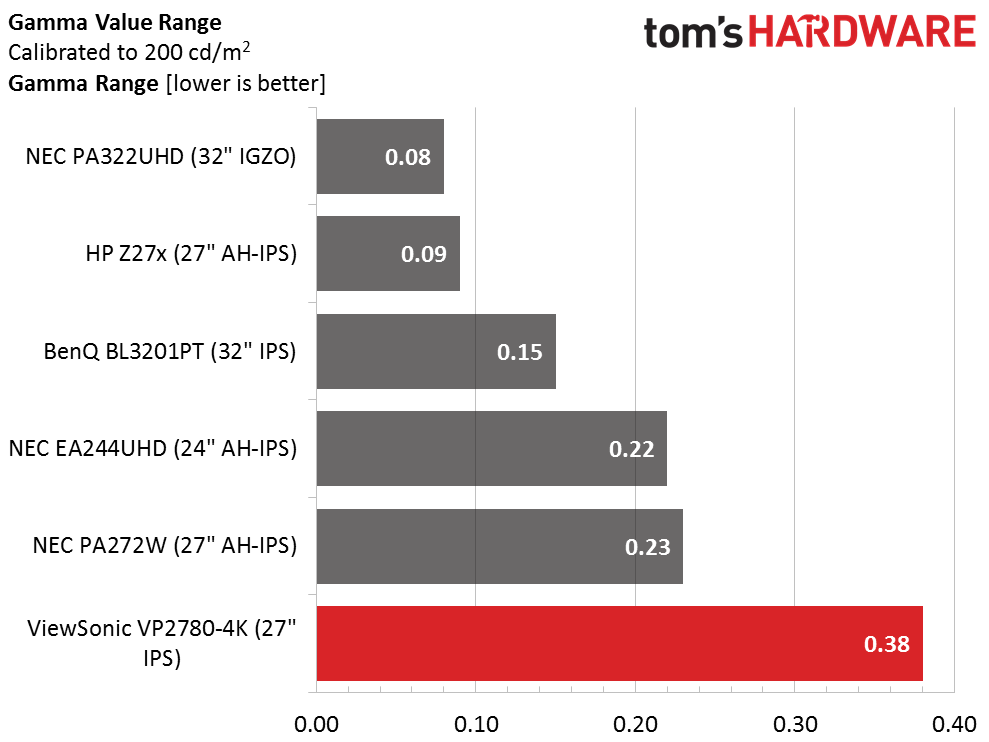
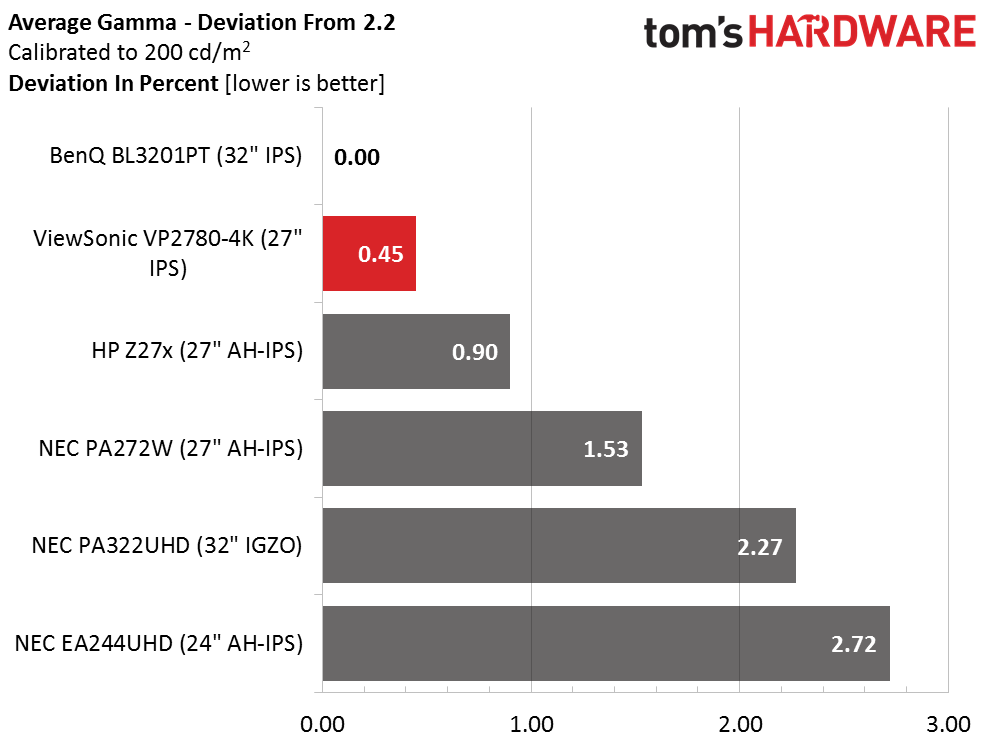
The slight aberrations at 10 and 80 percent spoil this result. Though it finishes last among these elite displays, a .38 variance is still quite good compared to the broader group of monitors we’ve tested.
We calculate gamma deviation by simply expressing the difference from 2.2 as a percentage.
The gamma deviation result is much better because the average values stay close to 2.2. While this bodes well for perceived contrast, it’s also important to the color saturation results — read on to see what we mean.
Current page: Grayscale Tracking And Gamma Response
Prev Page Brightness And Contrast Next Page Color Gamut And Performance
Christian Eberle is a Contributing Editor for Tom's Hardware US. He's a veteran reviewer of A/V equipment, specializing in monitors. Christian began his obsession with tech when he built his first PC in 1991, a 286 running DOS 3.0 at a blazing 12MHz. In 2006, he undertook training from the Imaging Science Foundation in video calibration and testing and thus started a passion for precise imaging that persists to this day. He is also a professional musician with a degree from the New England Conservatory as a classical bassoonist which he used to good effect as a performer with the West Point Army Band from 1987 to 2013. He enjoys watching movies and listening to high-end audio in his custom-built home theater and can be seen riding trails near his home on a race-ready ICE VTX recumbent trike. Christian enjoys the endless summer in Florida where he lives with his wife and Chihuahua and plays with orchestras around the state.
-
Daniel Ladishew I keep seeing prices quoted in your reviews that are lower than the links provided in the same article. This is very misleading and frankly confusing when trying to align your evaluation with the prospect of a purchase. Maybe it's time to review your system of automatic price linking and/or including how much a product costs in the text of your articles? While I don't expect it to match on the penny every time, several hundred dollar swings makes for a hard sell when you claim "a very reasonable $890 MSRP" for a product showing for over $1000.Reply -
tomc100 4K displays should start at 40" to really take advantage of the increased resolution. 27" doesn't make any sense.Reply -
Walter Smith And yet be sure we will soon be seeing 4k resolution being common in our 5" or 6" screen smartphones. As an all purpose, everyday main monitor, at this price point, this screen bears some serious consideration.Reply -
FritzEiv ReplyI keep seeing prices quoted in your reviews that are lower than the links provided in the same article. This is very misleading and frankly confusing when trying to align your evaluation with the prospect of a purchase. Maybe it's time to review your system of automatic price linking and/or including how much a product costs in the text of your articles? While I don't expect it to match on the penny every time, several hundred dollar swings makes for a hard sell when you claim "a very reasonable $890 MSRP" for a product showing for over $1000.
Thanks for the input. In many articles we do call out the fact that the prices in the article are based on the writing time frame. I'll make a note about getting better and more consistent at that. The "buy buttons" we place into the articles, which are linked from e-tailers/merchants are typically dynamically linked using APIs. So the prices in those buttons are supposed to represent real time pricing, which, as you know, fluctuate madly depending on the category. The upside is that we'll always have the latest pricing. The downside is that it's different than what we put into our written text, and sometimes how we determine our "value" analysis, where applicable. Another downside is that sometimes the API implementations are a little wonky, a situation our development and commerce teams are continually trying to address.
- Fritz Nelson, Editor-in-chief
-
zcat Do all of these 4k monitors do decent 1080p upscaling? That's my only real concern, since nobody's going to be gaming @ 4k native for quite a while, so the upscaling should look good and have negligible impact.Reply -
Brian_R170 I really like this monitor, but fear Viewsonic's reliability. In 2008-2009, my work group bought a few hundred value-priced 27-inch Viewsonic monitors and 23-inch Viewsonic TVs. The failure rate was unbelievably high, easily surpassing 50% in the first year for the 27-inch model. The 23-inch TVs fared better, but surpassed 50% failure within 3 years. Viewsonic replaced the ones that failed under warranty with refurbs, and they failed, too.Reply
I personally bought one of the same 27-inch models from Costco for home use after using one at work, it failed in less than 3 months. Thank goodness for Costco's warranty.
Maybe just really bad quality control on a couple of low-end models, but it scares me when the author writes "The obvious question has to be: what’s missing?", because in my past experience, what was missing was quality control. -
InvalidError Reply
Tell that to people who choose to do most of their reading on 1200-1600p 7-10" tablets due to the more pleasant, crisper, more paper-like fonts. I wouldn't mind having a 24-27" UHD display for reading. I am still a big fan of dead-tree format for reading because crisper fonts and higher contrast reduce eyestrain.16167997 said:4K displays should start at 40" to really take advantage of the increased resolution. 27" doesn't make any sense. -
-Fran- Looks like a solid option. I miss my low latency Viewsonics from old, but Samsung gave fierce competition. I wonder what Samsung will bring to the table now.Reply
And please make prices go down already. I want one of these puppies at a reasonable 300-ish price, haha.
Cheers!
