Bye Bye Tape, Hello 5.3 TB eSATA
Testing
Test PC Specs
- CPU Name: Intel(R) Pentium(R) D CPU 2.80 GHz (Intel Intel(R) Pentium(R) D CPU 2.80 GHz 2793 MHz)
- Vendor ID: GenuineIntel*
- Core ID: Family: 15, Model: 4, Stepping: 7*
- Number of CPUs (real, virtual): 1, 2*
- Windows MHz: 2793*
- CPU External Clock: 200 MHz*
- Motherboard: MSI P4M890M*
- BIOS: Date: 08/25/06 14:17:51, Version: A7255VMS V1.0, Version: A M I - 8000625*
- Graphics adapter: Standard VGA Graphics Adapter*
- Graphics adapter memory: 32 MB*
- Graphics driver: 5.2.3790.1830*
- Memory Amount (MB): 478 (physical: 512) *
- Hard drive model Master: WDC WD800JB, 80 GB, EIDE*
- Hard drive model Slave: WDC WD800BB, 80 GB, EIDE*
- Hard drive model External: WDC WD2500B014, 250 GB, USB 2.0*
- Screen Resolution: 1280x1024x32@1Hz*
- OS Name: Microsoft Windows Server 2003*
- Version: 5.2*
- Build: 3790*
- Service Pack: Service Pack 1*
Initial Performance Tests
For starters, I wanted to get a better idea of what kind of performance the eSATA Backup System could deliver using simple comparisons. I needed to test the speed to copy a file from the computer's local drive to a separate drive and performance in real backup situations. For comparison's sake, I chose the following 3 types of destination drives.
| Interface Type | Manufacturer | Model Number | Disk Space | Connection Type |
|---|---|---|---|---|
| IDE | Western Digital | WD800BB | 80 GB | EIDE |
| eSATA | Seagate | ST3750640AS | 750 GB | eSATA 3 GB |
| USB | Western Digital | WD2500B014 | 250 GB | USB 2.0 |
I then chose three tools to compare the performance of each of the destination drives above:
- COSBI OpenBenchMark
- High-Rely's own TRMark
- Windows 2003 Backup Utility
COSBI OpenSourceMark Results
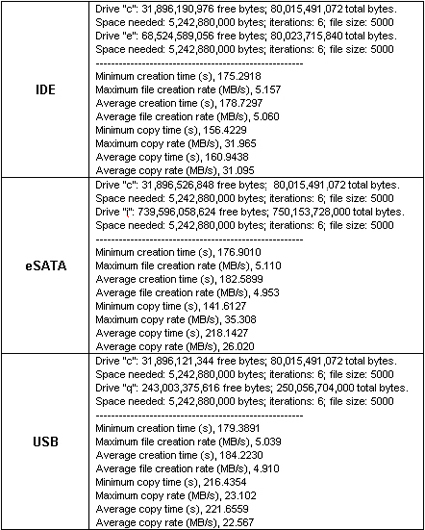
With COSBI OpenSourceMark, I used the filecopy tool to create a 5 GB test file on the computer's C: drive and then copied that file over to each of the three destination drives listed above. The process was repeated six times. The average of the six trials is presented below. For details see the table following the results table.
| Header Cell - Column 0 | Average Copy Rate (MB/s) |
|---|---|
| IDE | 31.10 |
| eSATA | 26.02 |
| USB | 22.57 |
Detailed results from the COSBI OpenSourceMark FileCopy test.
eSATA's average copy rate outperformed the USB test by 12 MB per second, but eSATA could not beat the IDE disk drive configured as a slave drive on the same computer. Also, between the three devices, the eSATA test had the most inconsistent scoring. Of the six repeated eSATA tests, the first three tests ran at 36.64 MB/s, 31.21 MB/s and 35.31 MB/s and the last three iterations of the test ran at 13.64 MB/s, 23.90 MB/s and 17.43 MB/s. It's not clear why there was a sudden drop in rates during eSATA testing, especially around the middle of the run. The other two drives provided more consistent results. The IDE drive's copy rates ran between 29.22 MB/s and 31.96 MB/s while the USB tests ran between 21.78 MB/s and 23.10 MB/s.
Get Tom's Hardware's best news and in-depth reviews, straight to your inbox.
