SanDisk A110 PCIe SSD: Armed With The New M.2 Edge Connector
We got our hands on an early sample of SanDisk's A110 SSD. So what? Big deal? Not a chance. This thing is PCI Express-attached and sports the new M.2 edge connector. Read on to learn more about the next generation of solid-state storage connectivity.
Results: PCMark 7 And PCMark Vantage
Futuremark's PCMark 7: Secondary Storage Suite
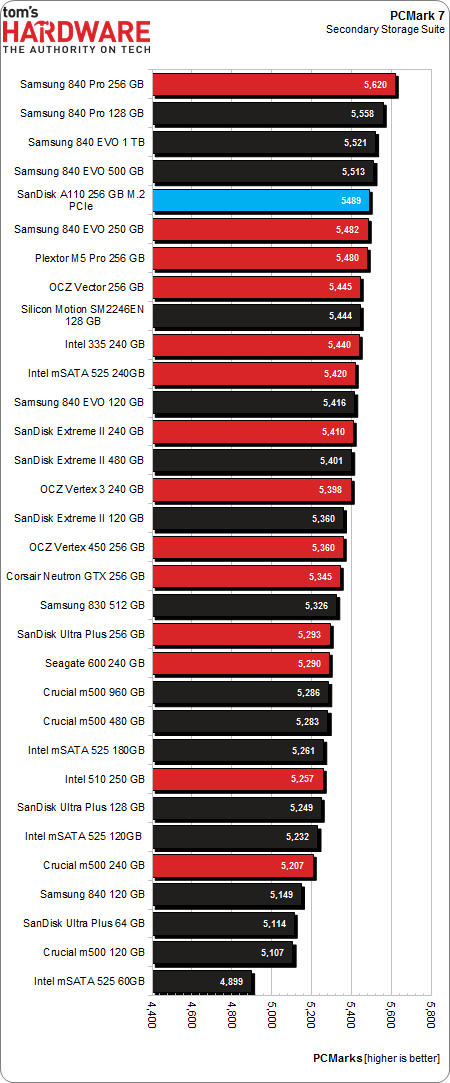
PCMark 7 uses the same trace-based technology as our Storage Bench v1.0 for its storage suite testing. It employs a geometric mean scoring system to generate a composite, so we end up with PCMarks instead of a megabytes per second. One-thousand points separate the top and bottom, but that encompasses a far larger difference than the score alone indicates.
This test is a big improvement over the older PCMark Vantage, at least for SSD benchmarking. The storage suite is comprised of several small traces. At the end, the geometric mean of those scores is scaled with a number representing the test system's speed. The scores generated are much different from PCMark Vantage, and many manufacturers are predisposed to dislike it for that reason. It's hard to figure out how PCMark 7 "works" because it uses a sliding scale to generate scores. Still, it represents one of the best canned benchmarks for storage, and if nothing else, it helps reinforce the idea that the differences in modern SSD performance don't necessarily amount to a better user experience in average consumer workloads.
The PCIe-attached, M.2-based A110 doesn't break any speed records in PCMark 7, but it does fare better than similar drives. Given what we know about the way PCMark 7 works and its focus on real-world-style performance, it takes more than just stellar sequential throughput to affect the test's outcome. Still, the A110 is the second-fastest 256 GB-class drive in our line-up, besting the similarly-configured Extreme II and a ton of other SSDs, too.
Futuremark's PCMark Vantage: Hard Drive Suite
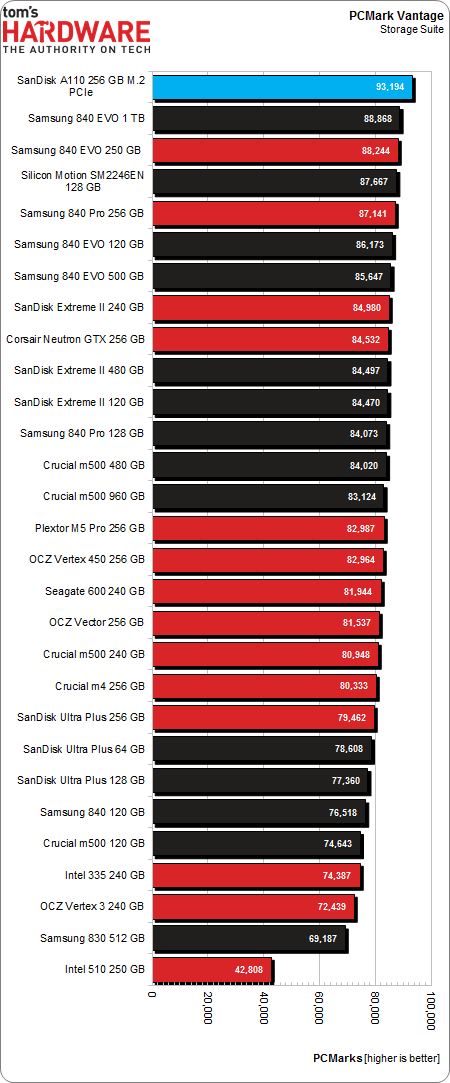
PCMark's Vantage isn't the paragon of SSD testing, mainly because it's old and wasn't designed for the massive performance solid-state technology enables. Intended to exploit the new features in Windows Vista, Vantage was certainly at the forefront of consumer storage benching at the time. Vantage works by taking the geometric mean of composite storage scores and then scaling them a lot like PCMark 7 does. But in Vantage's case, this scaling is achieved by arbitrarily multiplying the geometric sub-score mean by 214.65. That scaling factor is supposed to represent an average test system of the day (a system that's now close to a decade behind the times). PCMark 7 improves on this by creating a unique system-dependent scaling factor and newer trace technology.
Why bother including this metric, then? A lot of folks prefer Vantage in spite of or because of the cartoonish scores and widespread adoption. That, and the fact that most every manufacturer uses the aged benchmark in box specs and reviewer-specific guidelines. In fairness, Vantage's Hard Drive suite wasn't designed with SSDs in mind, and is actually quite good as pointing out which 5400 RPM mechanical disk might be preferable.
Get Tom's Hardware's best news and in-depth reviews, straight to your inbox.
The A110's PCIe connection strikes again, resulting in a top-end score. Most of the SSDs included in this chart are 256 GB models, and they're highlighted in red.
Current page: Results: PCMark 7 And PCMark Vantage
Prev Page Results: Tom's Hardware Storage Bench v1.0, Continued Next Page Results: File Copy Performance-
Mike Friesen Awesome new stuff. Can't wait to see if this drive actually uses the full potential of the M2, and if Samsung or OCZ can one-up them.Reply -
cryan Reply11487924 said:Awesome new stuff. Can't wait to see if this drive actually uses the full potential of the M2, and if Samsung or OCZ can one-up them.
Samsung actually has some pretty awesome M.2 PCIe action going on. We're trying to get our hands on everything, so stay tuned.
Regards,
Christopher Ryan
-
It will be nice to see vendors implement the NVMe connectors in the desktop mobo's, which in turn will redefine case design, as less storage space will be required for storage. I am aware that the initial intent is to direct these at the mobile market, but desktops can benefit as well.Reply
-
cryan Reply11488018 said:It will be nice to see vendors implement the NVMe connectors in the desktop mobo's, which in turn will redefine case design, as less storage space will be required for storage. I am aware that the initial intent is to direct these at the mobile market, but desktops can benefit as well.
You'll really see NVMe take off on the desktop with the move towards SATA Express. A SSD on SATA Express will leverage NVMe and two PCIe Gen 3 lanes. Though some motherboards will (and already do) have M.2 connectors, M.2 really makes more sense in mobile applications. M.2 will only get traction on the desktop insofar as it will begin to replace mSATA. Tons of mainboards, especially smaller form factor products embrace mSATA, and moving to M.2 is a natural transition. However, M.2 drives are hard to find right now, and we really won't see a plethora of options until next year.
Regards,
Christopher Ryan
-
nekromobo I got M.2 toshiba ssd in my Sony Vaio Pro 13.. review that?Reply
and it should have samsung M.2 in some countries.. -
CaedenV I may no longer have motivation to upgrade my system based on CPU specs, but with DDR4, M.2, new restive storage based SSDs, and better chipset features I will still have enough reason to upgrade in a year or two.Reply -
jimmysmitty Reply11488122 said:11488018 said:It will be nice to see vendors implement the NVMe connectors in the desktop mobo's, which in turn will redefine case design, as less storage space will be required for storage. I am aware that the initial intent is to direct these at the mobile market, but desktops can benefit as well.
You'll really see NVMe take off on the desktop with the move towards SATA Express. A SSD on SATA Express will leverage NVMe and two PCIe Gen 3 lanes. Though some motherboards will (and already do) have M.2 connectors, M.2 really makes more sense in mobile applications. M.2 will only get traction on the desktop insofar as it will begin to replace mSATA. Tons of mainboards, especially smaller form factor products embrace mSATA, and moving to M.2 is a natural transition. However, M.2 drives are hard to find right now, and we really won't see a plethora of options until next year.
Regards,
Christopher Ryan
That's what I was thinking. SATA Express is going to be fast enough for now as I have used PCIe SSDs before (OCZ Revo based drive) and compared to my 520 its hard to notice a difference, especially since there are other bottlenecks stopping it from being able to utilize that bandwidth.
This will be great for ultra portable systems though and ITX systems.
-
cryan Reply11488367 said:I got M.2 toshiba ssd in my Sony Vaio Pro 13.. review that?
and it should have samsung M.2 in some countries..
Absolutely... just send it my way and consider it done.
Regards,
Christopher Ryan
-
mikeangs2004 will there be RAID or SLI/CFX for PCIe based SSD's?Reply
I don't think so b/c it's already way above 6G limit.

