AMD Radeon RX 480 Graphics Card Roundup
Power, Sound & Temperature Benchmarks
Why you can trust Tom's Hardware
Power Consumption
We begin by comparing the power consumption of each card in our gaming loop, stress test, and at idle. Depending on the power targets specified by each manufacturer, we sometimes measured substantial differences. We're ignoring the decimal places in our bar graphs, since those values are too small and would be within measurement tolerances.
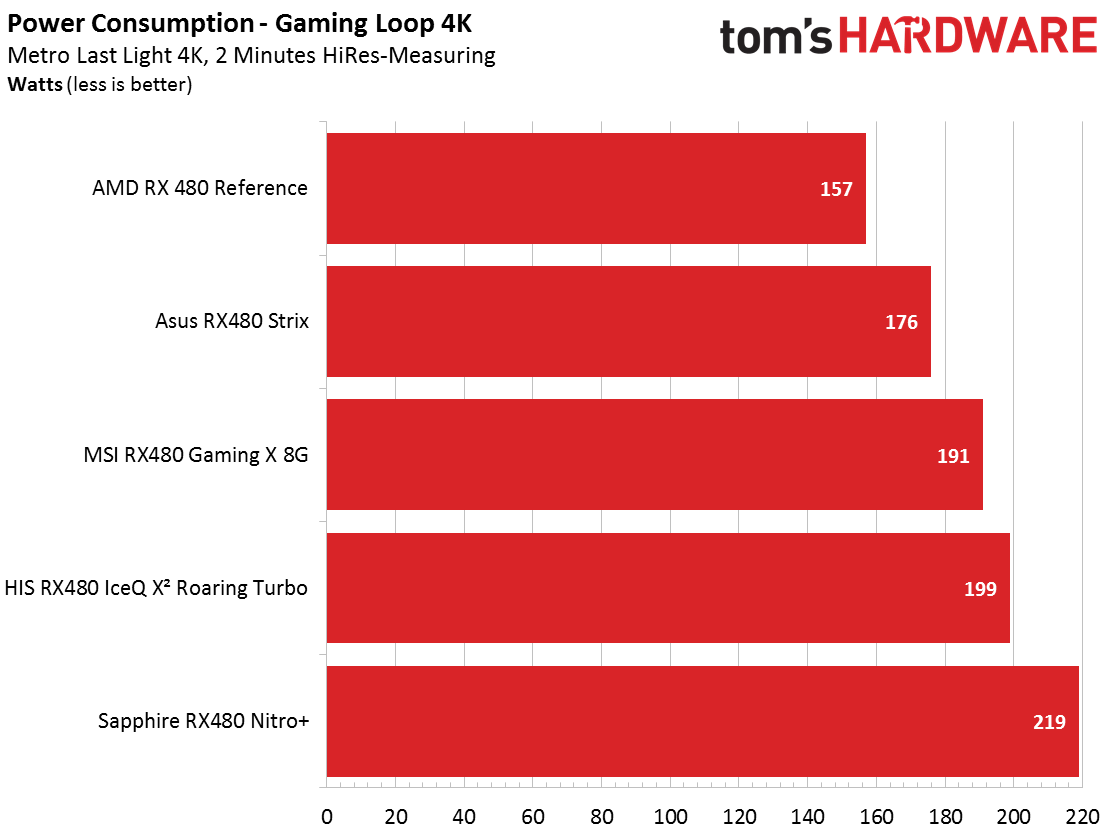
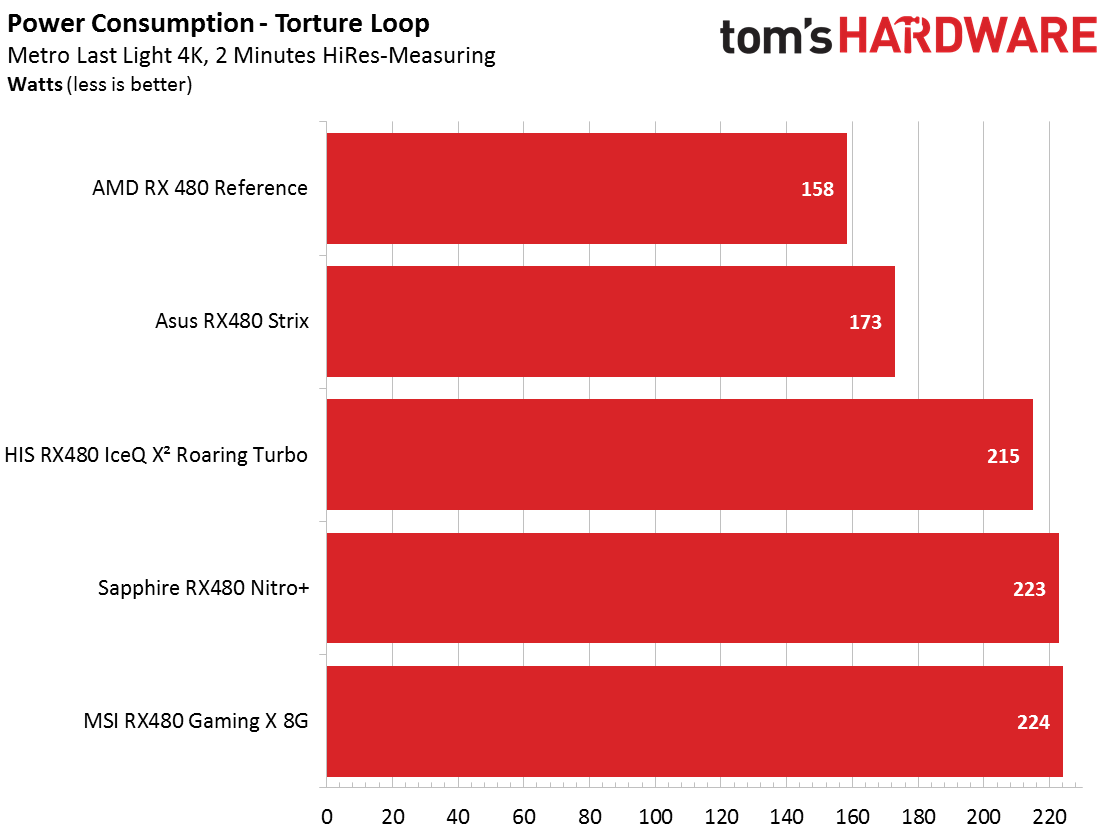
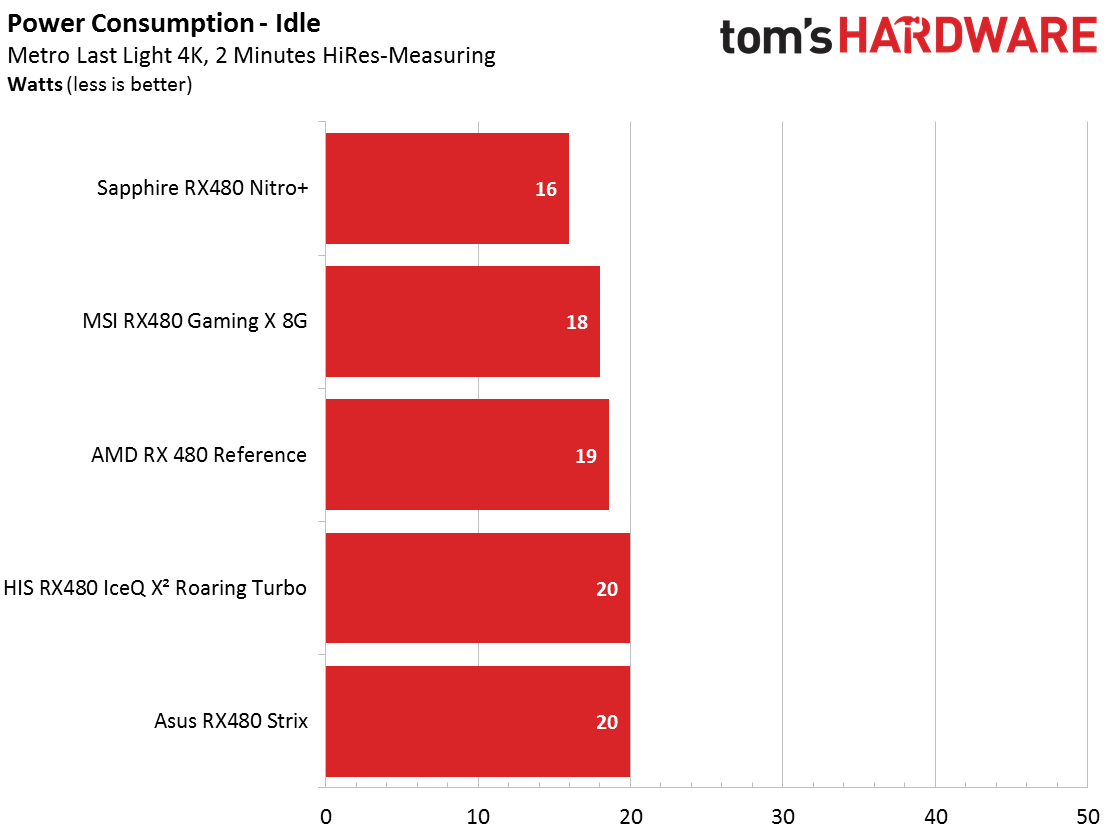
We also found that some cards with lower power targets started to throttle during our stress test, resulting in lower power consumption numbers. This did not, however, have a negative impact on general gaming performance for any of the tested cards, as the stress test merely represents a worst-case scenario.
Sound
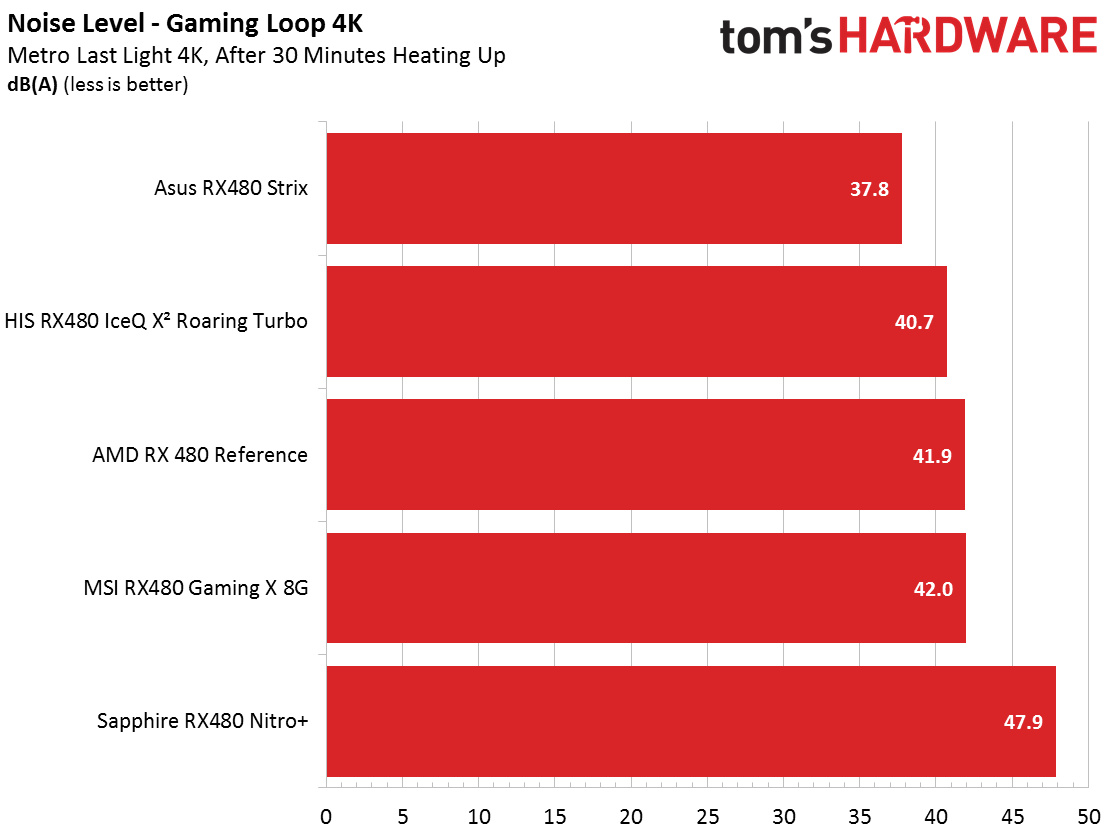
In the following comparison, we summarize the maximum results in our gaming loop as a bar graph - check out the frequency spectrum on the individual product pages, too.
Since these cards employ a semi-passive mode, their fans don't spin at idle. Consequently, there was no reason to collect measurements in that state.
Temperature
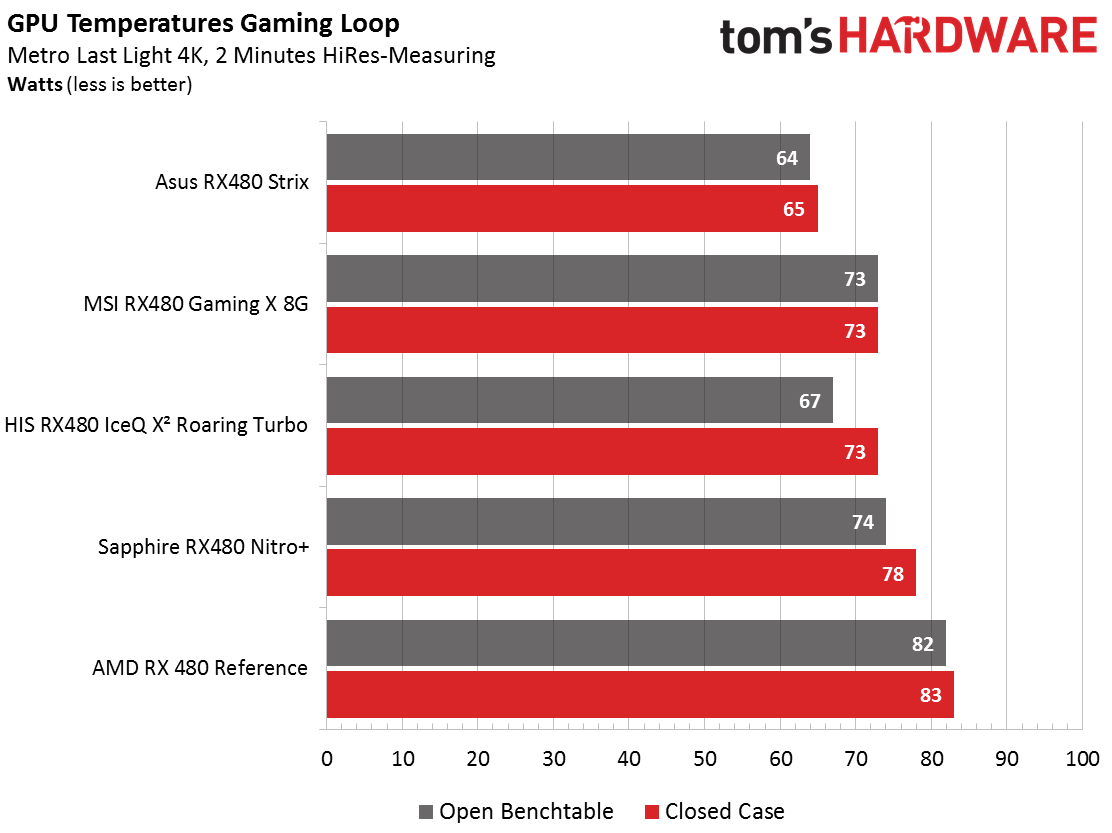
In two galleries we compare temperatures on the open test bench and inside a closed case. We start with measurements from the GPU:

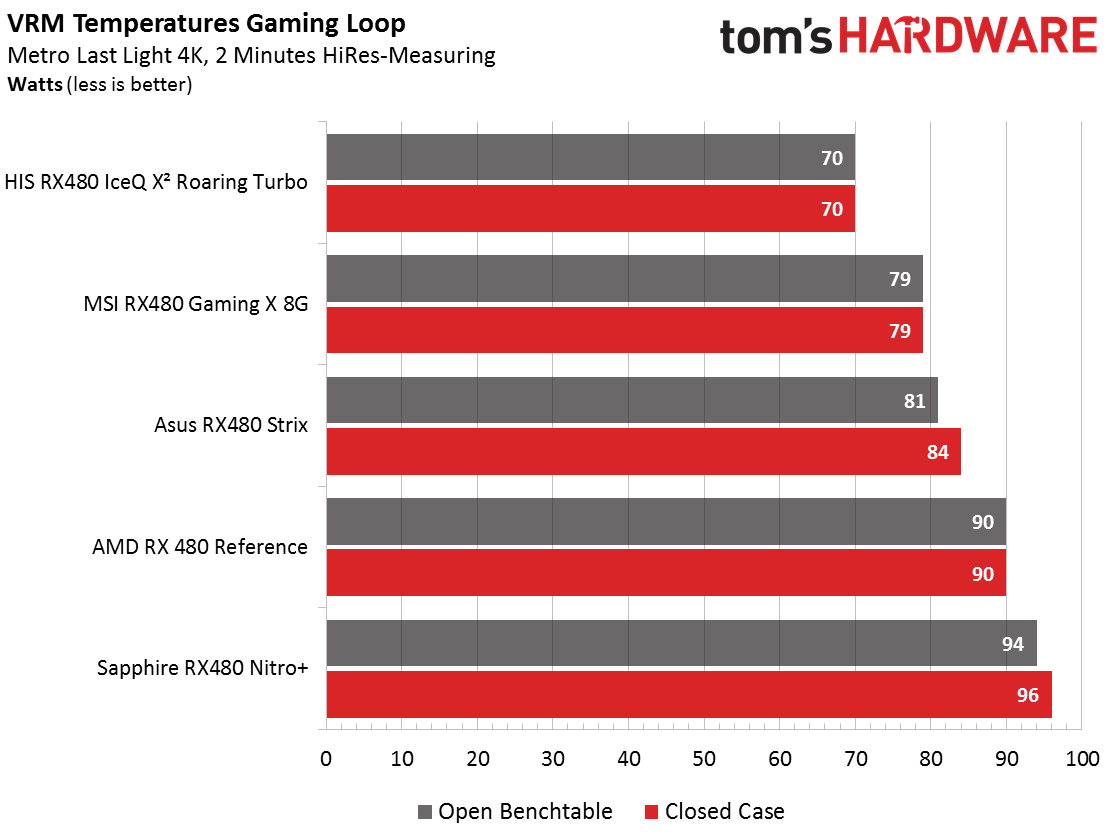
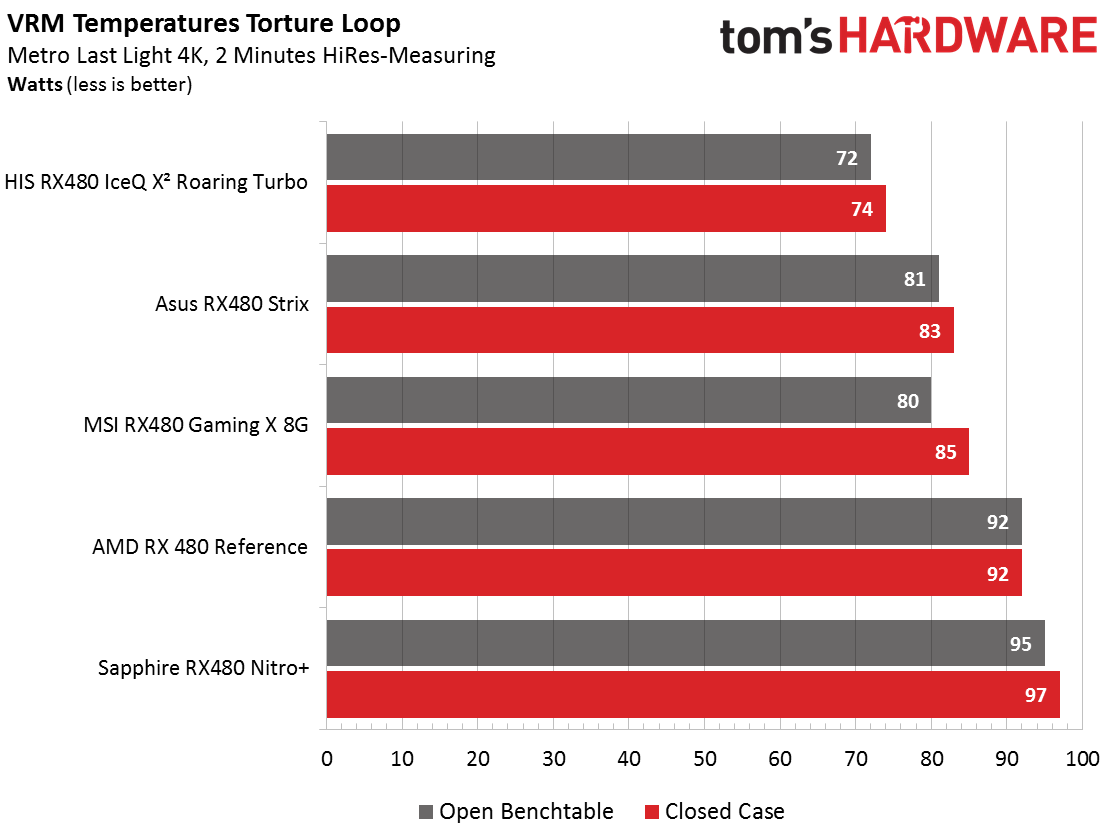
The VRMs are just as important as the GPU since they play an even more active role in heating the PCB. Again, you'll find more detail on the individual products pages.
MORE: Best Graphics Cards
MORE: Desktop GPU Performance Hierarchy Table
MORE: All Graphics Content
Current page: Power, Sound & Temperature Benchmarks
Prev Page 1440p Game Benchmarks Next Page Reference AMD Radeon RX 480Get Tom's Hardware's best news and in-depth reviews, straight to your inbox.

Igor Wallossek wrote a wide variety of hardware articles for Tom's Hardware, with a strong focus on technical analysis and in-depth reviews. His contributions have spanned a broad spectrum of PC components, including GPUs, CPUs, workstations, and PC builds. His insightful articles provide readers with detailed knowledge to make informed decisions in the ever-evolving tech landscape
-
alchemy69 Not sure where you found a reference card for $180 but it sure as Hell wasn't Amazon.Reply -
artk2219 You can find them on Newegg for around that much pretty often. Also the R9 Fury is a hell of a mixed bag, Some games its matching a 1070, others its below the 480. Weird.Reply -
techy1966 I only ask because I have 2 390x cards and I get way better results than yours does here and yes with crossfire off mine is getting better results granted it is overclocked @1236mhz. Heck I just played watch dog 2 single card mode and got always above 60 fps here that card is getting 45 fps..just saying is all. Nice write up though. Just noticed GTA numbers as well and was WTH why is their 390x card sucking so much must be old old drivers I 'm sorry but even with crossfire off my numbers at 1080p are way higher maxed out. I do know I can beat a 480 in everything and slaughter it in crossfire will Vega ever get here already or do I have to slide over to the green team lol.Reply -
shrapnel_indie HIS has been missing from the U.S. Market for a few years now. As to noise, Yes we can measure it, and determine a loudness level, but tolerance is dependent on the individual as always. I still question the price links used as some are unrealistically high compared to the market Amazon competes in (Mail-Order.)Reply
Was the latest driver used? Was the BIOS updated in every card? -
digitalgriffin I am a bit perplexed as to why you love the ASUS Strix so much with a 6 pin power connector. Either it's pulling too much power over the PEG, or pulling too much power over the 6 pin. It really needs an 8 pin connector to stay in spec.Reply -
blppt "Also the R9 Fury is a hell of a mixed bag, Some games its matching a 1070, others its below the 480. Weird."Reply
The newest generation AMD cards (Polaris) are apparently designed to handle heavy Tessellation better than previous gens, so my guess is that would be the circumstances in which the RX480 beats the Fury. I would say it was the extra 4GB of frame buffer space, but we've seen that the HBM often negates that RAM shortage in many benchmarks. -
NewbieGeek Hmm. Interesting article. Personally never had temperature issues with my Sapphire Nitro rx 480 8gb. Maybe Tom's is defective? Mine runs at 1330mhz core 2020mhz ram without drops, even during intense gaming... And I've got a custom fan curve making the card quieter than stock...Reply
