Why you can trust Tom's Hardware
We used GPUz logging to measure the card’s power consumption with the Metro:Exodus benchmark running at 2560 x 1440 using the default Ultra settings. The tested card is warmed up prior to testing and started after settling to an idle temperature (after about 10 minutes). The benchmark is looped a total of five times which yields around 10 minutes of testing. In the charts you will see a few blips in power use which is a result of the benchmark ending one loop and starting the next.
We also use Furmark to capture worst-case power readings. Although both Nvidia and AMD consider the application to be a “power virus,” or program that deliberately taxes the components beyond normal limits, the data we can gather from it offers useful information about a card’s capabilities outside of typical gaming loads.
Power Draw
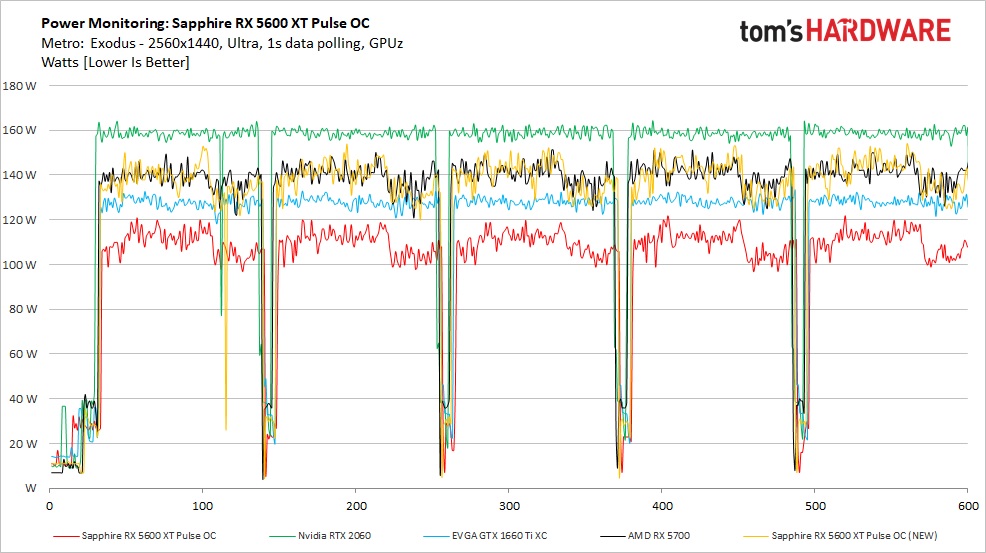
Looking at the power charts, we compared the Sapphire 5600 XT Pulse OC with its reference configuration as well as the OC bios. We saw significant differences between them. Where the reference card peaked at 121W, averaging around 110W, with the new BIOS it peaked at 156W while averaging 140W. Quite a difference, but still averaging well under the listed board power (160W in the case of the Pulse OC).
What is interesting, though not surprising, is that both the reference-clocked RX 5700 and this 5600 XT Pulse using the OC bios both used the same amount of power in this test. We are not surprised since this is the same Navi 10 silicon/specifications, minus 2GB of RAM. Meanwhile the RTX 2060, which the 5600 XT compares best with performance-wise, uses about 20W more power. This brings things more in line in the performance per watt conversation, where previously the older Nvidia architecture tended to be a bit more efficient. AMD mentions a 2.1x increase in performance per watt over the Polaris parts as well.
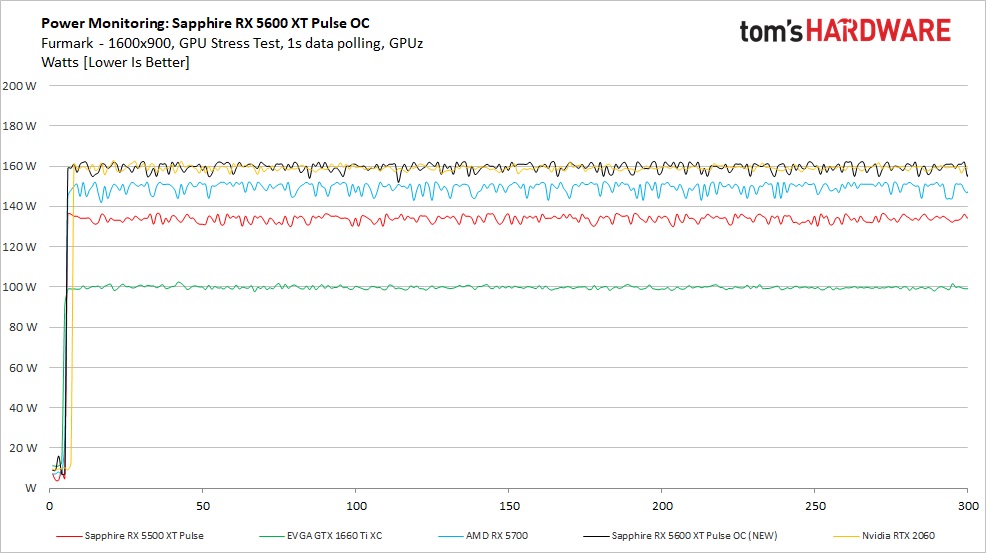
Swapping over to Furmark, here we see the Pulse OC hitting averaging 160W throughout testing, right up against the power limit. As we saw in gaming, chances are you will not run into this value, but now we know where the power limit is set. Just as with the gaming results, the RTX 2060 also uses its power budget up at 160W as well.
Temperatures, Fan Speeds and Clock Rates
In order to see how each video card behaves, like the power testing, we use GPUz logging in one-second intervals to capture data. As with testing for power, testing for these items is also done by looping the Metro: Exodus benchmark five times at Ultra settings running at 2560x1440 resolution.
Additionally, we also used Furmark to capture some of the data below, which offers a more consistent load and uses slightly more power, regardless of the fact that the clock speeds and voltages are limited. These data sets give insight into worst-case situations along with a load other than gaming.
Get Tom's Hardware's best news and in-depth reviews, straight to your inbox.
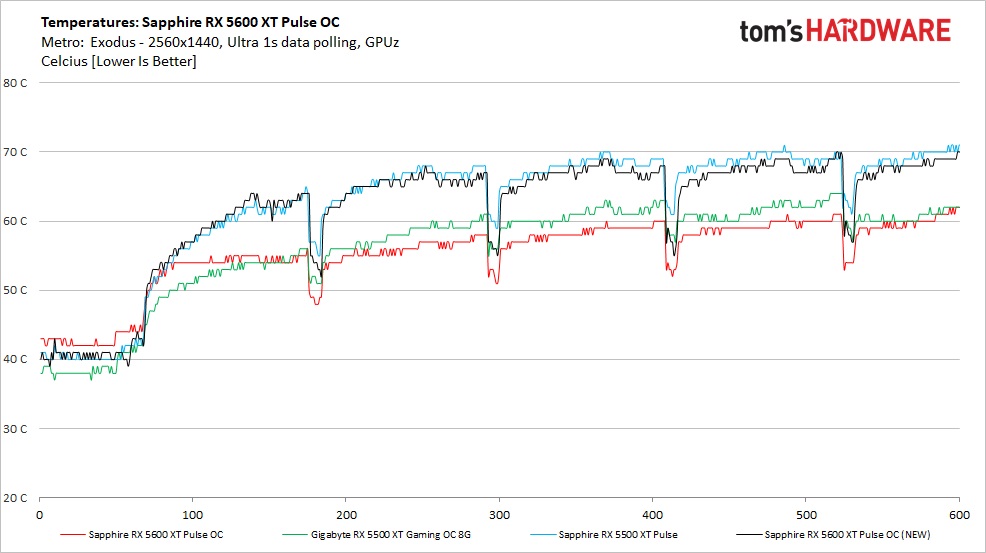
The Dual-X cooler on the Sapphire RX 5600 XT Pulse OC proved plenty capable of keeping the card at 70C or less through our testing. If the test lasted a bit longer, temps would likely still rise, but temperatures were beginning to flatten out.
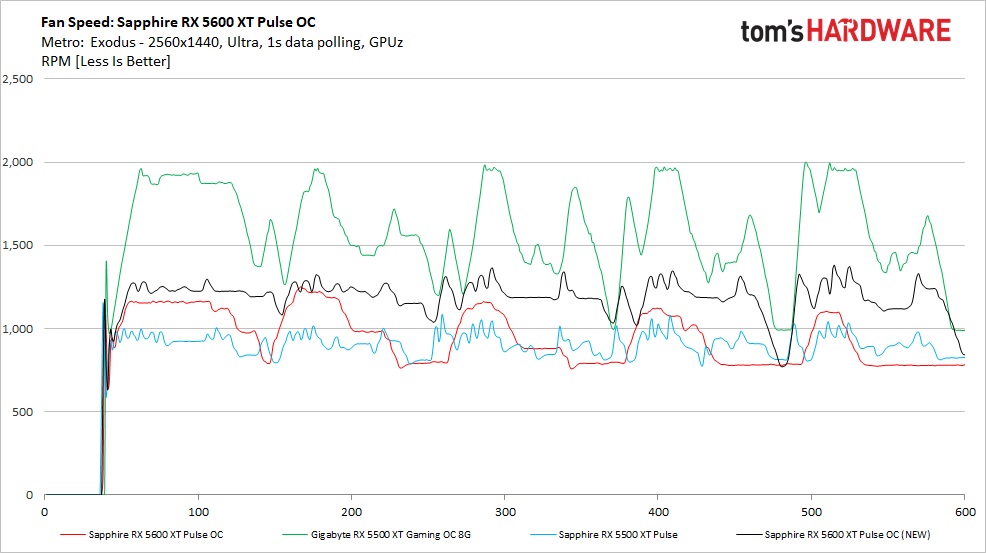
Fan speeds during the game testing varied and ran generally between 1,100 and 1,300 RPM to maintain that 70C temperature we peaked at. The two 90mm fans are generally quiet without harsh acoustics and we did not hear the fan ramping up and down during this testing. The Dual-X cooling solution does a good job managing thermals and not being intrusive while doing so.
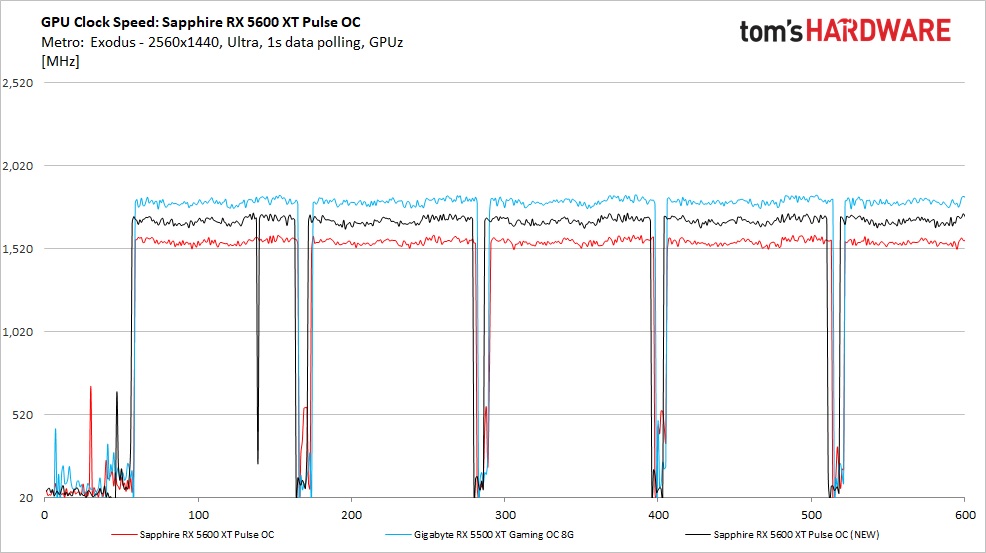
Clock speeds using the OC BIOS averaged almost 1,700 MHz (1,693 Mhz to be exact) during the game testing. Compare this to the reference clocked BIOS’ result of 1,563 MHz during gaming and we can see why the OC BIOS adds so much performance. Of course, the increase in memory speeds certainly adds to it. AMD’s game clock is listed at 1,615 MHz and the 1,693 MHz result is well over their expected clock. We didn’t hit 1,750 MHz boost clock, but as we know by now, this rarely happens.
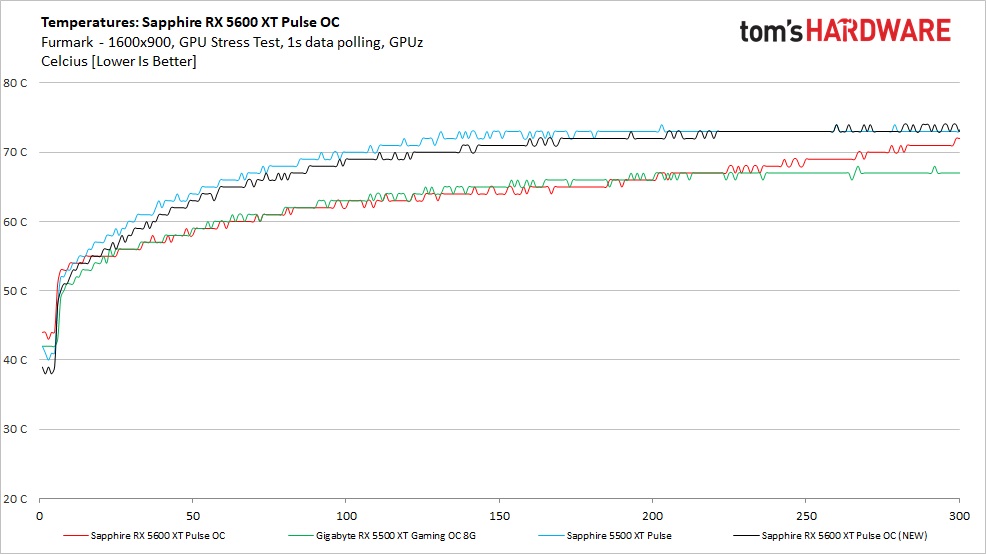
Temperatures when using Furmark didn’t change much, peaking only 3 degrees Celsius higher, at 74C. Just as with gaming, we also see this curve start to really flatten out towards the end of the testing, showing the cooler is just about saturated and temperatures shouldn’t vary much assuming loads and environmentals remain the same.
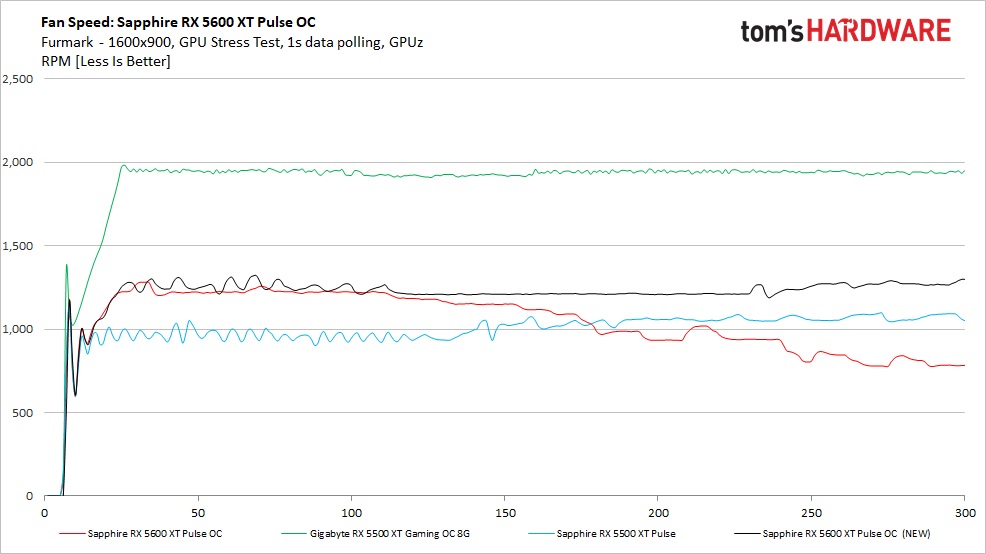
Fan RPM did not change much as the average stayed the same (around 1,200 RPM). Due to the more-consistent loads, we saw a tighter range of speeds, hanging around 1,150 to 1,250 RPM.
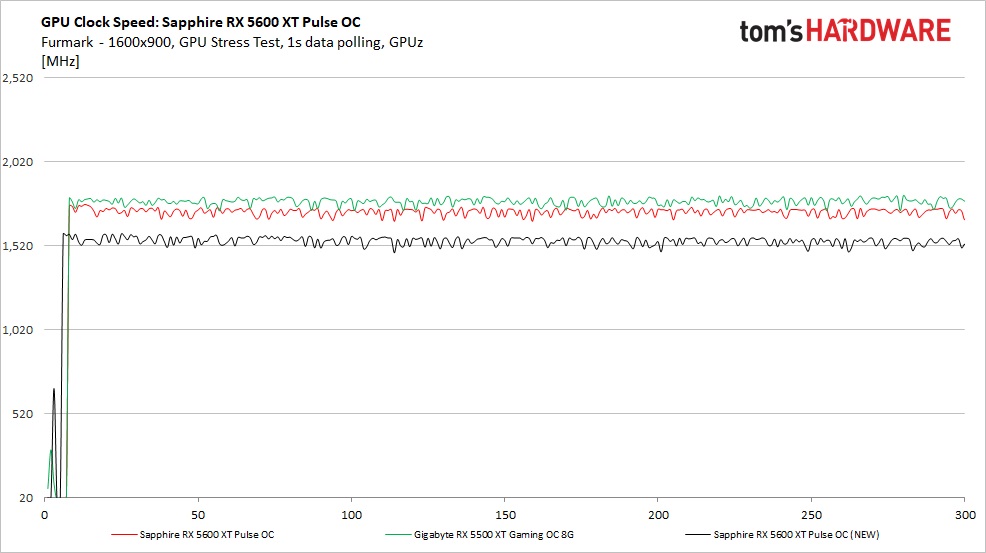
Clock speeds when running Furmark dropped considerably to 1,547 MHz. Compared to other RDNA-based video cards, this was a more significant drop. While in the real world this doesn’t matter for gaming performance, what this does tell us is the card uses every bit of the power allowance it has to reach the higher clocks when gaming. Furmark’s loads are too much at the same clock.
MORE: Best Graphics Cards
MORE: GPU Benchmarks
MORE: All Graphics Content
Current page: Power Consumption, Fan Speeds, Clock Rates and Temperature
Prev Page Performance Results: 2560 x 1440 (Medium) Next Page Software: Sapphire Trixx
Joe Shields is a staff writer at Tom’s Hardware. He reviews motherboards and PC components.
-
logainofhades The Final Fantasy IV 1440p results are in the 1080p page, and the 1080p results are in the 1440p page.Reply -
King_V This was actually better than I expected for the 5600XT, and, as the article stated, was exactly what AMD needed to do. Equaling or outdoing the 2060 while consuming less power was, I think, something Nvidia was not expecting. Nor was I, for that matter.Reply
It's definitely still the target card for my son's upcoming GPU upgrade. More definitively than I would've said prior to testing. -
Zizo007 This shows how efficient Navi is and with a bigger die like Big Navi, performance should surpass the 2080 Ti. In the other hand 7nm Ampere is around the corner so AMD won't have the victory for long if they release Big Navi now.Reply -
g-unit1111 Seems like a pretty awesome card when the only con is "Competing RTX 2060 has been on the market for a year". I may have to pick one of these up!Reply -
cryoburner One thing that's probably worth noting is that all 5600 XTs currently available for sale will perform at least 10% slower out of the box than the results shown here, as they all include the old BIOS, since AMD didn't make that last-minute change until after they shipped to retailers.Reply
So, unless one performs a BIOS update on the card, they are going to be missing out on a lot of performance, at least until new stock starts shipping with the new BIOS. And I suspect most people are not going to be flashing the BIOS of their card, as that's not normally a thing you do with a new graphics card, and is not without risk. Is the card even going to be covered if someone bricks it during the flashing process? Also, as I understand it, the new BIOS only applies to OC models, so models shipping at stock clocks may not receive a BIOS update to the higher clocks, effectively making two versions of the 5600 XT with a 10%+ performance difference between them. It won't be clear which is which just from the product names, and even the OC models may potentially come with the original, substantially slower BIOS, as that's what they all currently use. That certainly makes for a messy launch, and should have probably been mentioned in the review.
This review really should have included performance data for the original BIOS (that comes on the card), which is something the other 5600 XT reviews I've seen so far have done. It seems a bit bizarre that it wouldn't be included in the review, as this is not the kind of performance people will be getting from one of these cards right now, at least without flashing the card's BIOS. -
King_V Replycryoburner said:One thing that's probably worth noting is that all 5600 XTs currently available for sale will perform at least 10% slower out of the box than the results shown here, as they all include the old BIOS, since AMD didn't make that last-minute change until after they shipped to retailers.
So, unless one performs a BIOS update on the card, they are going to be missing out on a lot of performance, at least until new stock starts shipping with the new BIOS. And I suspect most people are not going to be flashing the BIOS of their card, as that's not normally a thing you do with a new graphics card, and is not without risk. Is the card even going to be covered if someone bricks it during the flashing process? Also, as I understand it, the new BIOS only applies to OC models, so models shipping at stock clocks may not receive a BIOS update to the higher clocks, effectively making two versions of the 5600 XT with a 10%+ performance difference between them. It won't be clear which is which just from the product names, and even the OC models may potentially come with the original, substantially slower BIOS, as that's what they all currently use. That certainly makes for a messy launch, and should have probably been mentioned in the review.
This review really should have included performance data for the original BIOS (that comes on the card), which is something the other 5600 XT reviews I've seen so far have done. It seems a bit bizarre that it wouldn't be included in the review, as this is not the kind of performance people will be getting from one of these cards right now, at least without flashing the card's BIOS.
An excellent point - and what I'm seeing from the Anandtech review (not done reading) makes me wonder if the ideal for this card is the original reference clocks, but with the memory boosted to 14GB.
EDIT: I do admit I dislike the messiness. It seems somewhat akin to the RX 560 - 896 vs RX 560 - 1024 issue. Maybe THIS should've been the 5600 vs 5600XT, and if the OEM version has lesser performance than even the 5600 (non-XT), maybe call that 5600 LT?
EDIT 2: a brief look at NewEgg seems to indicate a lot of OC variants having slightly later release dates (Jan 23, Jan 27) with slightly higher prices (289 to 309, vs the 279 for the "base" versions). At least, that's what it seems like. -
shrapnel_indie I see this article is the victim of cut and paste.... the how we tested header refers to the wrong card. How many other mistakes creapt in? Hopefully no more than in the headers used for formatting. Beyond that, THIS is a card to watch, or grab after a BIOS update, for right now.Reply -
TCA_ChinChin Reply
I don't think it's like the Rx 560 issue. That was a fiasco with intentionally misleading advertising similar to GT 1030 crap that Nvidia did. This is just free performance if you do an update. It's a messy and unprofessional launch, but nowhere near the intentionally misleading products of rx560 and gt1030 variants.King_V said:An excellent point - and what I'm seeing from the Anandtech review (not done reading) makes me wonder if the ideal for this card is the original reference clocks, but with the memory boosted to 14GB.
EDIT: I do admit I dislike the messiness. It seems somewhat akin to the RX 560 - 896 vs RX 560 - 1024 issue. Maybe THIS should've been the 5600 vs 5600XT, and if the OEM version has lesser performance than even the 5600 (non-XT), maybe call that 5600 LT?
EDIT 2: a brief look at NewEgg seems to indicate a lot of OC variants having slightly later release dates (Jan 23, Jan 27) with slightly higher prices (289 to 309, vs the 279 for the "base" versions). At least, that's what it seems like. -
TJ Hooker Reply
The thing is we don't know if/when all models will get this update:TCA_ChinChin said:I don't think it's like the Rx 560 issue. That was a fiasco with intentionally misleading advertising similar to GT 1030 crap that Nvidia did. This is just free performance if you do an update. It's a messy and unprofessional launch, but nowhere near the intentionally misleading products of rx560 and gt1030 variants.
https://www.anandtech.com/show/15422/the-amd-radeon-rx-5600-xt-review/2AMD said:The updated VBIOS has been made available to our board partners for inclusion in select OC SKUs at launch.
The Pulse (which has the improved VBIOS) is what was sampled to all the tech sites for review, so that's what people are going to see in reviews/benchmarks, at least for now. But if they go out and buy an RX 5600 XT they could be getting a card that's slower than what they saw in those reviews by a not-insignificant amount. Seems like a pretty good chance people could be misled, whether intentionally or not. -
TCA_ChinChin Reply
I guess we'll see. Like I said though, as of now, the situation is unprofessional, not misleading. It remains to be seem whether or not every model of 5600xt can receive this update. If every model can be updated, then there is no misleading at all, simply an unprofessional launch. If not, then we can say it is misleading and then debate if it was intentional or not.TJ Hooker said:The thing is we don't know if/when all models will get this update:
https://www.anandtech.com/show/15422/the-amd-radeon-rx-5600-xt-review/2
The Pulse (which has the improved VBIOS) is what was sampled to all the tech sites for review, so that's what people are going to see in reviews/benchmarks, at least for now. But if they go out and buy an RX 5600 XT they could be getting a card that's slower than what they saw in those reviews by a not-insignificant amount. Seems like a pretty good chance people could be misled, whether intentionally or not.