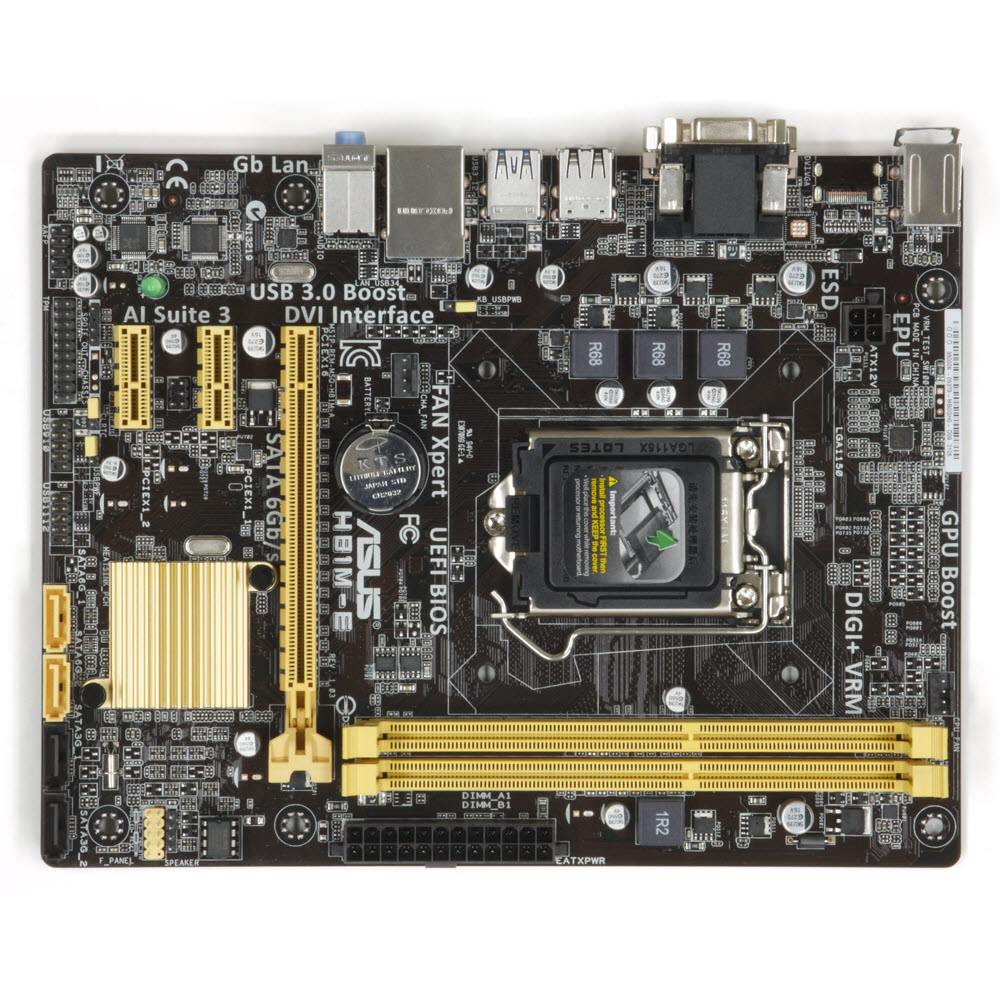
Four LGA-1150 Motherboards Under $60
Here at Tom's Hardware, we have a lot of fun testing the most expensive, highest-end gear. So can we really get excited about $60 motherboards?
Benchmark Results
Why you can trust Tom's Hardware
Motherboard testing comes down to one thing: making sure no one cheats. It's easy for manufacturers to slip hidden enhancements and frequency boosts into the BIOS to give their products an edge. Thankfully, that's rare these days.
Large performance gains are usually due to behind-the-scenes cheats, while significant lagging comes from configuration conflicts. We like to explore both possibilities using our testing suite. Meanwhile, small differences are usually attributable to slight variances in clock rate. We enable all power-saving features, including SpeedStep, and set the RAM to its default rate of 9-9-9-24 at 1333 MT/s.
Synthetics
Synthetic benchmarks are perfect for motherboards because they're written to take advantage of an entire platform. Even if your favorite games don't use every optimized instruction set, synthetics typically do, so they reveal whether any subsystem is artificially boosted or handicapped.
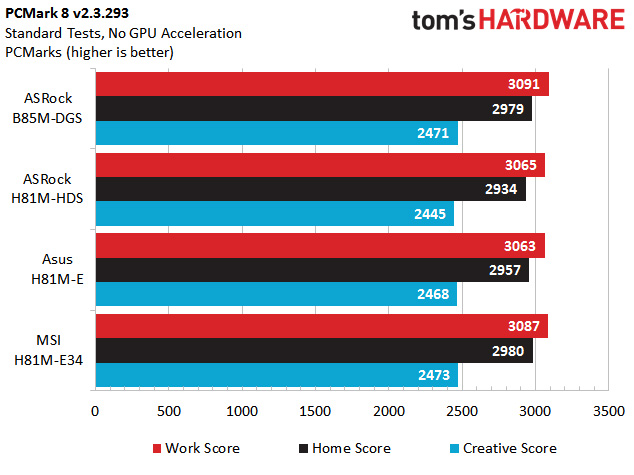
We start off with PCMark 8. The scores fall in as expected, with less than one-percent deviation from the average. This is what we want to see.
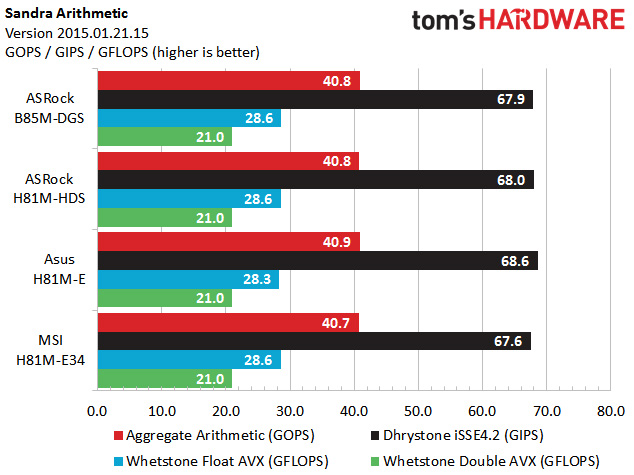
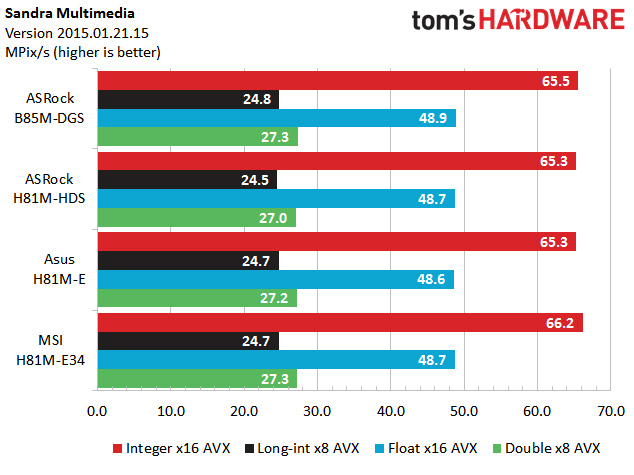
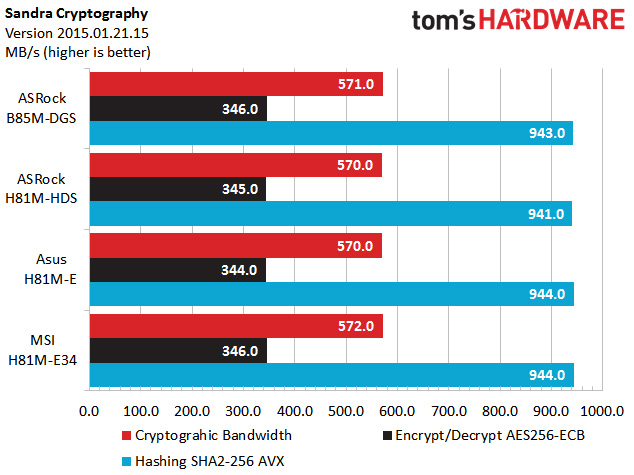
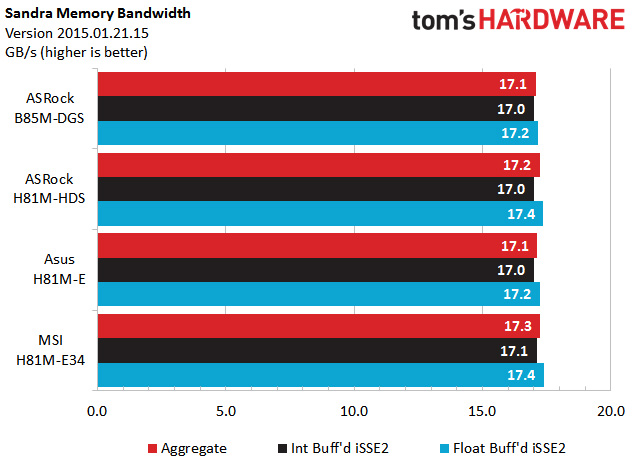
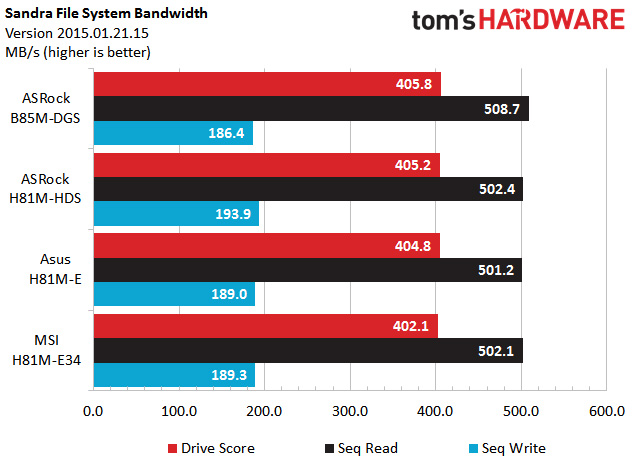
Next up is SiSoftware's Sandra suite. MSI dips ever so slightly in GIPS, but it's well within the margin of error. The story continues through the Multimedia, Cryptography and Memory Bandwidth modules, with all the boards within one percentage point of each other. The B85M-DGS takes a small lead in the sequential read portion of the file system bandwidth test, but also lags slightly behind in sequential writes. Neither result was repeatable, and more runs brought the average more in line with expected results.
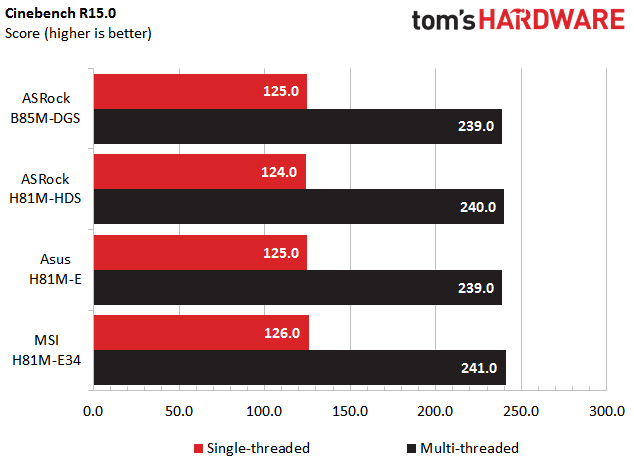
The Cinebench scores are nearly flat. Differences of one point can come from rounding errors or the Asus/MSI board's slight BCLK advantage.
3D And Gaming
Since these are entry-level motherboards equipped with low-end graphics cards, our 3D testing is also constrained to synthetic metrics. The purpose isn't to demonstrate playable performance in any one title, but rather to identify suspect results. As such, synthetic 3D tests serve our goals well.
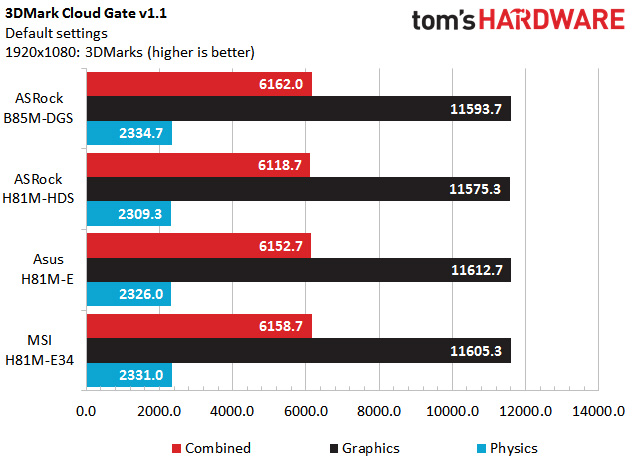
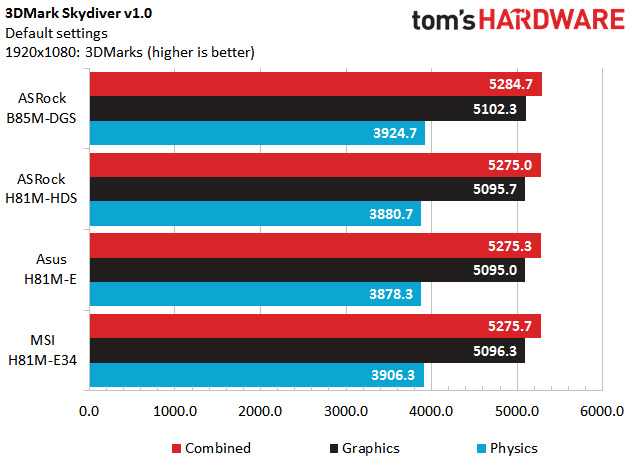
3DMark's Cloud Gate is designed for lower-end gaming systems, making it a great fit. The more demanding Skydiver scene is meant for systems a little above this level. Still, our GeForce GT 730 delivers solid performance. The B85M-DGS establishes an ever-so-slight lead over the other three boards, but it's hardly notable.
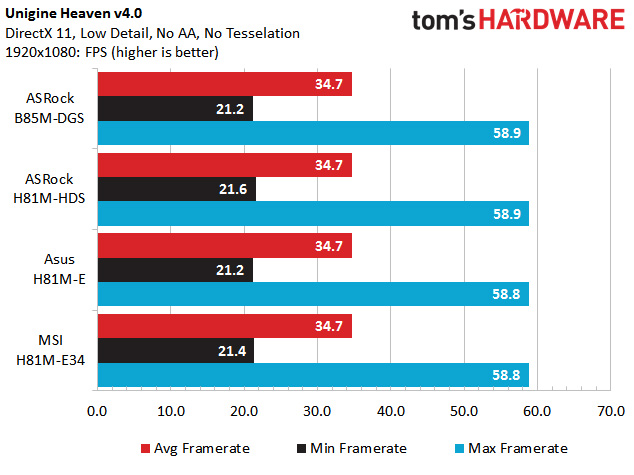
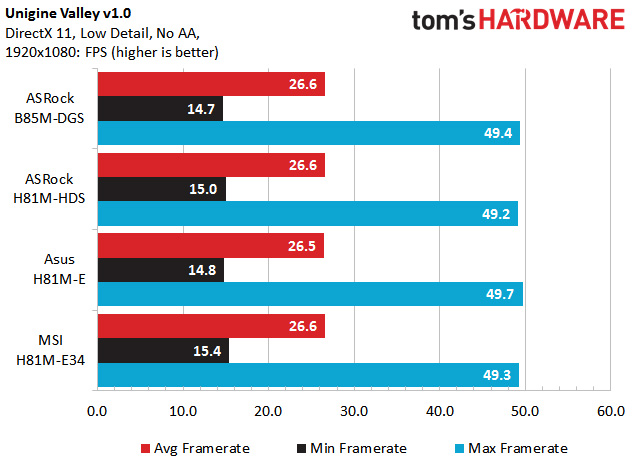
Next up are two Unigine tests. Heaven was the first DirectX 11 benchmark, and it's still useful now. Valley is newer, and it's more graphically demanding due to its wide vistas, forested hills and weather effects. Less than a single frame per second separates the slowest from the fastest performers across both tests.
Heat, Power And Efficiency
Every power-saving feature in each board's BIOS is turned on, fan speed is set to the Standard setting and Windows 8.1 Balanced power profile is enabled.
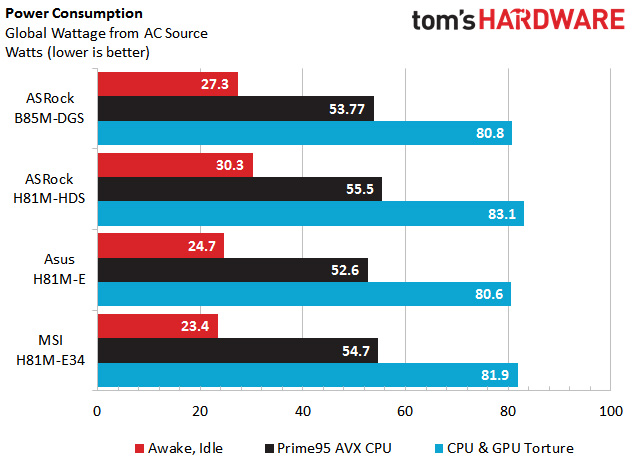
Both ASRock boards burn more power at idle, but the H81M-HDS' result is noticeably higher. Asus' H81M-E sips power by comparison, and the MSI H81M-E34 is our champion when you're not using your computer.
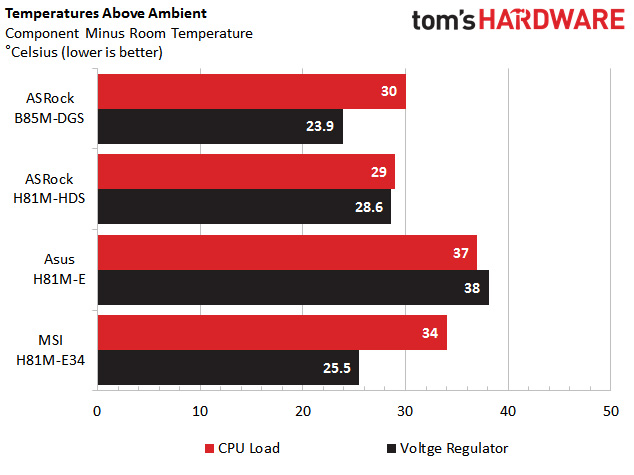
Saving power doesn't help the H81M-E keep its temperature down though; it's the hottest board under load. As I mentioned in the overclocking section, I'm not sure how the VRMs get so toasty when they're underneath the fan. ASRock's B85M-DGS ends up as our winner in the thermal measurements.
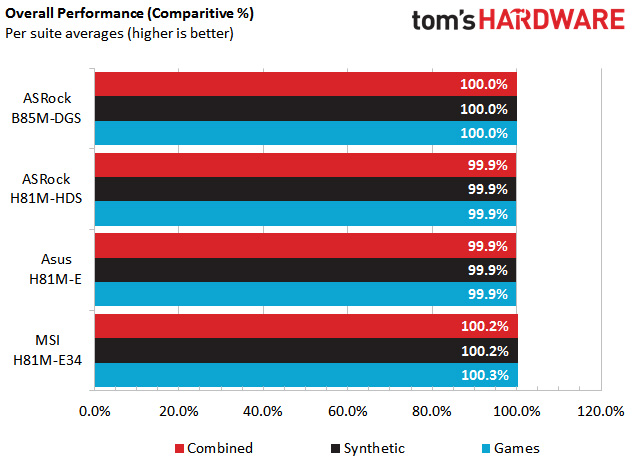
It seems somewhat silly to compare average performance and average efficiency across these boards, since they deliver almost identical benchmark numbers. But we want to stay consistent across our reviews. Dividing a board's score by the average of all the scores for a particular test gives a percentage of how much higher or lower that board scored compared to the others. Averaging them all yields an overall performance score above or below the average. As you can see, less than half a percentage point separates the contenders, and that's what I like to see.
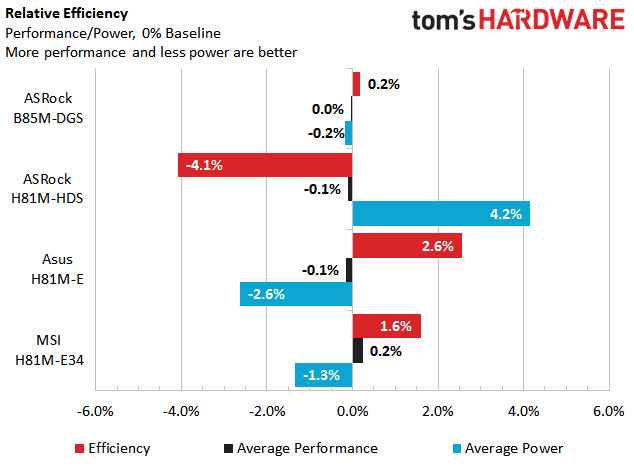
Comparing average performance to average power turns into an efficiency rating as a percentage in relation to the average efficiency of all four boards we tested. Because they do roughly the same amount of work, this basically comes down to the motherboard with the lowest average power draw. ASRock's H81M-HDS loses fairly convincingly due to its higher consumption compared to the other three. Asus' H81M-E, on the other hand, wins with MSI's H81M-E34 finishing a close second. ASRock's other board, the B85M-DGS, is exactly in the middle, and that's not necessarily a bad place to be.
Really, these are all low-power boards with only a few watts separating them. The G3258 is a 53W chip. The average full system draw for all boards during torture tests was only 81.6W, which is less power than a Radeon R7 260X alone under normal gaming loads. Adding any kind of mid-range gaming graphics card would make the delta between our winner and loser almost insignificant.
Get Tom's Hardware's best news and in-depth reviews, straight to your inbox.
-
colinstu on the conclusion page, the the four motherboards with the pros and cons are all mixed up.Reply -
Crashman Reply
Gigabyte doesn't agree with your, or else they would have sent one.15641225 said:The best H81 board IMO, is the DS2V.
I think it's fixed now.15641336 said:on the conclusion page, the the four motherboards with the pros and cons are all mixed up.
Oh, and about his voltage comment in the article, I believe the board he tested is the first in several years on this site to not force a higher-than-set DIMM voltage. -
terion But there is still huge gap between $55 mobos here and 155$+ mobos in "Best Motherboards". Some recommendations in price range in between would be great.Reply
Something with solid power section, lasting capacitors, good component layout, silent, but intended for mainstream gaming, so no M.2, no SLI, single network interface etc. Basic features, but solid foundations. -
Crashman Reply
You mean $60 and $120 boards, right? Because that's the bottom of our current range of Z97 reviews. We get that. We have guys working on it. But to be honest, we wanted to get this article done first15641520 said:But there is still huge gap between $55 mobos here and 155$+ mobos in "Best Motherboards". Some recommendations in price range in between would be great.
Something with solid power section, lasting capacitors, good component layout, silent, but intended for mainstream gaming, so no M.2, no SLI, single network interface etc. Basic features, but solid foundations.
The plan from here is to cover Z97 Micro ATX, then $80 to $120 Z97 boards. We've also gone "sideways" with boards that aren't designed to overclock. And, there's a Z97 Mini ITX article in the publishing queue as we speak :)
And then, after all that has been done, we'd still like to get back to a $120-$160 segment repeat, to cover the new products that have been released since the last round of mainstream LGA 1150. motherboards -
vaughn2k I am still using Core2 Quad Q9650. I can still bear it's power hungry character though... Until I see that there is a big advantage to upgrade, I will stay this way.Reply -
CaedenV ReplyI am still using Core2 Quad Q9650. I can still bear it's power hungry character though... Until I see that there is a big advantage to upgrade, I will stay this way.
It all depends on what you are doing. I had to abandon my C2Q as my main machine a long time ago because it simply choked on bandwidth when doing HD video editing and some games... But it still had a few years left over as my wife's main computer and was perfectly adequate for audio editing, office apps, light games, etc. I eventually replaced her system with an i3 Ivy Bridge setup due to a GPU failure and complaints of the C2Q being too loud in general... so now the C2Q is running as my home server, and will probably remain as my home server for a few years yet until it is a 10 year old chip (and 10GbE becomes more affordable).
Point being, it is an extremely capable 8 year old chip, with a long life ahead of it still. But to say that there is no advantage to upgrading is a bit short-sighted. New chips allow for much smaller silent (or near silent) systems that literally sip power in comparison. New chips have enough iGPU power to compete with some of the midrange dGPUs from 8 years ago... and again as part of the 50-70W CPU package rather than a separate 150-250W GPU card. Not to mention the perks of being able to install faster/cheaper/more RAM with DDR3/4 compared to DDR2, or having lots of SATA3, USB3, and PCIe3 interfaces. Even running as a NAS the Core2Quad is limited to a max of 3TB HDDs where even the cheap motherboards listed here can take 8TB drives if you wanted to. Things like sound cards were still a necessity in the C2Q era, but now onboard audio is so good that even ardent audiophiles would be hard pressed to tell the difference. RAID was a costly feature back in the day, and now it is built into most motherboards (even the B-series chipsets, though it is listed as not having it on the charts here for some reason).
I guess what I am trying to say is: If the older platform still meets your needs, then great! Enjoy it as long as you can, because there is value in that. But saying that the chip and the platform are not starting to show their age, or that there are not lots of advantages in moving to a newer platform (granted those advantages may not directly apply to you) is overlooking a lot of considerations.
