Asus PW191 LCD: Looks Can Deceive
Asus PW191: Mirror, Mirror, Continued
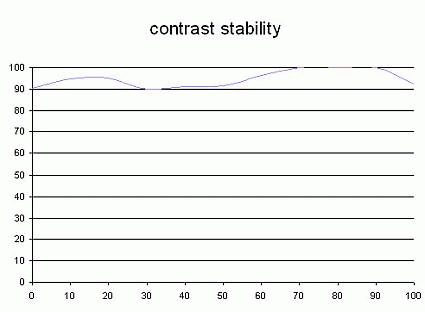
The contrast was fairly stable. The values didn't stray much outside the 90%-100% range, though they were somewhat random.
This curve indicates the contrast value measured at a given brightness adjustment on the OSD. In theory, brightness and contrast are two independent parameters, and good contrast is a requirement regardless of the brightness adjustment. Unfortunately such is not the case in practice.
The brightness and contrast adjustments are shown on the X- and Y-axis', respectively. Contrast is expressed here as a percentage of the maximum value measured using the ANSI test protocol.
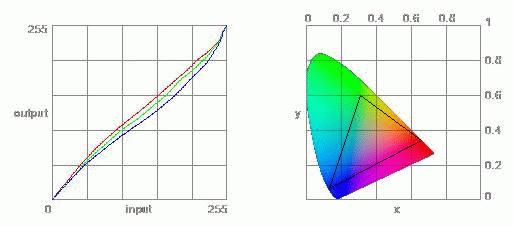
Tested with the Gretag Eye-One Display 2, the PW191wasn't all that impressive. The panel's color range covered the sRGB color space and no more. Looking at the curve on the left, you can see a characteristic S pattern, indicating a gamma problem. That also explains the results of the previous LaCie Blue Eye test.
The color gamut represents the richness of the colors displayed. The corners of the triangle are the primary colors. The surface of the triangle represents all colors that are displayable by combining the three primary colors with more or less intensity for each. So the greater the area of the triangle, the richer the colors.
Get Tom's Hardware's best news and in-depth reviews, straight to your inbox.
Current page: Asus PW191: Mirror, Mirror, Continued
Prev Page Asus PW191: Mirror, Mirror Next Page Spatial Uniformity
