System Builder Marathon, Sept. 2011: System Value Compared
Average Performance And Efficiency
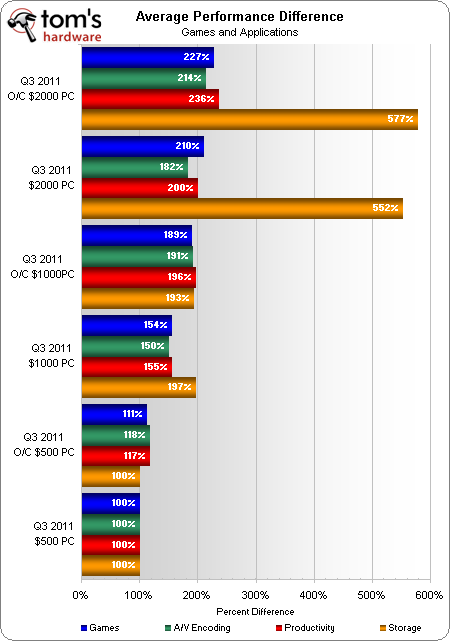
The $1000 build’s 30 GB SSD is far too small to hold all of today’s benchmarks, so its performance doesn’t represent what a real-world user would see from our entire benchmark suite. Since it’s only capable of holding around 40% of the programs we used for our benchmarks, multiplying its score by 0.4 would have been easy. On the other hand, choosing such a low number negates the performance of its Western Digital Caviar Black secondary drive, which was used to store the remaining programs.
Based on previous benchmarks using the same Western Digital Caviar Black, we estimate that its secondary drive is worth around 20% of the score shown by the same system. So, rather than give it only 40% of its reported performance, this editor chose to use 50%.
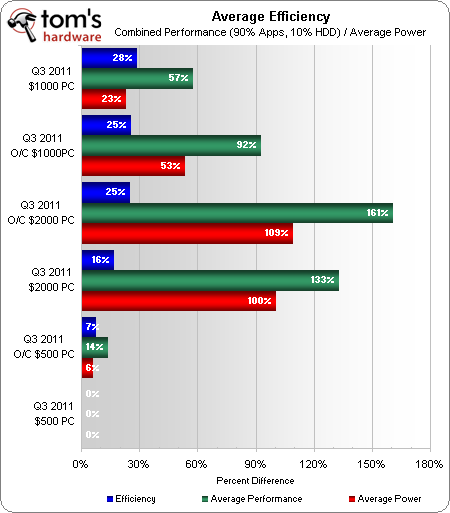
We used -1 in all of the efficiency chart’s bars to set the slowest system as the baseline. For example, the overclocked $500 configuration’s 7% efficiency gain is shown as 7% rather than 107%, and the $1000 PC's 57% performance advantage (over the $500 baseline) is shown as 57%, rather than 157%.
Even with its exaggerated hard drive score knocked down by 50%, the $1000 machine takes a big lead in efficiency over its $500 rival. Value, on the other hand, is a subject that’s worth its own page in this review. A low-voltage overclock allows the $2000 PC to gain efficiency at the higher frequency, though it never catches its $1000 challenger.
Current page: Average Performance And Efficiency
Prev Page Power And Heat Next Page Crowning A Value PC WinnerGet Tom's Hardware's best news and in-depth reviews, straight to your inbox.
-
revjacob Actually what we need now are more affordable 2560x1600 monitors for these enthusiast PCs.Reply -
compton I think the next quarter SBM should utilize an SSD at all segments. Its just about time when no one should seriously think of not including a SSD a build. There are great values out there and even the budget system deserves some love. If a small increase in price segments is necessary, so be it. Going from a HDD to a SSD is like going from IGP to discrete class graphics.Reply
Also, as a result, more emphasis should be placed on the storage sub system. I know these are gaming configurations, but I'd give up my GPU in a nanosecond if it meant I could keep my SSDs. Fortunately, I don't have to choose, but I would if I had too, and I'm not alone out there. Budget systems don't feel so budget-y with even a modest SSD. -
chumly Maybe the value of the $1000 PC would go up if you weren't wasting money on unnecessary or poorly chosen parts. You could add another 4 GB of ram, and swap out the twin stuttering 460's for 6870's (and still have enough money to add a better, modular PSU).Reply
Here:
http://i.imgur.com/g22Bq.jpg -
jprahman comptonI think the next quarter SBM should utilize an SSD at all segments. Its just about time when no one should seriously think of not including a SSD a build.Reply
Yeah, good luck fitting an SSD into a $500 gaming build.
-
Kamab jprahmanYeah, good luck fitting an SSD into a $500 gaming build.Reply
there have been 64GB Vertex Crucial drives on sale for < 79$. Which isn't bad. -
compton jprahmanYeah, good luck fitting an SSD into a $500 gaming build.Reply
That's why I think the $500 system should be closer to $600, maybe like $550. 30GB Agility drives were going for $40 yesterday at the Egg, so its not like you have to spend $300 to get a tangible benefit. That one addition would have contributed a significant performance benefit and the budget category used to be $650 anyway. -
nd22 I would have stick to 1 gpu in the 1000 S build. Instead of 2 gf 460/radeon 6850 I would have used 1 radeon 6970/ geforce gtx570 - from persoanl experience 1 gpu = less problems!Reply -
mayankleoboy1 i think quicksync should be included in the final score as video conversion is something that everyone of us do. and if we buy a SB cpu, then we would surely use quicksync.Reply
maybe also include windows boot time.


