Crucial P1 NVMe SSD Review: QLC Flash Gone Mild (Updated)
Why you can trust Tom's Hardware
500GB Performance Results
Comparison Products
Going up against the 500GB Crucial P1, we have a few popular competitors. Starting off, the MyDigitalSSD BPX Pro and Gigabyte Aorus RGB both feature Phison E12 NVMe controllers and 64L Toshiba TLC NAND. As well, we have the Adata XPG SX8200 and Intel SSD 760P, which both feature Silicon Motion SM2262 NVMe controllers and IMFT 64L TLC NAND. Additionally, we threw in the Samsung 970 EVO Plus, which has their Phoenix NVMe controller and the Samsung 860 EVO, a SATA based SSD for referencing. Finally, we added a PCIe 3.0 x2 device, the MyDigitalSSD SBX, to see just how much better the P1 can be with its PCIe 3.0 x4 link.
Trace Testing – PCMark 8 Storage Test 2.0
PCMark 8 is a trace-based benchmark that uses Microsoft Office, Adobe Creative Suite, World of Warcraft, and Battlefield 3 to measure the performance of storage devices in real-world scenarios.
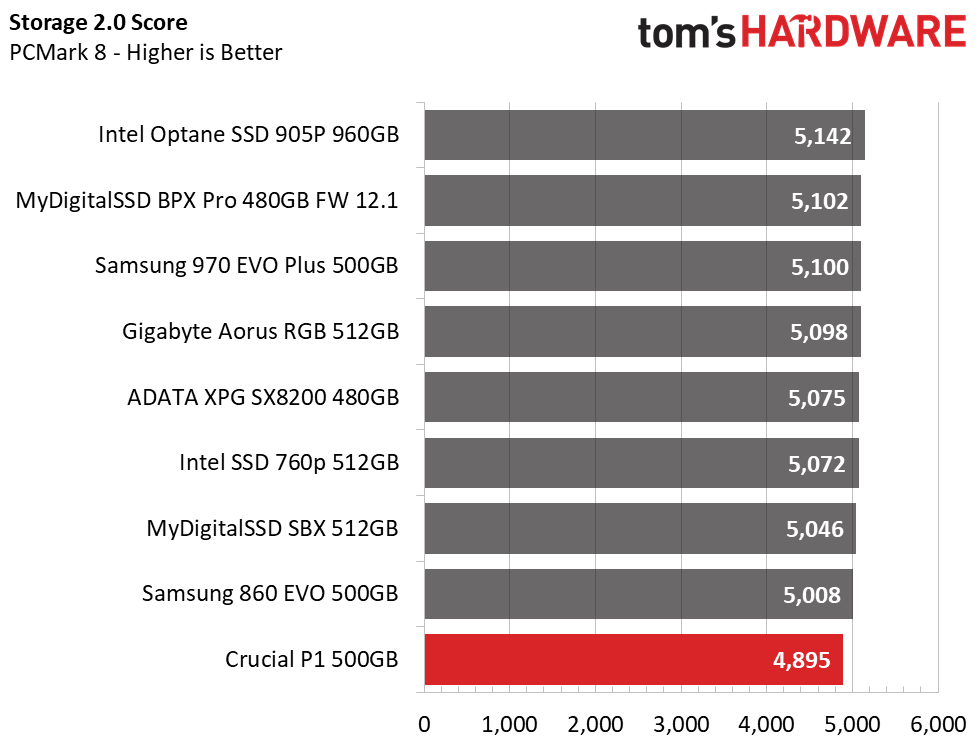
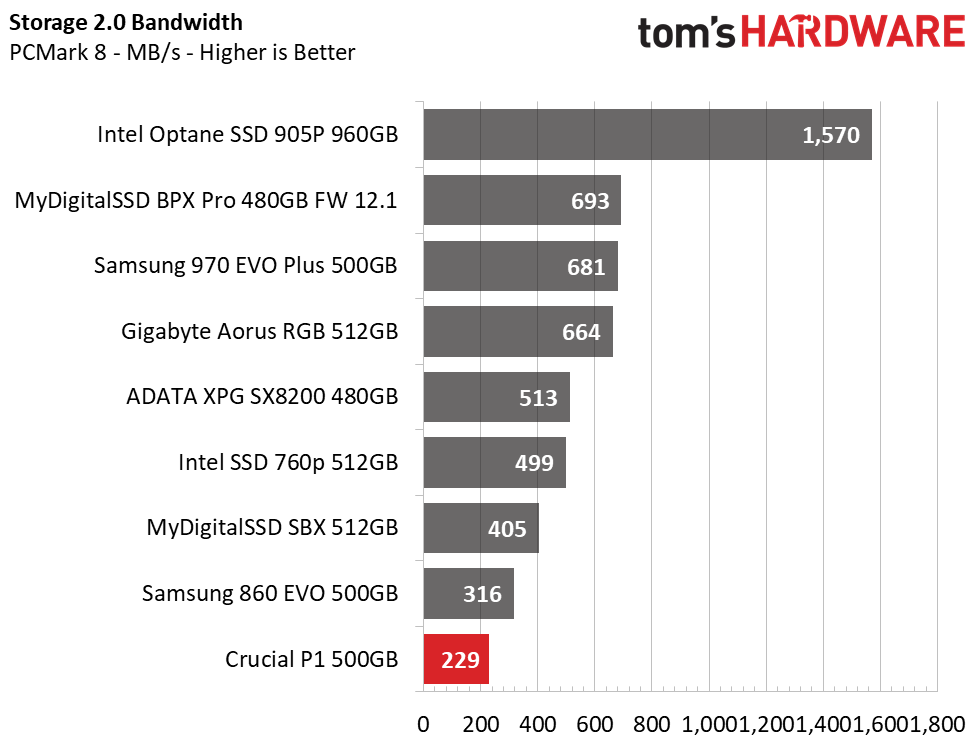
Crucial’s P1 scored the lowest out of the bunch here. With a total score of 4895 points and an average bandwidth of 229MB/s, performance is even less than the SATA based Samsung 860 EVO. The QLC NAND isn’t looking too good. This NAND and a rather expedited SLC cache folding algorithm are what are keeping the P1 from scoring higher.
Game Scene Loading - Final Fantasy XIV
The Final Fantasy XIV StormBlood benchmark is a free real-world game benchmark that easily and accurately compares game load times without the inaccuracy of using a stopwatch.
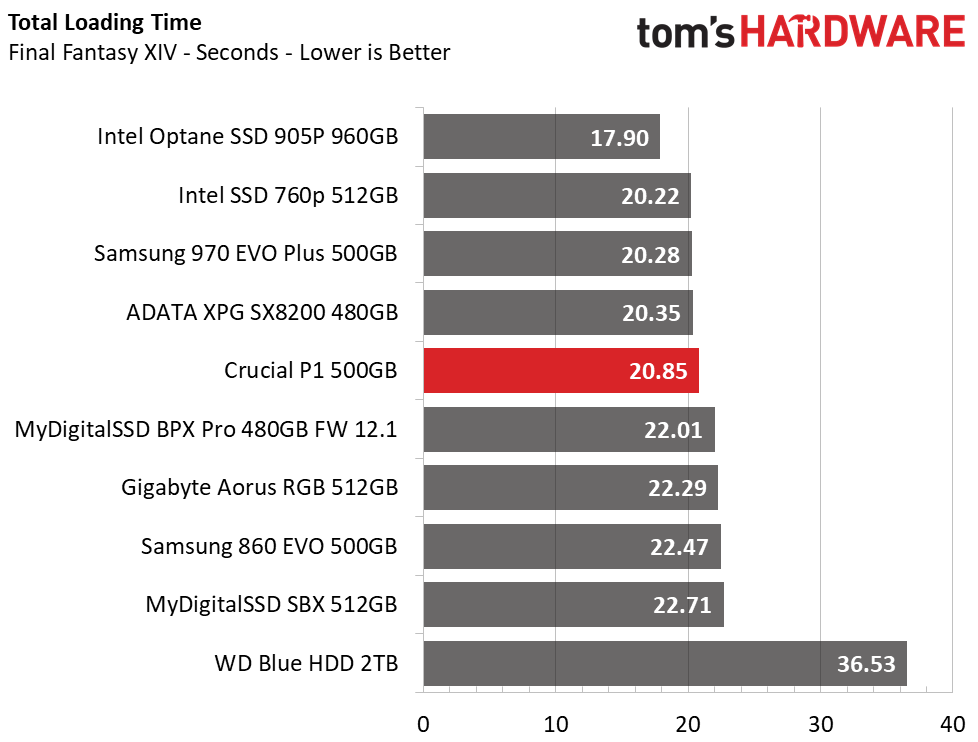
Game load time is rather good for the , on the other hand. While it wasn’t able to outperform the 860 EVO in PCMark 8, our Final Fantasy load time benchmark shows a rather speedy result of 20.85 seconds. This ranks it 5th overall and proves that the P1’s PCIe NVMe interface can deliver improved performance over its SATA based competition at game loading, though it isn’t as drastic as an SSD vs HDD.
Transfer Rates – DiskBench
We use the DiskBench storage benchmarking tool to test file transfer performance with our own custom 50GB block of data. Our data set includes 31,227 files of various types, like pictures, PDFs, and videos. We copy the files to a new folder and then follow up with a read test of a newly-written 6 GB file.
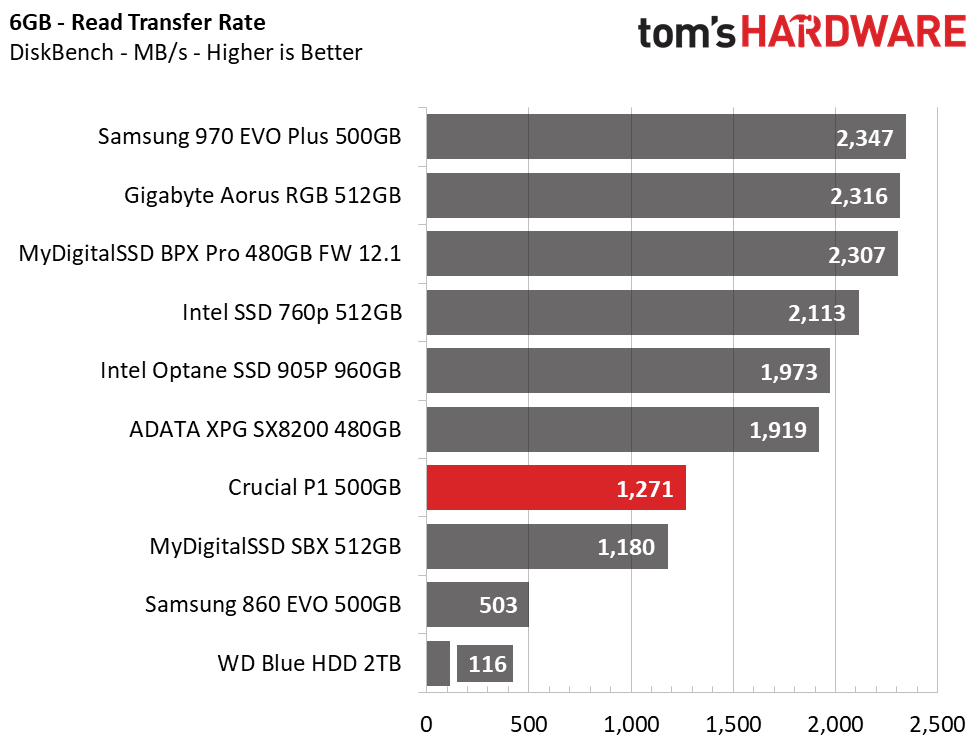
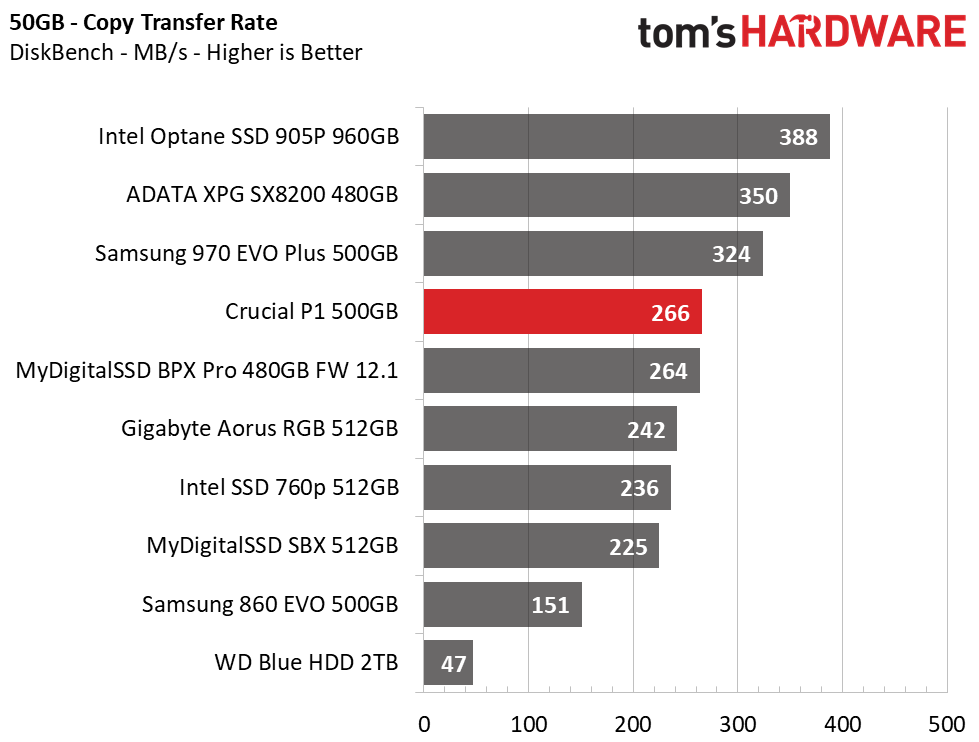
As well as performing well in our game load test, Crucial’s P1 performs well in our real-world file copy and read tests, though there is some room for improvement. The SLC cache was enough to handle our 50GB file folder and rank it fourth overall on our chart. The 6GB read test shows performance that is more than double what SATA SSDs are capable of, but is much lower than many of the better-performing NVMe competitors.
Get Tom's Hardware's best news and in-depth reviews, straight to your inbox.
SYSmark 2014 SE
Like PCMark, SYSmark uses real applications to measure system performance. SYSmark takes things much further, however. It utilizes fourteen different applications to run real workloads with real data sets to measure how overall system performance impacts the user experience. BAPCo's SYSmark 2014 SE installs a full suite of applications for its tests, which includes Microsoft Office, Google Chrome, Corel WinZip, several Adobe software applications, and GIMP. That also makes it a great test to measure the amount of time it takes to install widely-used programs after you install a fresh operating system.
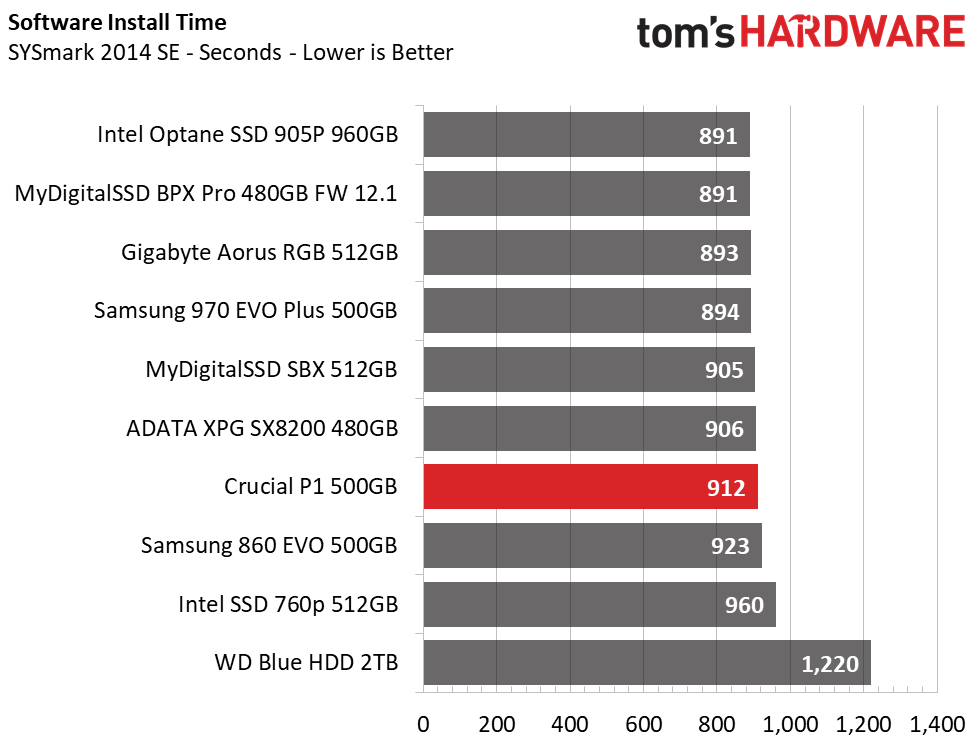
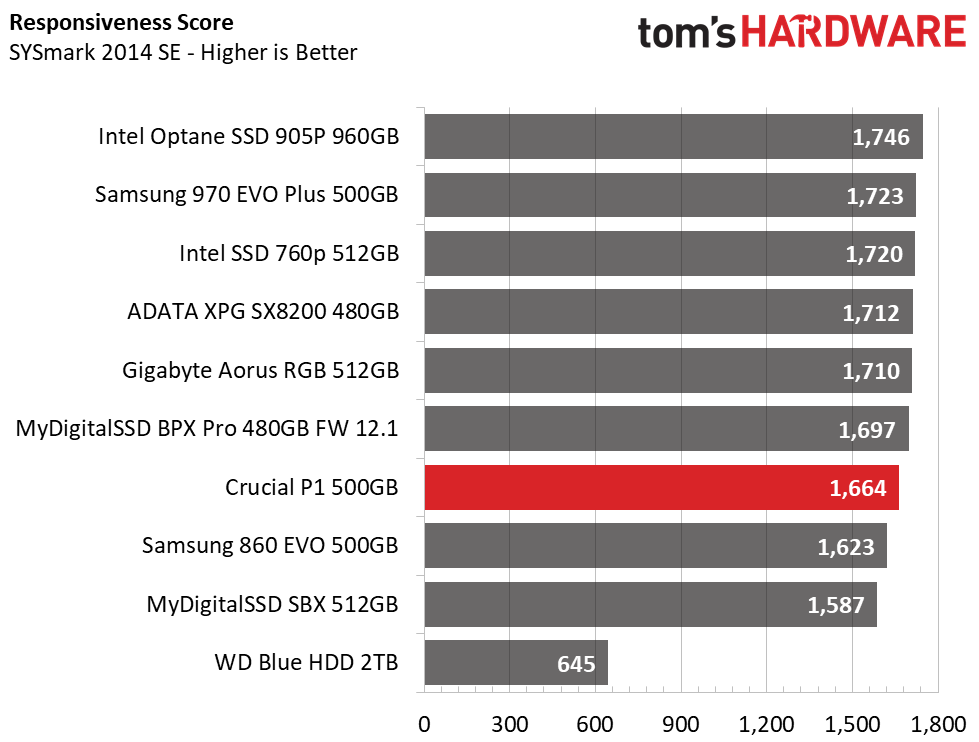
The Crucial P1 took a bit longer to install SYSmark than competing NVMe SSDs, but not by much. With a total install time of 15 minutes and 12 seconds, it ranks ahead of the Samsung 860 EVO and surprisingly, the Intel SSD 760P. After the initial installation, however, the Intel SSD 760P scored very well. The P1 on the other hand, scored a little better than the 860 EVO, but much more responsive than the MyDigitalSSD SBX.
ATTO
ATTO is a simple and free application that SSD vendors commonly use to assign sequential performance specifications to their products. It also gives us insight into how the device handles different file sizes.
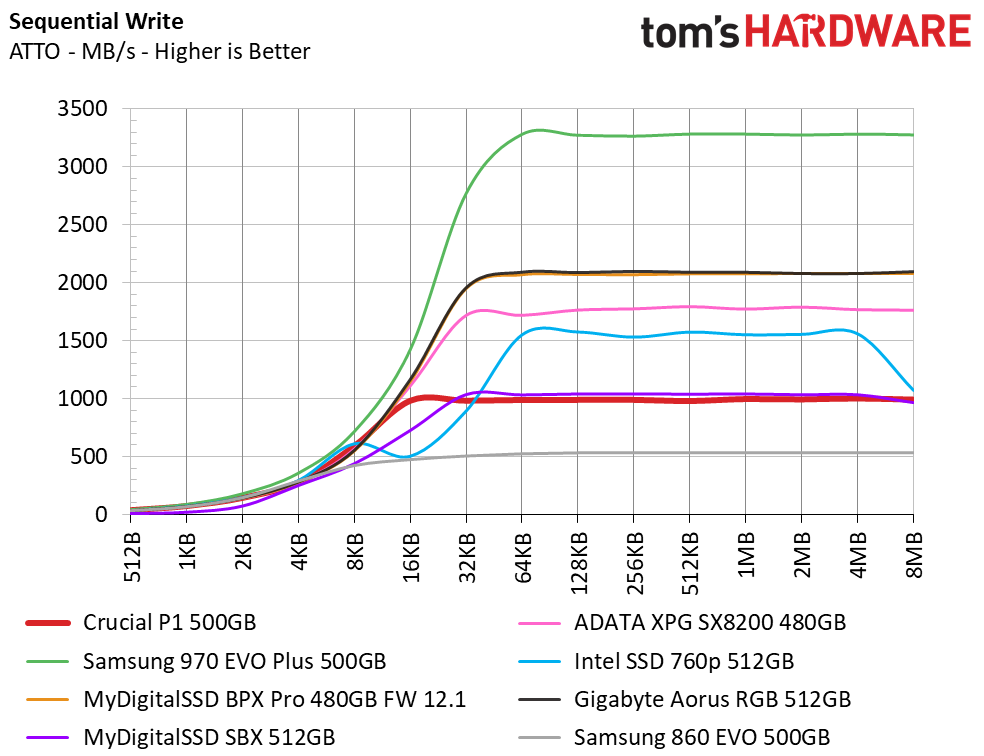
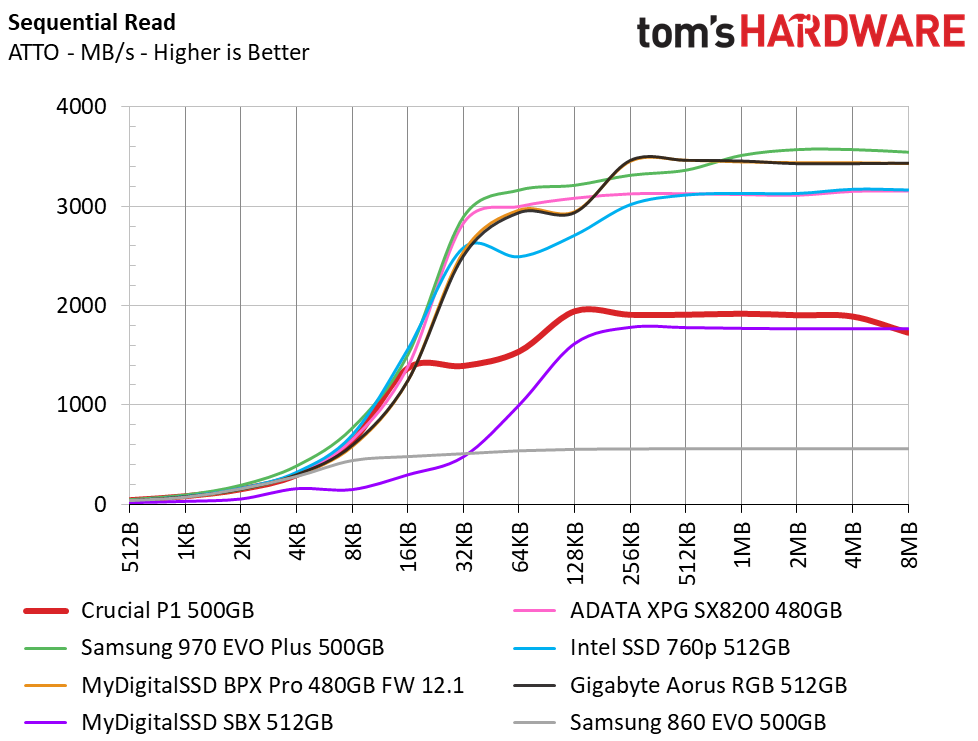
The Crucial P1 hit its sequential performance specs of 1.9/1GB/s read/write in its ATTO run. It did rather well with smaller files too. Compared to the MyDigitalSSD SBX, the performance difference is almost night and day on the ramp-up curve. While the P1 is in line with most competitors up until the 16KB file size, the SBX lags far behind until it hits the 128KB file size.
CrystalDiskMark
CrystalDiskMark (CDM) is a simple and easy to use file size benchmarking tool.
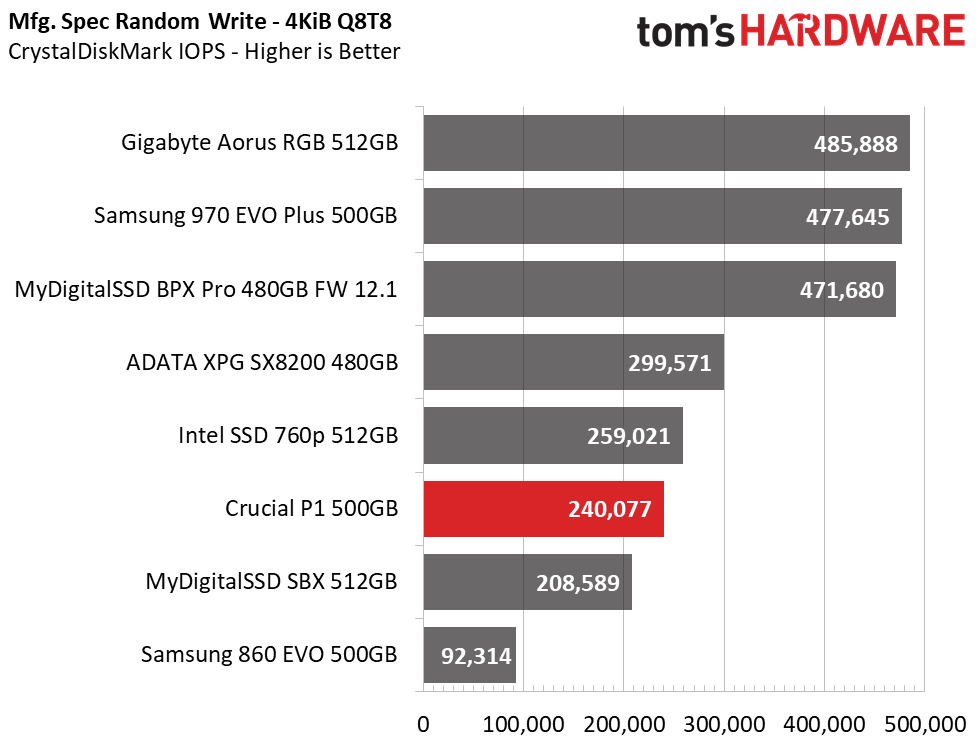
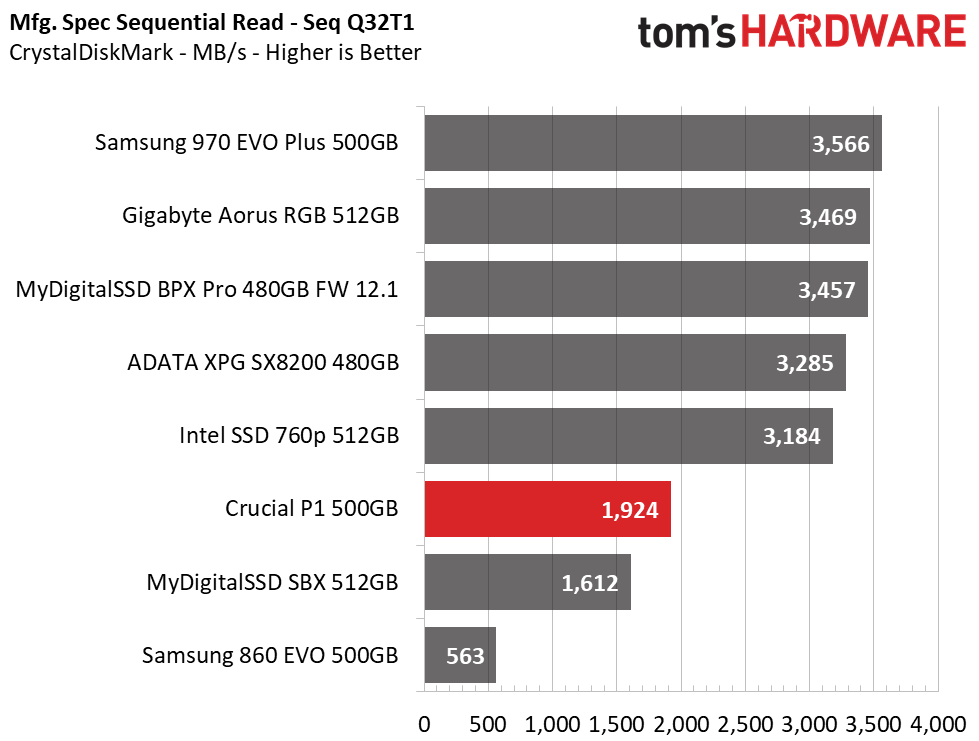
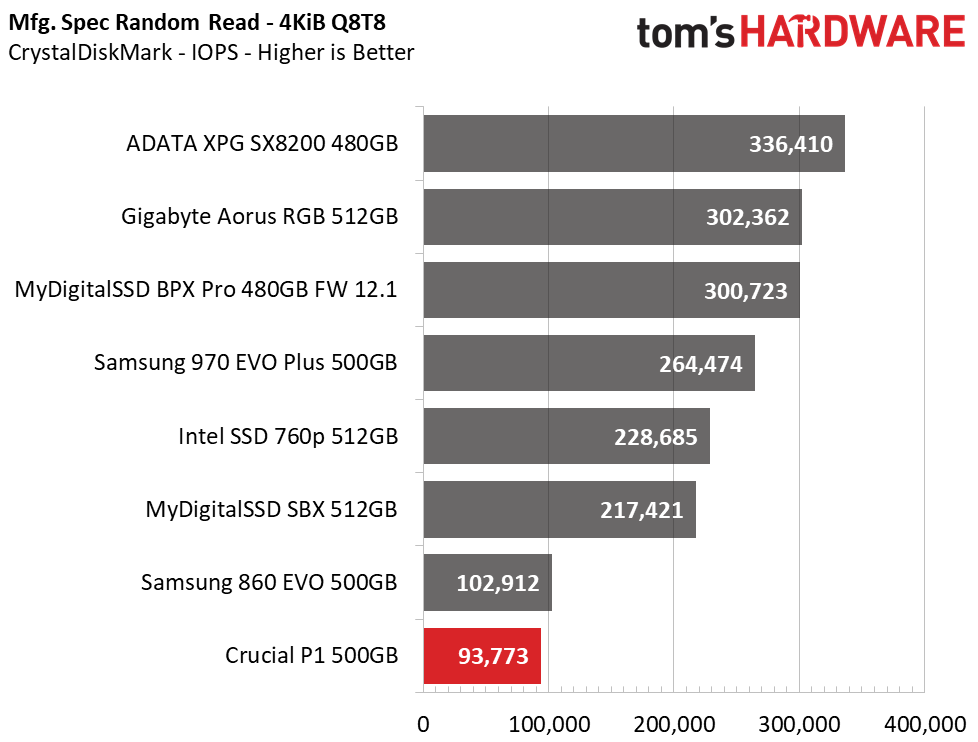
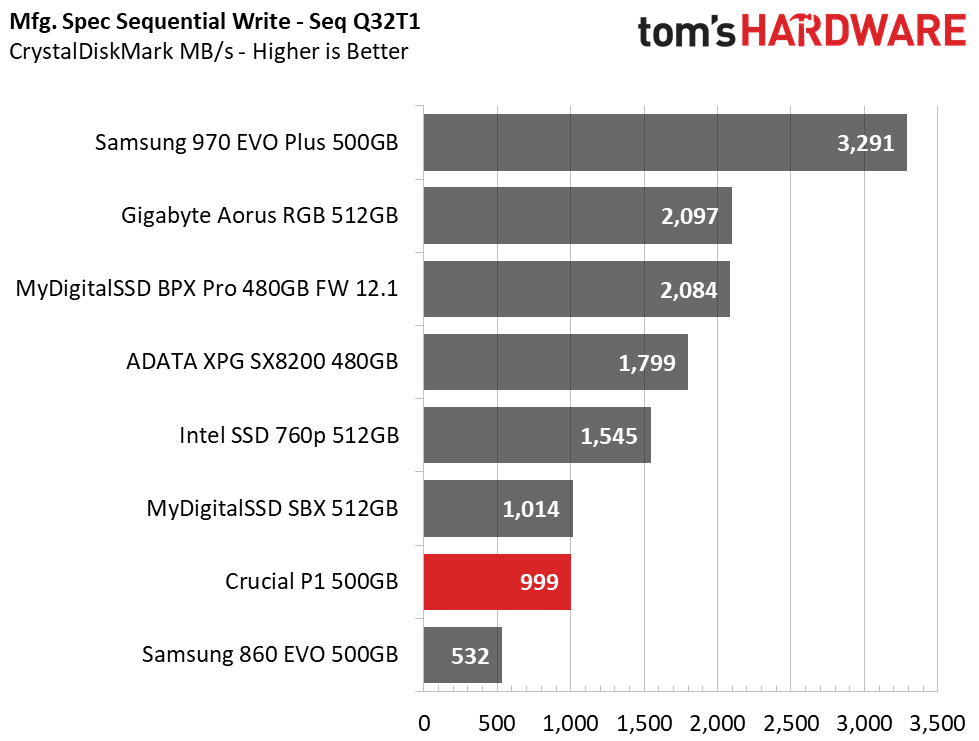
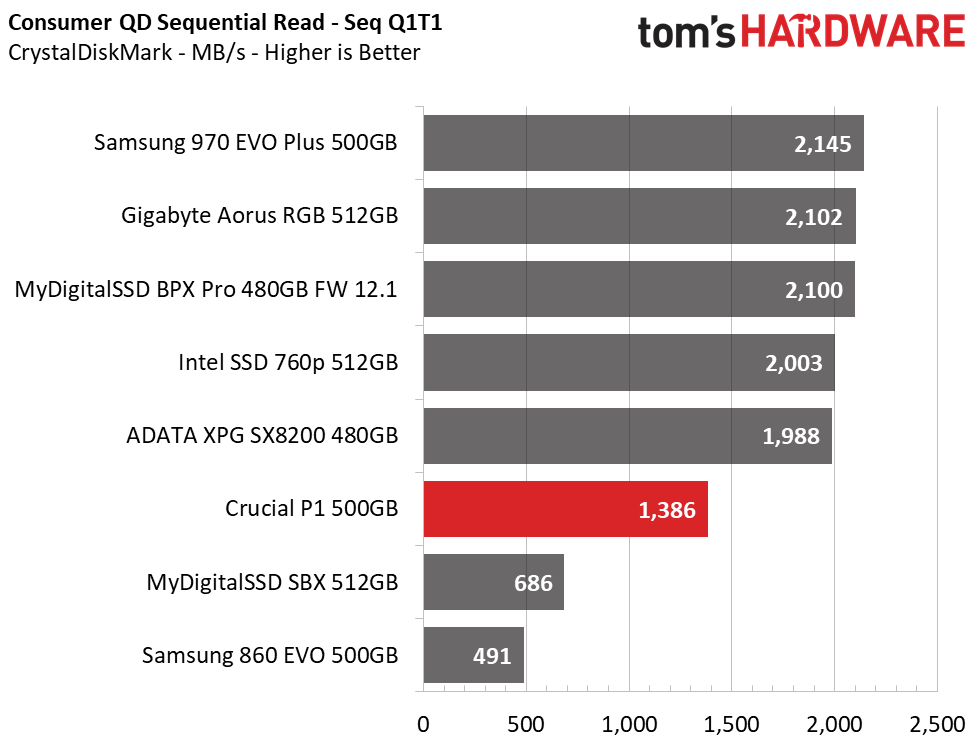
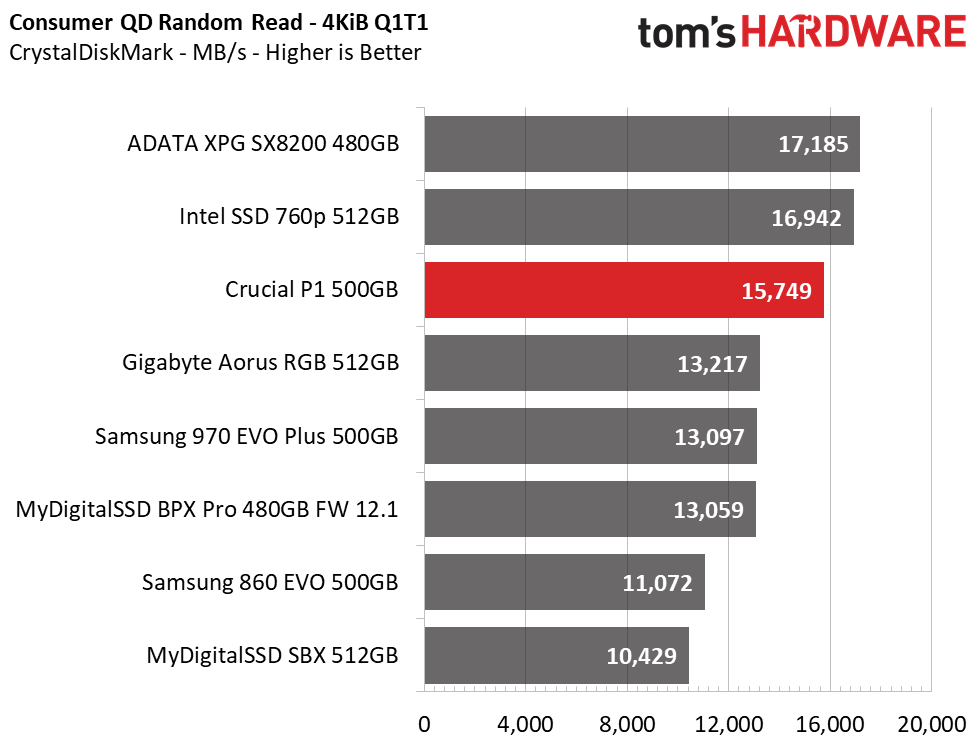
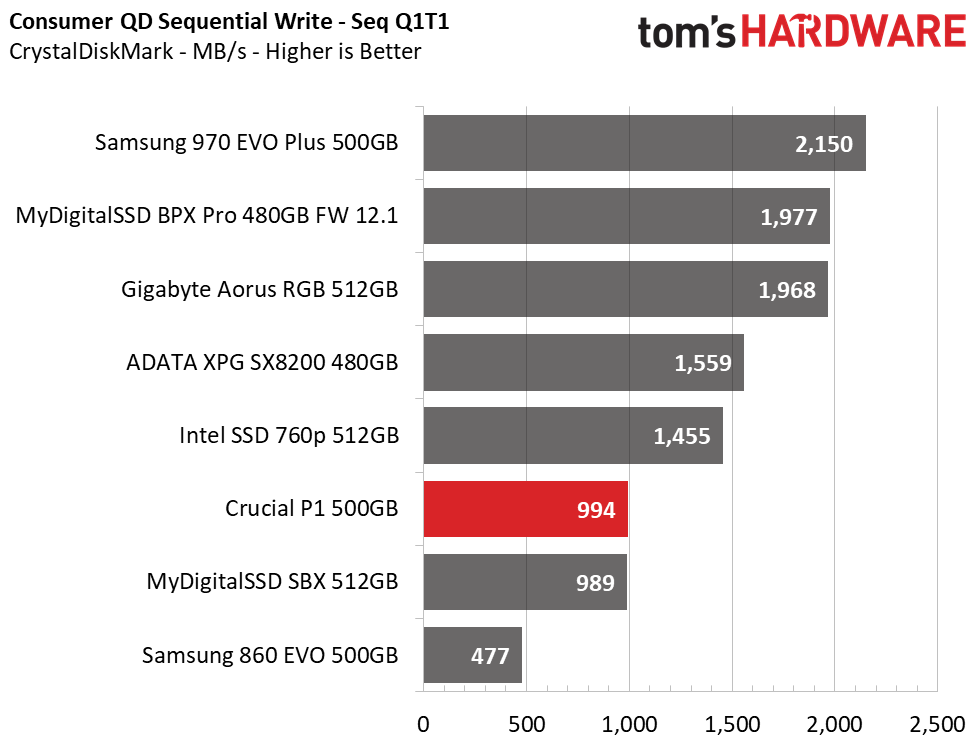
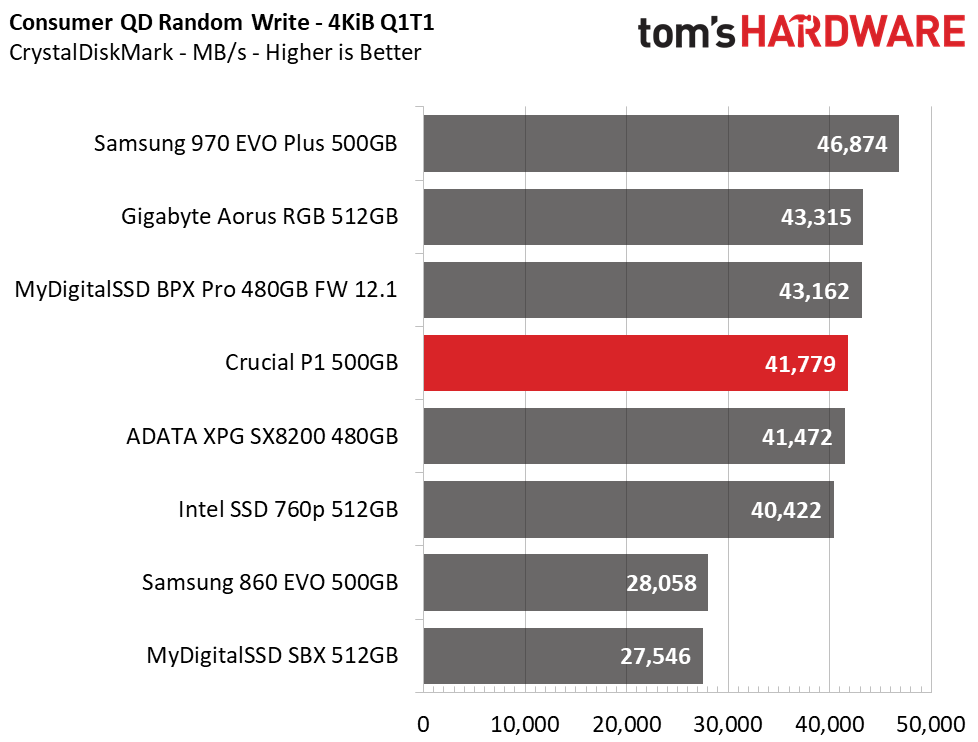
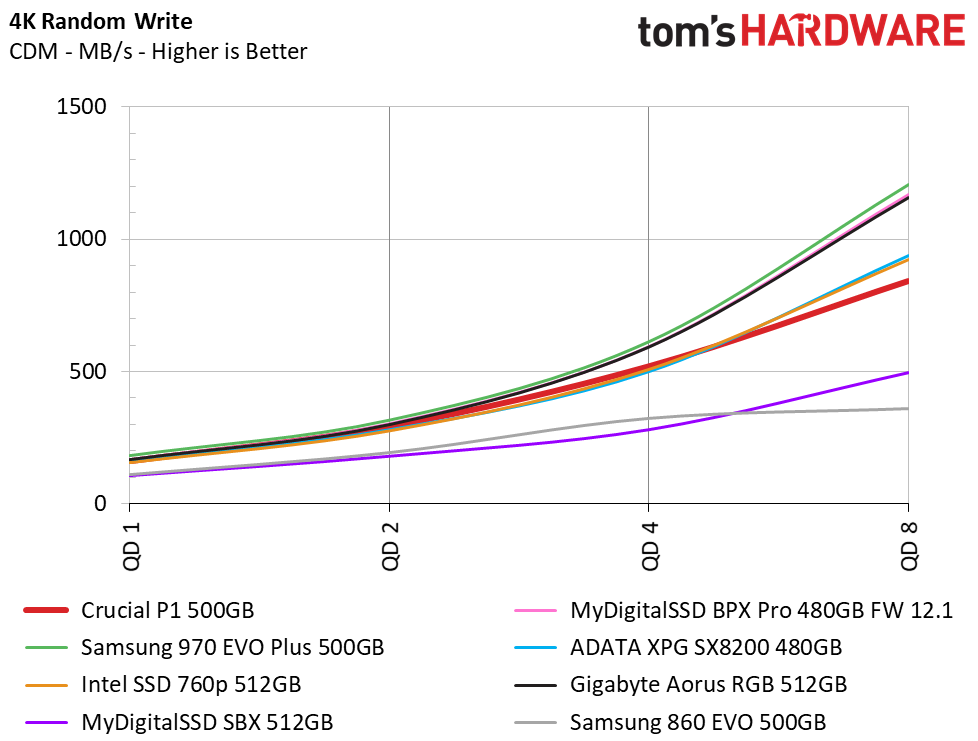
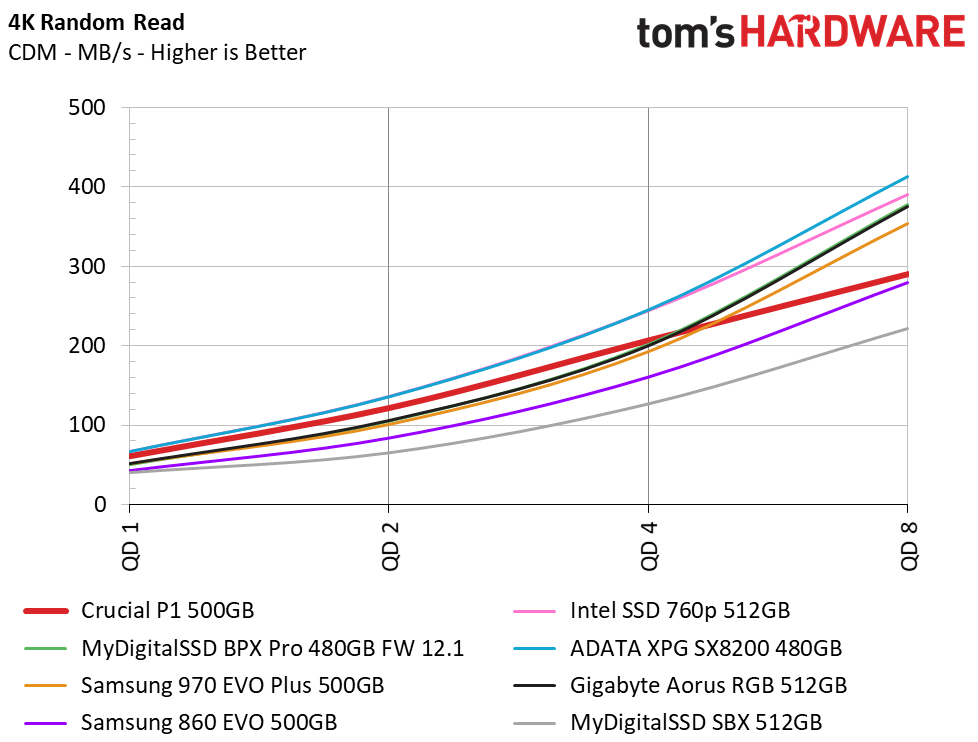
As we saw in ATTO, the Crucial P1 delivers similar performance numbers of 1.9/1GB/s in CDM. This is at a rather high QD of 32, so, pulling things back down to a QD of 1 reveal a bit lower read performance, 1.4GB/s, but basically, the same 1GB/s write performance.
Looking to 4K random speeds, we hit 93K IOPS read and 240K IOPS write at a QD of 64. Testing at a more realistic QD of 1 shows performance numbers of nearly 16K IOPS read and 42K IOPS write. This is rather impressive and proves to be a good margin better than the Phison E12 powered SSDs. It even outperforms the ever so expensive 970 EVO Plus in read performance.
Sustained Sequential Write Performance
Official write specifications are only part of the performance picture. Most SSD makers implement an SLC cache buffer, which is a fast area of SLC-programmed flash that absorbs incoming data. Sustained write speeds can suffer tremendously once the workload spills outside of the SLC cache and into the "native" TLC or QLC flash. We hammer the SSDs with sequential writes for 15 minutes to measure both the size of the SLC buffer and performance after the buffer is saturated.
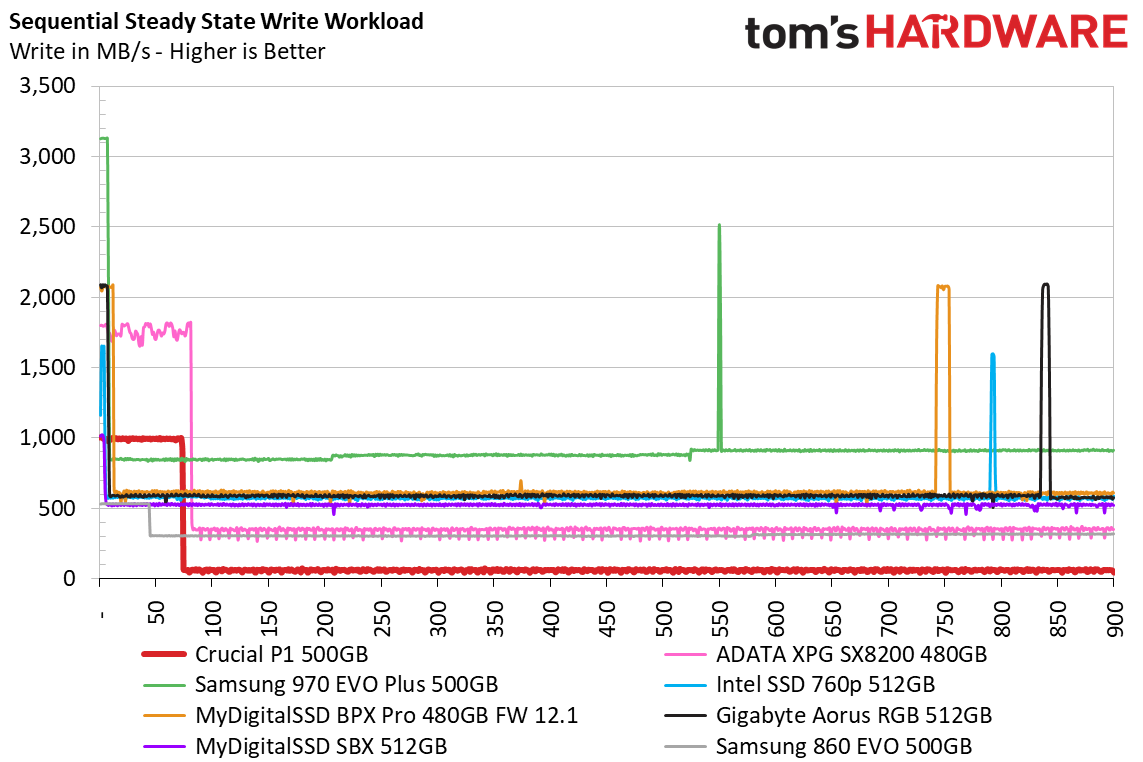
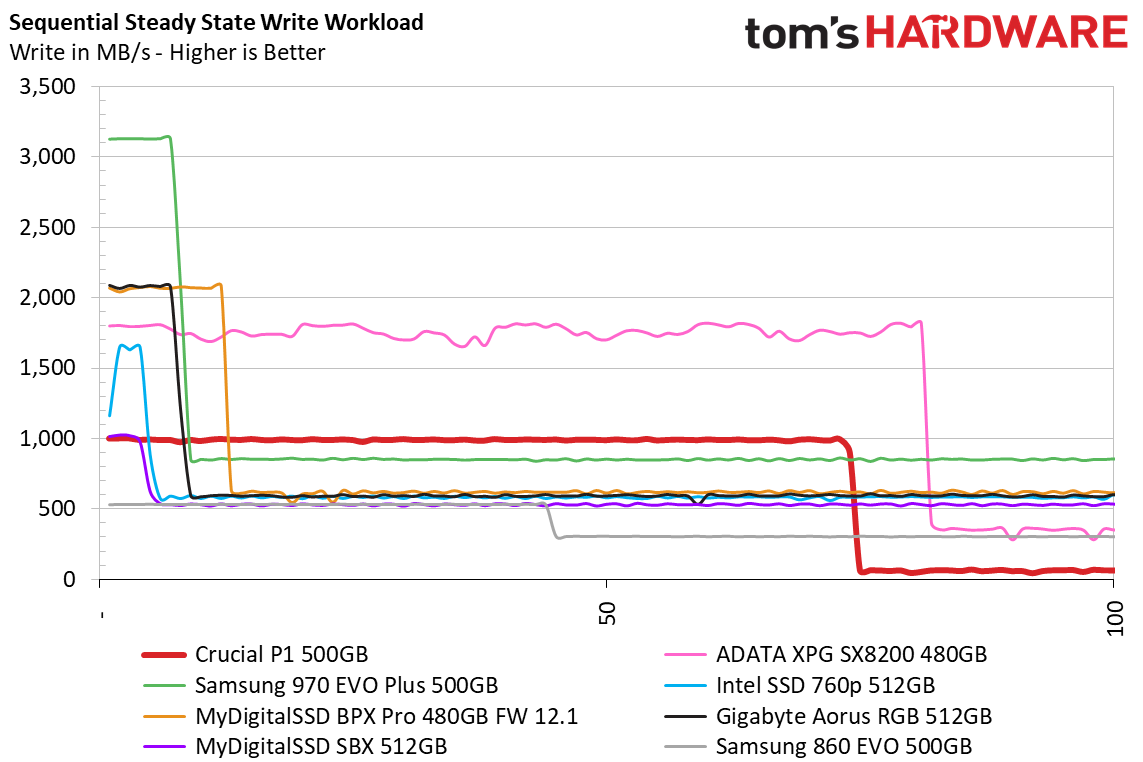
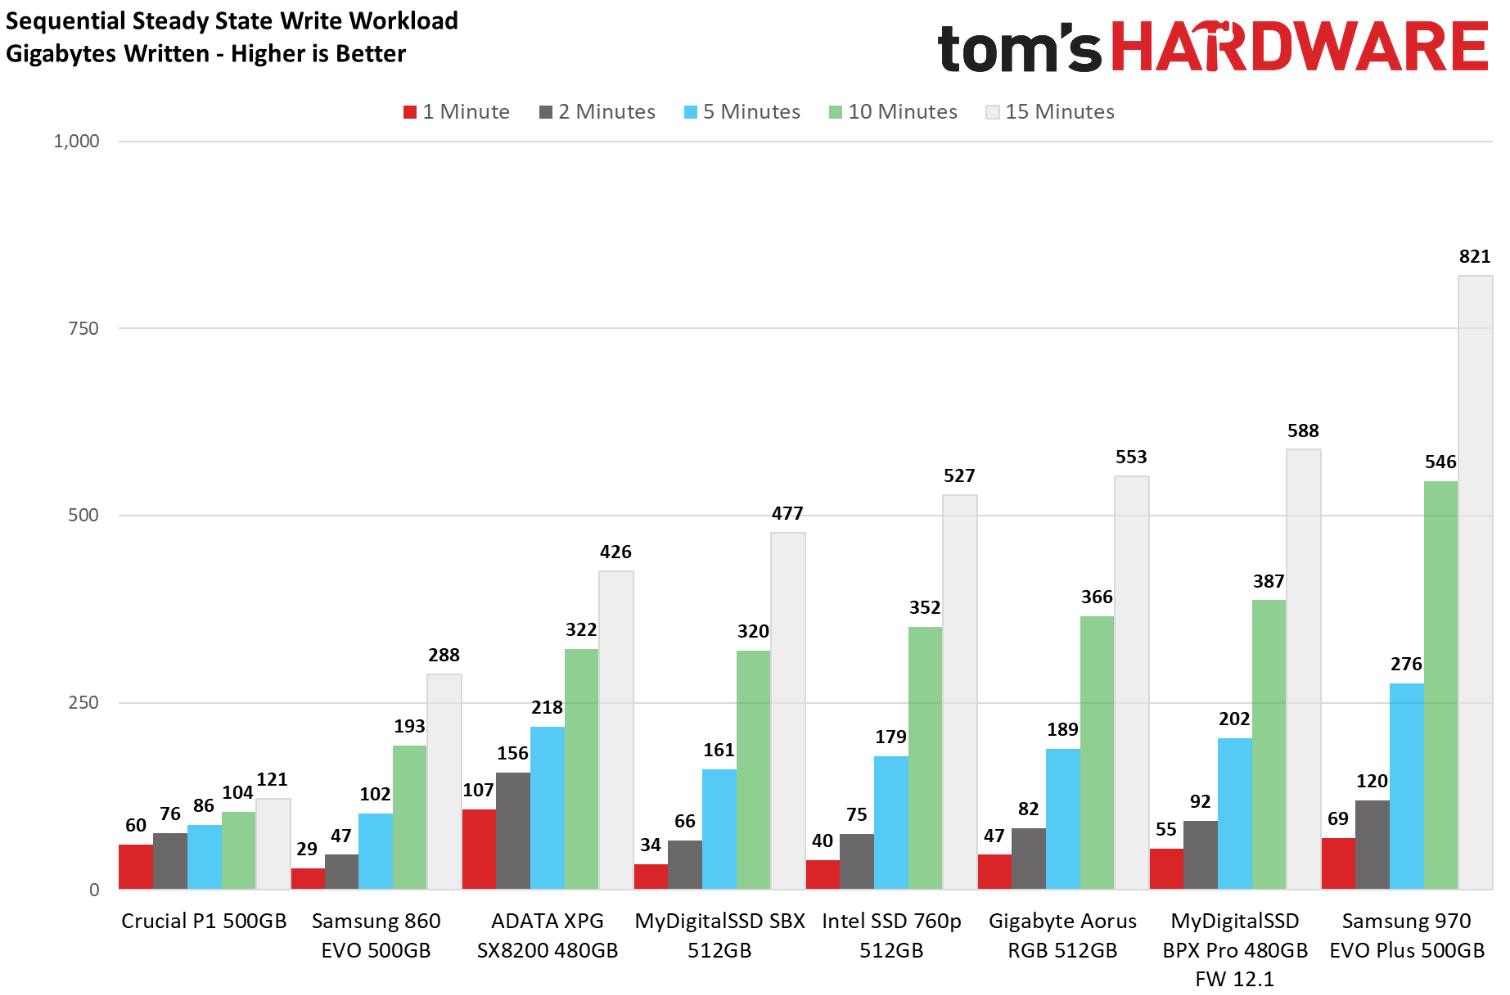
Crucial’s P1 features a rather large SLC write cache. It helps the SSD to absorb about 73GB of data at a rate of 1GB/s before it fills. This is sufficient for most consumer workloads, but after that, performance suffers drastically. We all know when you add more bits to a NAND cell, write performance suffers without an SLC cache. But in the Crucial P1’s case, performance is dreadful. After its SLC cache exhausts, the native direct to QLC write speed is just 60MB/s on average.
Power Consumption
We use the Quarch HD Programmable Power Module to gain a deeper understanding of power characteristics. Idle power consumption is a very important aspect to consider, especially if you're looking for a new drive for your laptop. Some SSDs can consume watts of power at idle while better-suited ones sip just milliwatts. Average workload power consumption and max consumption are two other aspects of power consumption, but performance-per-watt is more important. A drive might consume more power during any given workload, but accomplishing a task faster allows the drive to drop into an idle state faster, which ultimately saves power.
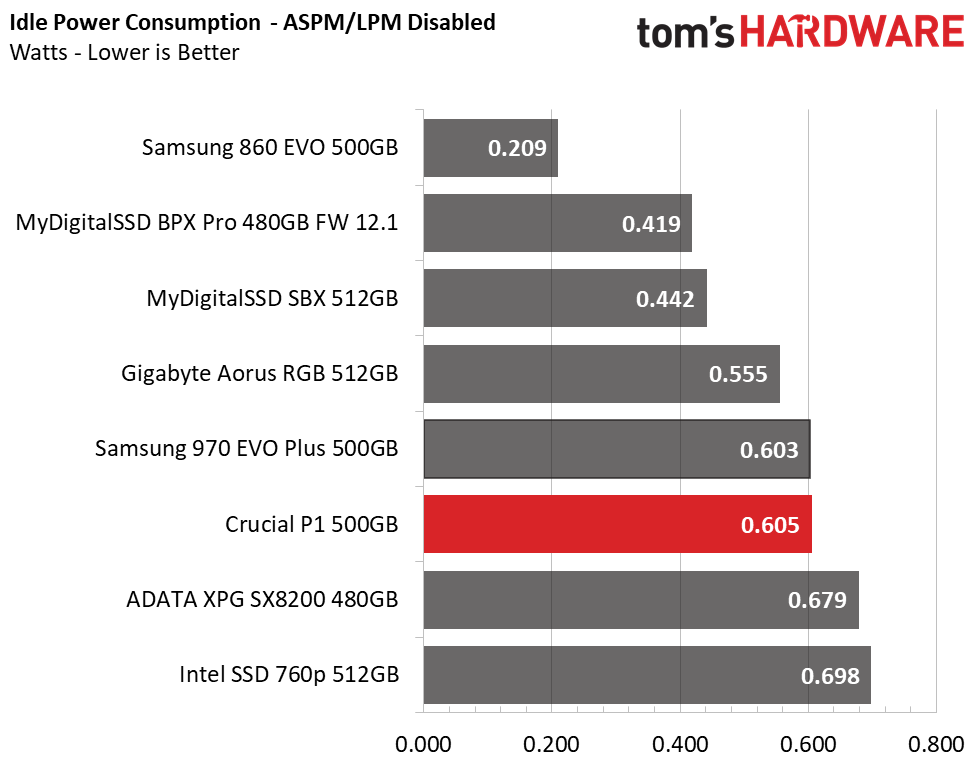
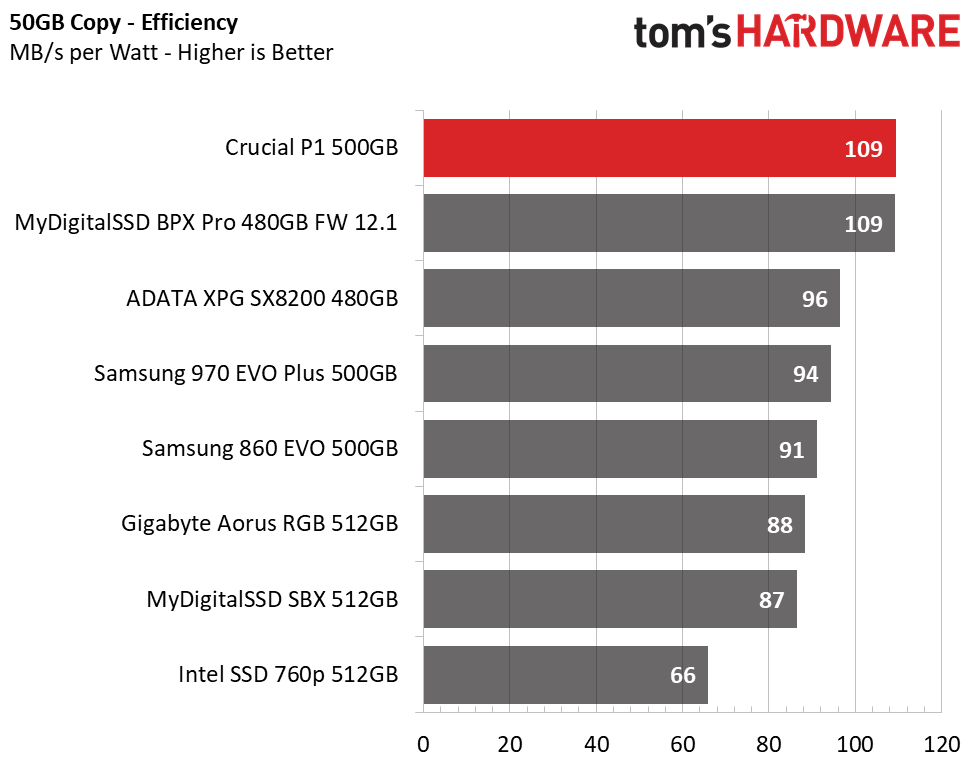
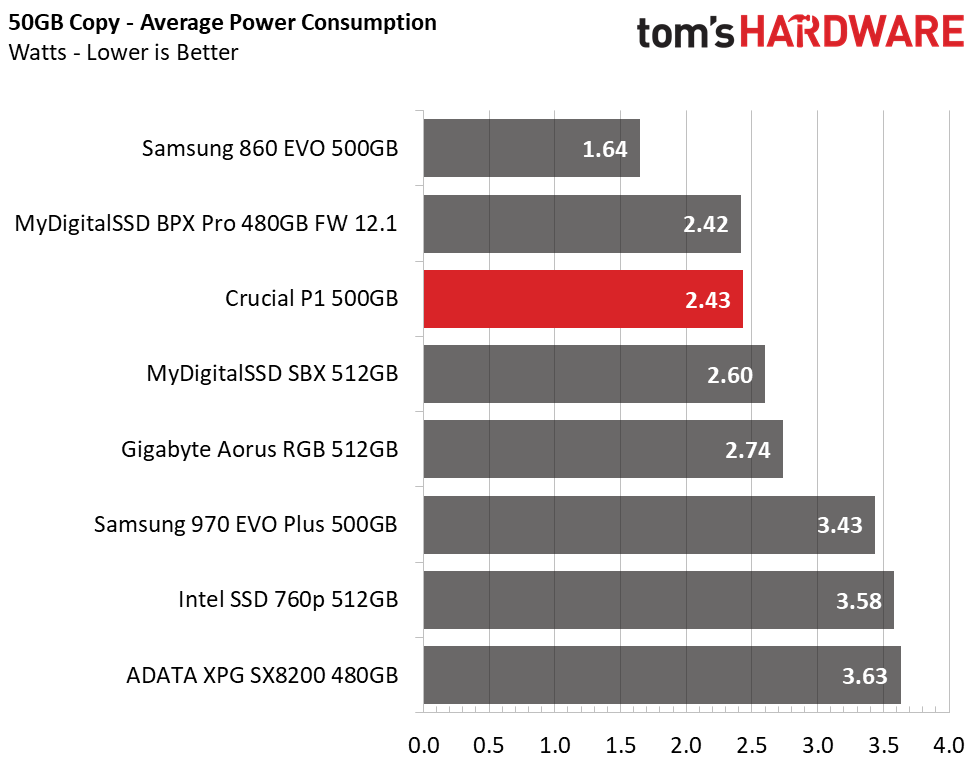
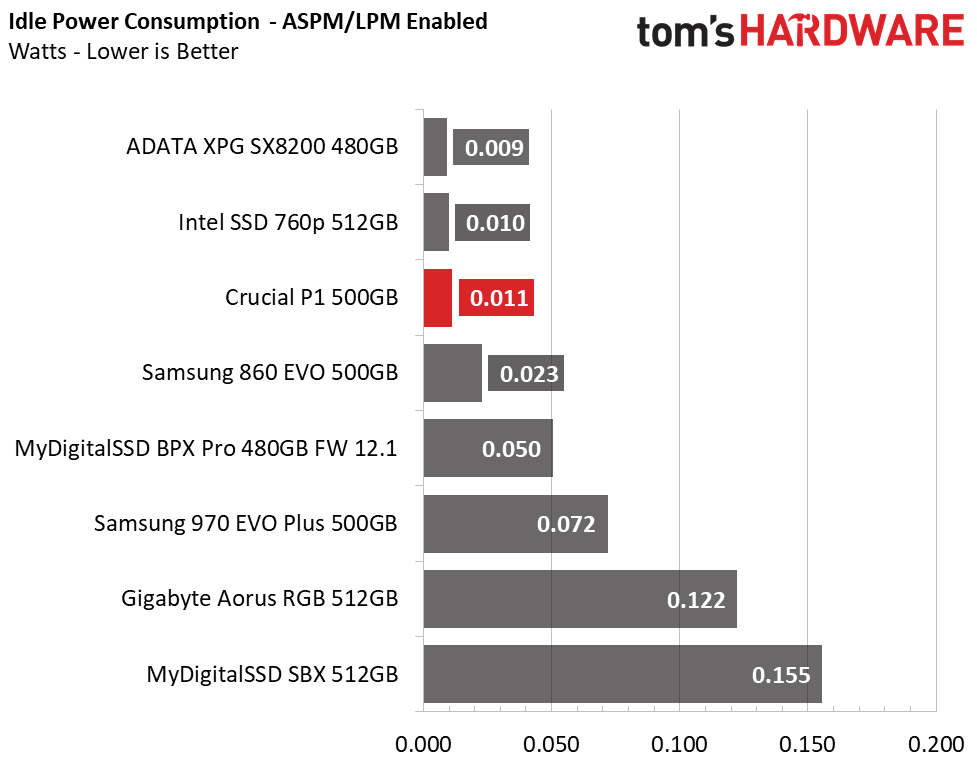
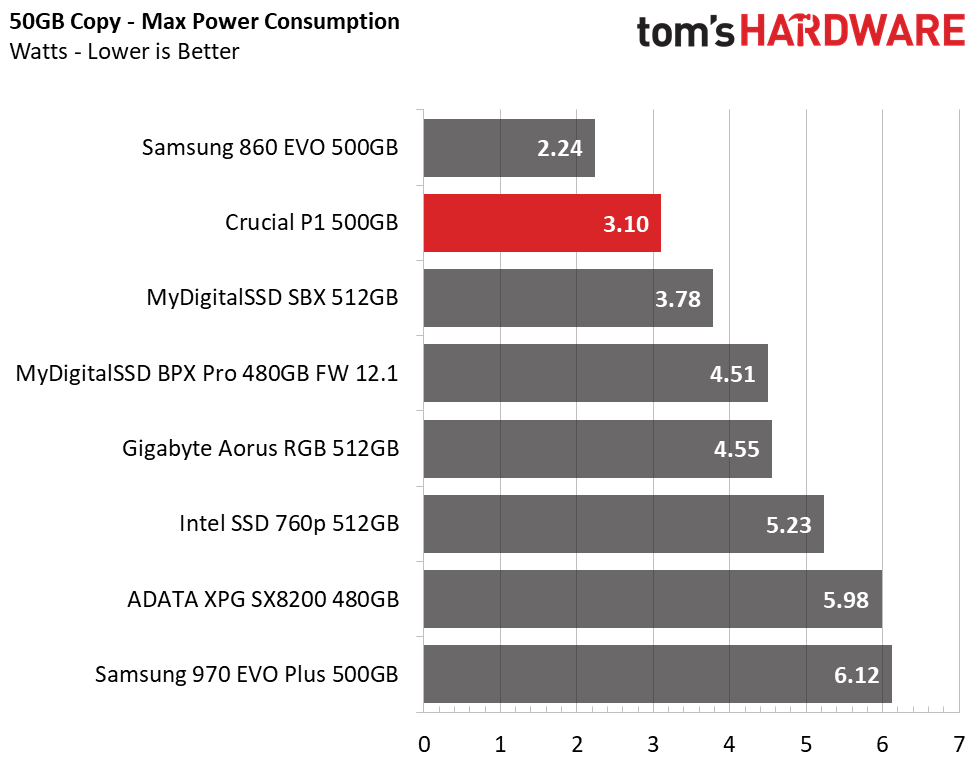
Crucial’s P1 is rather power efficient. At idle it sips just 11mW when ASPM is enabled in the UEFI. With it disabled, it sips 0.6W, which is about the same as the Samsung 970 EVO Plus.
During our 50GB file copy, it consumed on average 2.4W of power, tying the MyDigitalSSD BPX Pro, as well as tying that drive for an efficiency score of 109MB/s. With a slightly faster copy speed, here it even edged up to first place overall.
MORE: Best SSDs
MORE: How We Test HDDs And SSDs
MORE: All SSD Content

Sean is a Contributing Editor at Tom’s Hardware US, covering storage hardware.

