HP EliteDisplay E271i Review: Solid Performance From A 27" Screen
Can a business-class monitor work well for the entertainment-oriented? We discover the answer is yes if you’re using HP’s new EliteDisplay E271i 27-inch AH-IPS screen. Not only does it perform well, but it also offers some unique features and great value.
Results: Brightness And Contrast
Uncalibrated
Before calibrating any panel, we measure zero and 100 percent signals at both ends of the brightness control range. This shows us how contrast is affected at the extremes of a monitor's luminance capability. We do not increase the contrast control past the clipping point. While doing this would increase a monitor’s light output, the brightest signal levels would not be visible. This would result in crushed highlight detail. Our numbers show the maximum light level possible with no clipping of the signal.
We chose a mix of QHD and FHD monitors from recent reviews to create our comparison charts for the E271i. It’s evident from the results that neither resolution nor price is a factor in any performance metric.
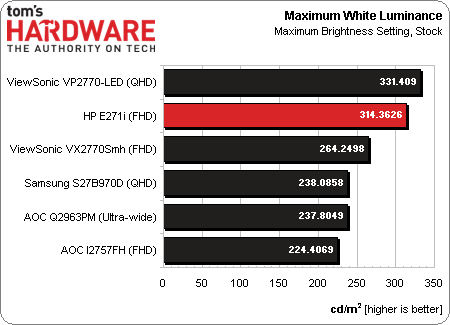
As you can see, the E271i is a fairly bright monitor. It easily beats HP’s published spec of 250 cd/m2. With this much light output, you should see a clear, crisp image, even with a good amount of sunlight coming in the window. And the screen’s anti-glare coating prevents reflections from spoiling your day.
A bright screen can sometimes mean elevated black levels, though.
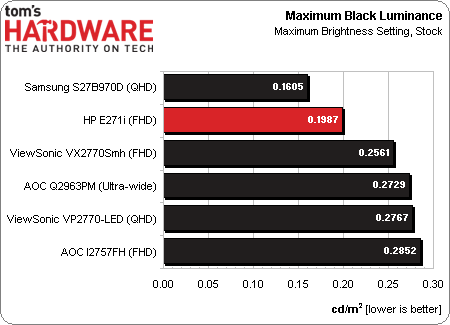
The E271i is quite impressive with a low max black level of .1987 cd/m2. This speaks to the excellent engineering of the panel. Many monitors sacrifice black level in the name of brightness. HP does not have to make that concession.
This should bode well for the stock max contrast ratio.
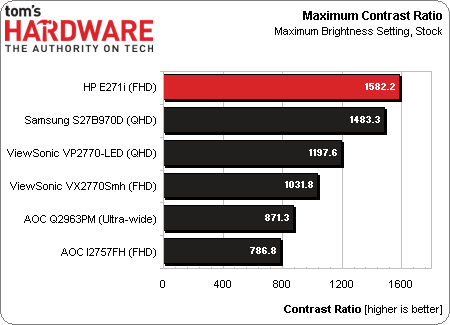
With such a wide gap between peak white and minimum black, one naturally expects a high contrast ratio number; the E271i doesn’t disappoint. Its value of 1582.2:1 is the highest we’ve recorded this year.
Get Tom's Hardware's best news and in-depth reviews, straight to your inbox.
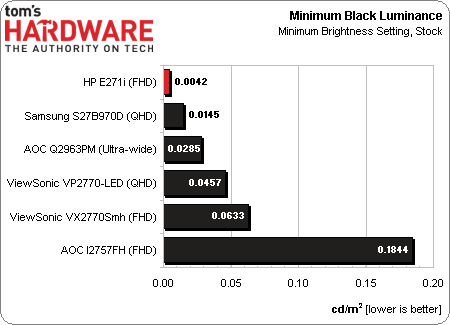
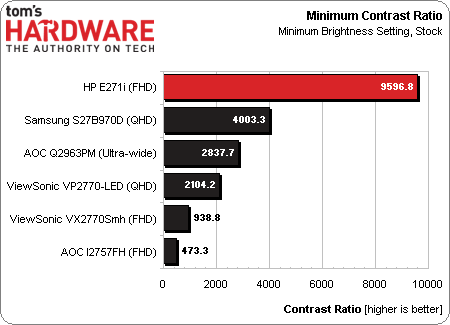
For the next group of measurements, we turn down the brightness control to its minimum setting, and leave the contrast unchanged. The E271i measures 40.042 cd/m2, which is a bit below our standard of 50 cd/m2. We recommend staying above this level to avoid eyestrain. At this low brightness setting, we often see amazing black level numbers.
When we measured the E271i’s black level with the brightness control at its minimum, we had a hard time even recording a value. The i1Pro was stretched to its lower limit and many of the readings were 0 cd/m2. To arrive at the amazing value of .0042 cd/m2, we averaged 20 measurements! To put it in perspective, this is the same number we get from a ninth-generation Pioneer Elite plasma TV, which is, to this day, the undisputed king of black levels among flat panel displays.
Of course, that turns into a ridiculously high contrast number.
At over 9000:1, HP will probably hold the record in this metric for some time to come. Since it measured so high, we also calculated the contrast ratio at our minimum output standard of 50 cd/m2, just to see if it would still come out on top. At 3907.5:1, the E271i misses the top spot, held by Samsung’s S27B970D, by the tiniest of margins.
After Calibration
Since we consider 200 cd/m2 to be an ideal average for peak output, we calibrate all of our test monitors to that value. In a room with some ambient light (like an office), this brightness level provides a sharp, punchy image with maximum detail and minimum eye fatigue. It's also the sweet spot for gamma and grayscale tracking, which we'll look at on the next page.
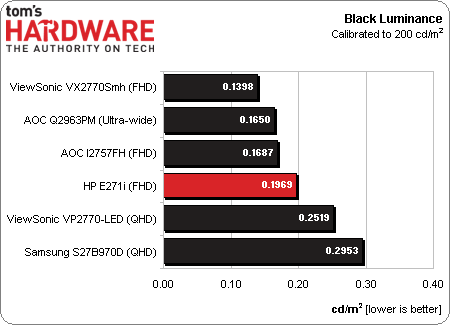
We start with the calibrated black level. This can sometimes rise a bit from the monitor’s default state. We consider the tradeoff in contrast well worth the gain in color accuracy.
Though the E271i’s calibrated black level isn’t the lowest we’ve measured, it’s still quite excellent at .1969 cd/m2. If you choose to work at a white level below 200 cd/m2, you will be rewarded with even blacker blacks.
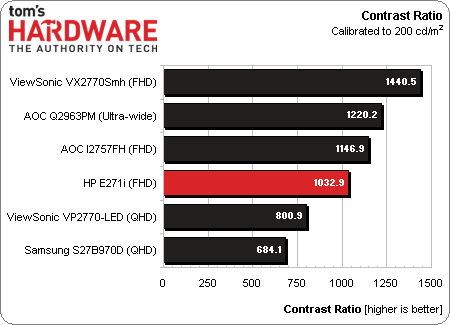
Here’s the final round-up of calibrated contrast ratio numbers.
Only the best LCD panels can maintain a calibrated contrast ratio of over 1000:1. The E271i is in the top tier for this metric. It’s also interesting to note the more expensive screens at the bottom. If maximum contrast is your ultimate goal, you don’t have to spend a lot of cash to achieve it.
ANSI Contrast Ratio
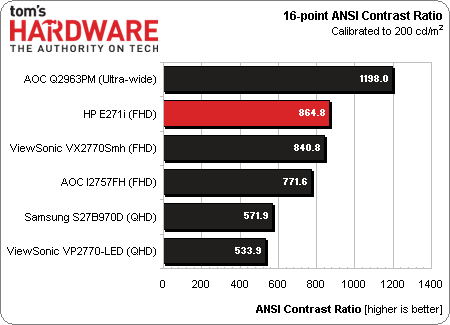
Another important measure of contrast is ANSI. To perform this test, a checkerboard pattern of sixteen zero and 100 percent squares is measured. This is somewhat more real-world than on/off measurements because it tests a display’s ability to simultaneously maintain both low black and full white levels, and factors in screen uniformity. The average of the eight full-white measurements is divided by the average of the eight full-black measurements to arrive at the ANSI result.
As we pointed out in our review of the AOC Q2963PM, a high-quality grid polarizer is the most important factor in rendering a high ANSI contrast ratio. By minimizing light bleed from the brightest parts of the image, the picture appears much more crisp and well-defined.
Current page: Results: Brightness And Contrast
Prev Page Measurement And Calibration Methodology: How We Test Next Page Results: Grayscale Tracking And Gamma Response
Christian Eberle is a Contributing Editor for Tom's Hardware US. He's a veteran reviewer of A/V equipment, specializing in monitors. Christian began his obsession with tech when he built his first PC in 1991, a 286 running DOS 3.0 at a blazing 12MHz. In 2006, he undertook training from the Imaging Science Foundation in video calibration and testing and thus started a passion for precise imaging that persists to this day. He is also a professional musician with a degree from the New England Conservatory as a classical bassoonist which he used to good effect as a performer with the West Point Army Band from 1987 to 2013. He enjoys watching movies and listening to high-end audio in his custom-built home theater and can be seen riding trails near his home on a race-ready ICE VTX recumbent trike. Christian enjoys the endless summer in Florida where he lives with his wife and Chihuahua and plays with orchestras around the state.
-
Someone Somewhere I'd like to see what the difference in the actual manufacturing costs/panel prices are for QHD vs FHD for large screens - pixel density is certainly not a problem.Reply
I'd guess it's merely a chicken/egg issue - people won't buy high-res screens until they are cheap and they won't be cheap until lots of people buy them. -
realibrad Reply11518024 said:I'd like to see what the difference in the actual manufacturing costs/panel prices are for QHD vs FHD for large screens - pixel density is certainly not a problem.
I'd guess it's merely a chicken/egg issue - people won't buy high-res screens until they are cheap and they won't be cheap until lots of people buy them.
That is the beauty of Capitalism. The rich have more than enough money, and will be more likely to spend money on something new. Companies wanting to maximize profits, try and make production cheaper. When company X makes production cheaper than company Y, then Y undercuts X and yay cheaper products.
-
rolli59 I wonder if they will come out with a similar IPS 23-24" monitor, I find that is the perfect size for me.Reply -
rezzahd Honestly from what I can tell this display is worth the money you pay. I might just have to pick up two of these and see what I can't do with them.Reply -
clownbaby meh, meh, meh, meh, meh. Toms, please leave these bland, generic products on the shelves of staples and office max where they belong. There is NOTHING impressive, interesting, or even noteworthy about a 27" 1920x1080 monitor today. I don't care if it makes gremlins when wet. At that resolution and size, it's just not going to be a good looking screen. Reading text on 27" 1920x1080 monitors SUCKS.Reply
Aside from the fact that compared to the QHD monitors you can pick up for under $300 this is garbage, it's just a silly format. Dated resolution on a cheap panel that's too big. -
Bondfc11 I have 3 2560x1440 Overlord Tempests. Would NEVER use a 1080 panel again - especially an IPS. And TN panels? Forget it - IPS is so pretty at 1440.Reply -
rezzahd Reply11519571 said:meh, meh, meh, meh, meh. Toms, please leave these bland, generic products on the shelves of staples and office max where they belong. There is NOTHING impressive, interesting, or even noteworthy about a 27" 1920x1080 monitor today. I don't care if it makes gremlins when wet. At that resolution and size, it's just not going to be a good looking screen. Reading text on 27" 1920x1080 monitors SUCKS.
Aside from the fact that compared to the QHD monitors you can pick up for under $300 this is garbage, it's just a silly format. Dated resolution on a cheap panel that's too big.
I understand where you are come from bot not every is looking for an extreme like that. If I had one of those I wouldn't complain. The monitor I currently have is better than this one, but that doesn't mean I wouldn't use this monitor. Tom's I believe is just trying to cater to everyone they can. So i say this kind of review is good for everyone. -
jn77 This is a massive 27 inch monster sitting with in 12-18 inches of your face while sitting at a desk.Reply
Why on earth would anyone want 1920x1080 on a screen 27 inches diagonal? Are you looking for pot holes between the pixels?
The reason I say this is, I work with media all day, We currently create, edit and produce 4k video and store it for transfer to quad layer blu-ray disc's (200GB).
Also, if you use any digital camera over 8MP, you will get close to a 1:1 pixel ratio at 4K resolutions.
We want to see a continuous image and seeing the gaps between the pixels is distracting.
24 inch monitors should have a minimum 4k pixel resolution, 708 might be able to get away with 4k on a 27 inch, but 8k would be better.
Now, lets look at the other side, How much would a 24 inch 1920x1080 flat trinitron cost you back in the day? $6,000 ? $12,000?
