HP EliteDisplay E271i Review: Solid Performance From A 27" Screen
Can a business-class monitor work well for the entertainment-oriented? We discover the answer is yes if you’re using HP’s new EliteDisplay E271i 27-inch AH-IPS screen. Not only does it perform well, but it also offers some unique features and great value.
Results: Grayscale Tracking And Gamma Response
The majority of monitors, especially newer models, display excellent grayscale tracking (even at stock settings). It’s important that the color of white be consistently neutral at all light levels from darkest to brightest. Grayscale performance impacts color accuracy with regard to the secondary colors: cyan, magenta, and yellow. Since computer monitors typically have no color or tint adjustment, accurate grayscale is key.
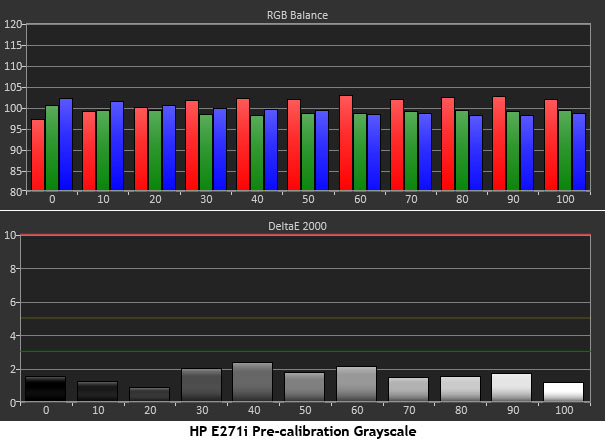
The HP E271i measures very well in its stock configuration.
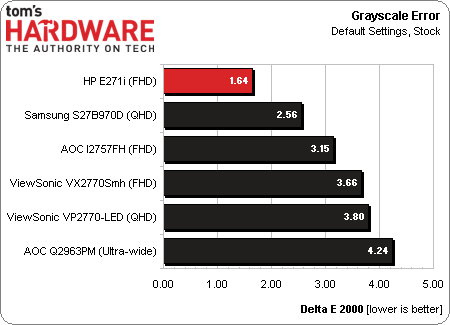
If ever there were a monitor that doesn’t really need a calibration, the E271i is it. This is the best run we’ve ever seen from an uncalibrated screen. In fact, its stock average Delta E value of 1.64 is the lowest of all the monitors we’ve tested this year. Nitpickers like us will note the slight rise in red from 30 percent on up. Even though HP doesn’t advertise this panel as factory-calibrated (and it certainly isn’t at this price), it might as well be with numbers this good.
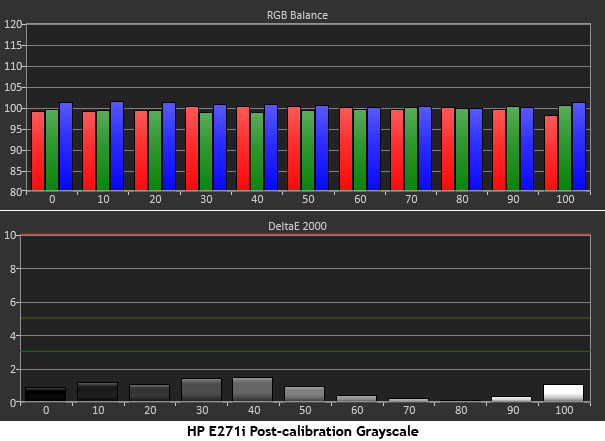
After a quick and easy calibration in the Custom RGB mode, we generated an even better chart.
While there are monitors with slightly (very slightly) better grayscale performance, it doesn’t really get much better than this. An average Delta E value of .84 puts the HP up with the best displays for grayscale accuracy.
You can see that neither a monitor’s resolution, nor its price tag affects its grayscale performance.
The HP sits quite comfortably at the top of the out-of-box grayscale chart. This is a value-priced screen marketed principally for business use. Yet, it could work in a graphics environment, so long as the wider Adobe RGB 1998 gamut is not required.
Get Tom's Hardware's best news and in-depth reviews, straight to your inbox.
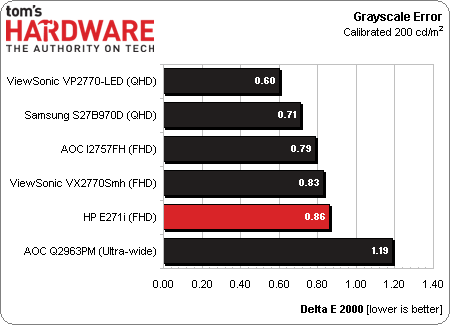
Let’s see how things stack up after calibration.
The HP runs close to the majority of the pack at just under one Delta E. We think it’s reasonable to expect any monitor today to come in under two Delta E after calibration, so when they average below one, that’s just icing on the cake. If you were to line up all the monitors in the group together, you would not see a difference in their grayscale accuracy with the naked eye.
Gamma Response
Gamma is the measurement of luminance levels at every step in the brightness range from 0 to 100 percent. This is important because poor gamma can either crush detail at various points or wash it out, making the entire picture appear flat and dull. Correct gamma produces a more three-dimensional image, with a greater sense of depth and realism. Meanwhile, incorrect gamma can negatively affect image quality, even in monitors with high contrast ratios.
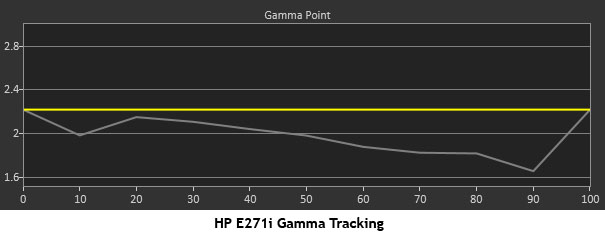
In the gamma charts below, the yellow line represents 2.2, which is the most widely accepted standard for television, film, and computer graphics production. The closer the white measurement trace comes to 2.2, the better.
This was the only test where HP falls short. With all of its other numbers coming in at excellent levels, we were surprised to see such poor gamma. We tried adjusting the Black Stretch, as well as the Brightness and Contrast controls to help, but the above graph was the best we could achieve.
You can see the trace never gets to the 2.2 standard, and as the signal rises, the brightness level continues to get too high. The visible result is that mid-tones and bright highlights are slightly flat, as if there was a subtle haze in those parts of the image. Productivity apps look fine, since they operate mostly at the darkest and lightest extremes. But photos and graphics don’t quite have the extra depth that they should. HP does a superb job at the extremes of the brightness scale, as evidenced by the great contrast numbers. Unfortunately, the too-bright gamma counters some of the E271i's advantage.
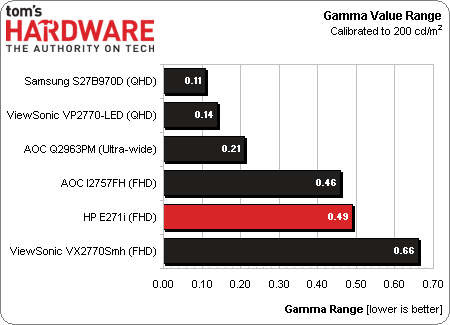
Here are the gamma numbers put up against the same group of monitors.
With a span of .49 from the lowest to highest gamma value, HP doesn't end up on the bottom. However, it certainly has room for improvement. A gamma preset control would help raise the trace closer to 2.2, though it'd require a multi-point adjustment to flatten out the tendency of the gamma to drop as the signal becomes brighter.
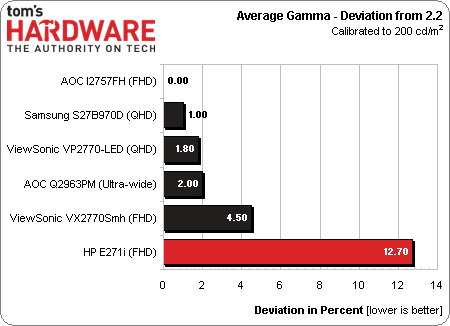
We calculate gamma deviation by expressing the difference from 2.2 as a percentage.
The I2757FH we tested back in January is still the only display to measure a perfect 2.2 for average gamma. The E271i misses the mark significantly with a 12.7 percent deviation from the standard. Again, just the addition of a gamma preset would be a vast improvement in this metric.
Current page: Results: Grayscale Tracking And Gamma Response
Prev Page Results: Brightness And Contrast Next Page Results: Color Gamut And Performance
Christian Eberle is a Contributing Editor for Tom's Hardware US. He's a veteran reviewer of A/V equipment, specializing in monitors. Christian began his obsession with tech when he built his first PC in 1991, a 286 running DOS 3.0 at a blazing 12MHz. In 2006, he undertook training from the Imaging Science Foundation in video calibration and testing and thus started a passion for precise imaging that persists to this day. He is also a professional musician with a degree from the New England Conservatory as a classical bassoonist which he used to good effect as a performer with the West Point Army Band from 1987 to 2013. He enjoys watching movies and listening to high-end audio in his custom-built home theater and can be seen riding trails near his home on a race-ready ICE VTX recumbent trike. Christian enjoys the endless summer in Florida where he lives with his wife and Chihuahua and plays with orchestras around the state.
-
Someone Somewhere I'd like to see what the difference in the actual manufacturing costs/panel prices are for QHD vs FHD for large screens - pixel density is certainly not a problem.Reply
I'd guess it's merely a chicken/egg issue - people won't buy high-res screens until they are cheap and they won't be cheap until lots of people buy them. -
realibrad Reply11518024 said:I'd like to see what the difference in the actual manufacturing costs/panel prices are for QHD vs FHD for large screens - pixel density is certainly not a problem.
I'd guess it's merely a chicken/egg issue - people won't buy high-res screens until they are cheap and they won't be cheap until lots of people buy them.
That is the beauty of Capitalism. The rich have more than enough money, and will be more likely to spend money on something new. Companies wanting to maximize profits, try and make production cheaper. When company X makes production cheaper than company Y, then Y undercuts X and yay cheaper products.
-
rolli59 I wonder if they will come out with a similar IPS 23-24" monitor, I find that is the perfect size for me.Reply -
rezzahd Honestly from what I can tell this display is worth the money you pay. I might just have to pick up two of these and see what I can't do with them.Reply -
clownbaby meh, meh, meh, meh, meh. Toms, please leave these bland, generic products on the shelves of staples and office max where they belong. There is NOTHING impressive, interesting, or even noteworthy about a 27" 1920x1080 monitor today. I don't care if it makes gremlins when wet. At that resolution and size, it's just not going to be a good looking screen. Reading text on 27" 1920x1080 monitors SUCKS.Reply
Aside from the fact that compared to the QHD monitors you can pick up for under $300 this is garbage, it's just a silly format. Dated resolution on a cheap panel that's too big. -
Bondfc11 I have 3 2560x1440 Overlord Tempests. Would NEVER use a 1080 panel again - especially an IPS. And TN panels? Forget it - IPS is so pretty at 1440.Reply -
rezzahd Reply11519571 said:meh, meh, meh, meh, meh. Toms, please leave these bland, generic products on the shelves of staples and office max where they belong. There is NOTHING impressive, interesting, or even noteworthy about a 27" 1920x1080 monitor today. I don't care if it makes gremlins when wet. At that resolution and size, it's just not going to be a good looking screen. Reading text on 27" 1920x1080 monitors SUCKS.
Aside from the fact that compared to the QHD monitors you can pick up for under $300 this is garbage, it's just a silly format. Dated resolution on a cheap panel that's too big.
I understand where you are come from bot not every is looking for an extreme like that. If I had one of those I wouldn't complain. The monitor I currently have is better than this one, but that doesn't mean I wouldn't use this monitor. Tom's I believe is just trying to cater to everyone they can. So i say this kind of review is good for everyone. -
jn77 This is a massive 27 inch monster sitting with in 12-18 inches of your face while sitting at a desk.Reply
Why on earth would anyone want 1920x1080 on a screen 27 inches diagonal? Are you looking for pot holes between the pixels?
The reason I say this is, I work with media all day, We currently create, edit and produce 4k video and store it for transfer to quad layer blu-ray disc's (200GB).
Also, if you use any digital camera over 8MP, you will get close to a 1:1 pixel ratio at 4K resolutions.
We want to see a continuous image and seeing the gaps between the pixels is distracting.
24 inch monitors should have a minimum 4k pixel resolution, 708 might be able to get away with 4k on a 27 inch, but 8k would be better.
Now, lets look at the other side, How much would a 24 inch 1920x1080 flat trinitron cost you back in the day? $6,000 ? $12,000?
