Aorus GeForce RTX 2080 Ti Xtreme 11G Review: In A League of its Own
Why you can trust Tom's Hardware
Power Consumption
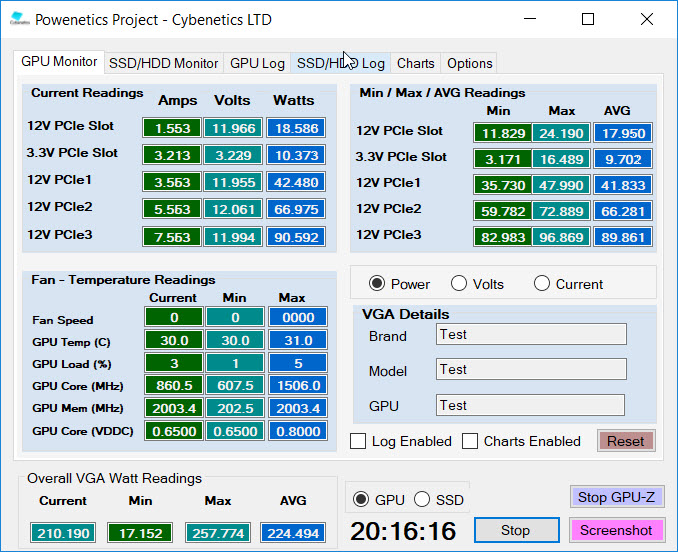
Slowly but surely, we’re spinning up multiple Tom’s Hardware labs with Cybenetics’ Powenetics hardware/software solution for accurately measuring power consumption.
Powenetics, In Depth
For a closer look at our U.S. lab’s power consumption measurement platform, check out Powenetics: A Better Way To Measure Power Draw for CPUs, GPUs & Storage.
In brief, Powenetics utilizes Tinkerforge Master Bricks, to which Voltage/Current bricklets are attached. The bricklets are installed between the load and power supply, and they monitor consumption through each of the modified PSU’s auxiliary power connectors and through the PCIe slot by way of a PCIe riser. Custom software logs the readings, allowing us to dial in a sampling rate, pull that data into Excel, and very accurately chart everything from average power across a benchmark run to instantaneous spikes.
The software is set up to log the power consumption of graphics cards, storage devices, and CPUs. However, we’re only using the bricklets relevant to graphics card testing. Gigabyte's Aorus GeForce RTX 2080 Ti Xtreme 11G gets all of its power from the PCIe slot and a pair of eight-pin PCIe connectors. Should higher-end 2080 Ti boards need three auxiliary power connectors, we can support them, too.
Idle
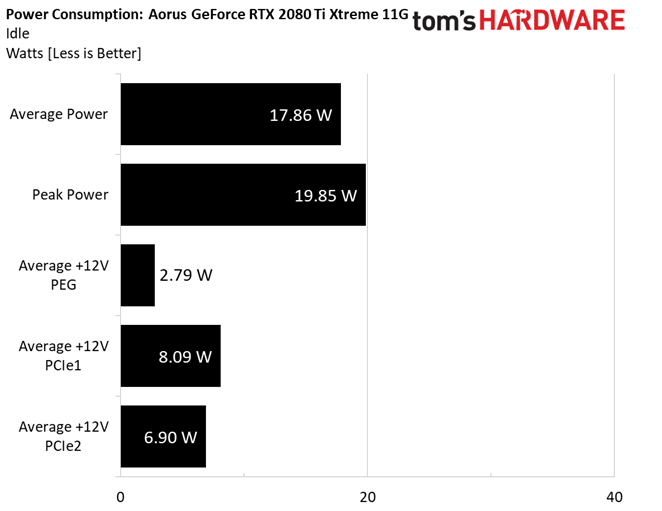
An average power reading of just under 18W is a little higher than what we measured from GeForce RTX 2080 Ti FE. Then again, the Aorus GeForce RTX 2080 Ti Xtreme 11G does have an extra fan, plus a bunch of lighting that the FE board lacks.
It’s also worth noting that Gigabyte offers semi-passive functionality, which cuts power consumption slightly. But we prefer a bit of active cooling, even at idle load levels, so we test with the fans spinning.
Get Tom's Hardware's best news and in-depth reviews, straight to your inbox.
Gaming
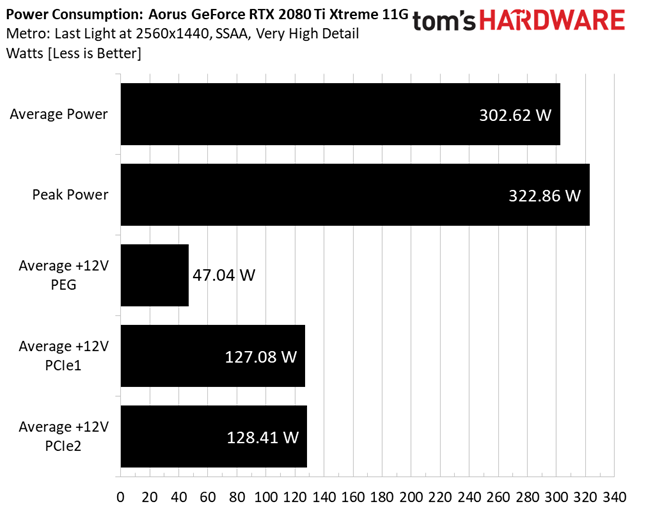
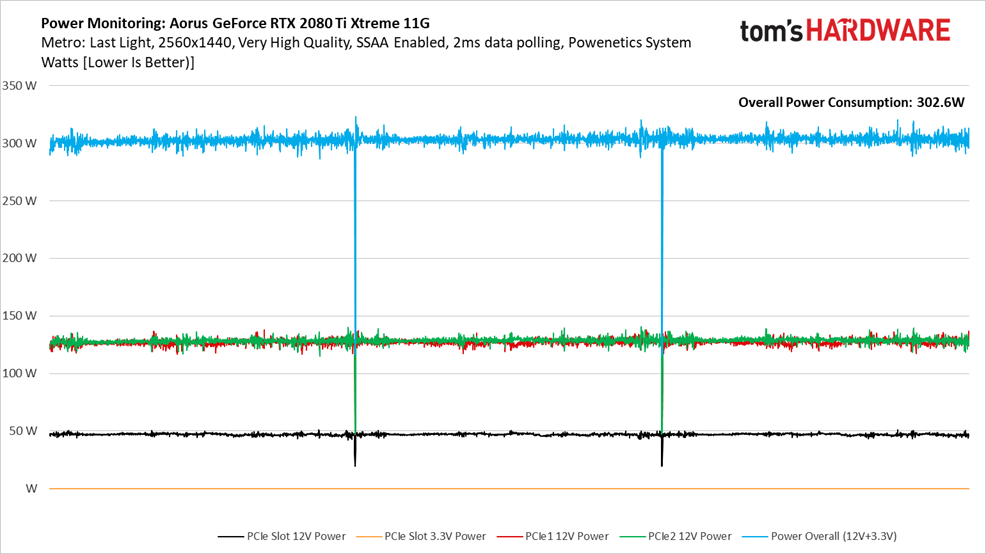
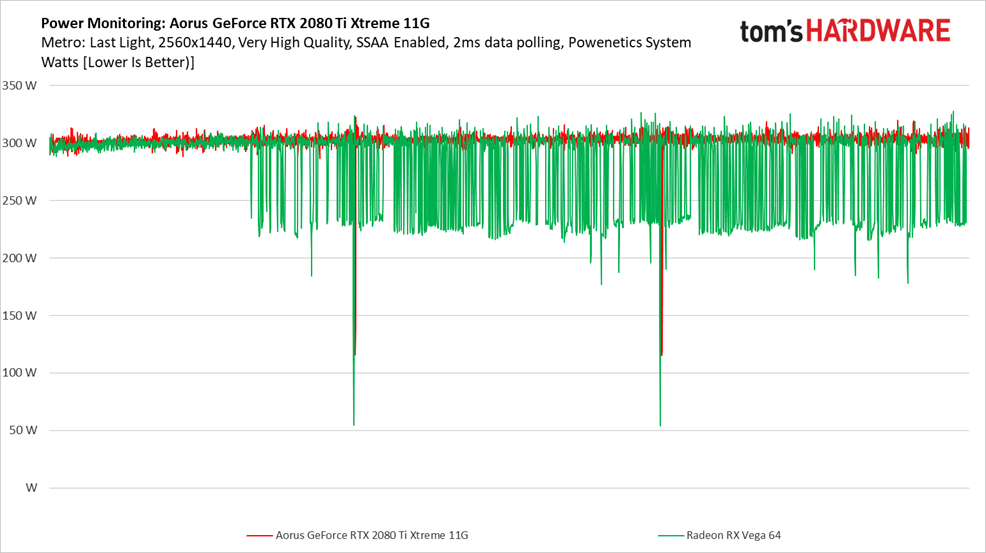
Running the Metro: Last Light benchmark at 2560 x 1440 with SSAA enabled pushes GeForce RTX 2080 Ti to the max, yielding an average power consumption measurement of 302W. Most of that power is delivered evenly through both eight-pin auxiliary connectors.
We pulled most of the lower-end cards out of our comparison chart since they use quite a bit less power than the GeForce RTX 2080 Ti Xtreme 11G. However, AMD’s reference Radeon RX Vega 64 remains. Although it’s much slower through our benchmark suite, we can see that AMD’s flagship tries to maintain a similar power target.
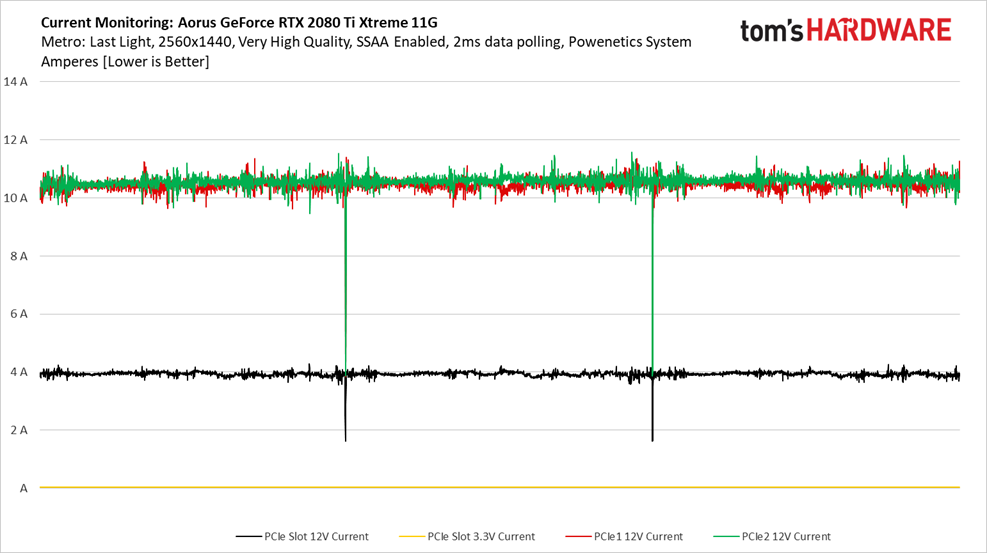
Recording current through three runs of the Metro: Last Light benchmark gives us a line chart that resembles power consumption, naturally. Still, breaking the results down this way tells us that the PCIe slot hovers around 4A—well under its 5.5A ceiling.
FurMark
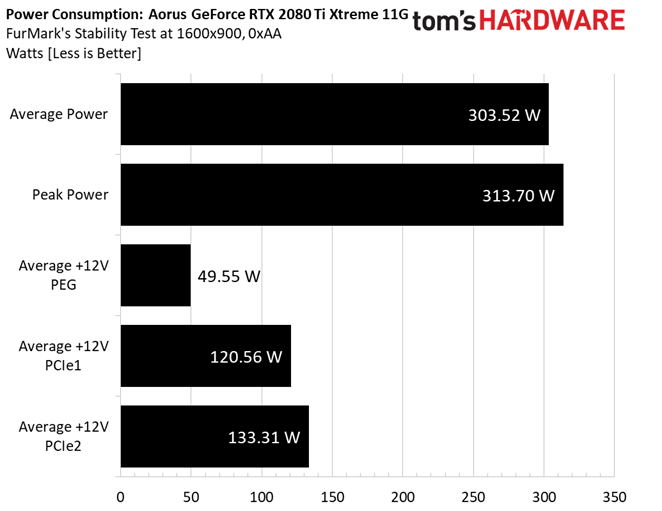
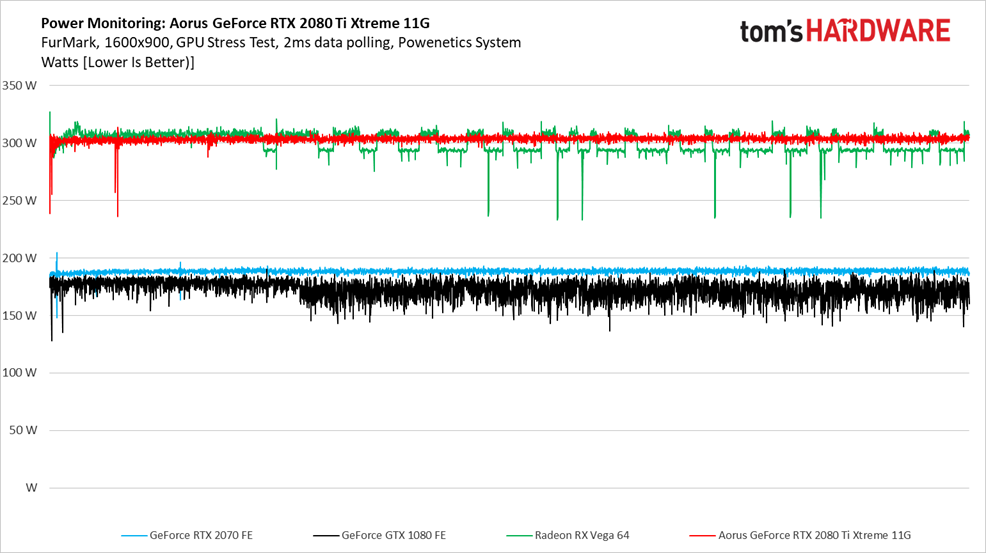
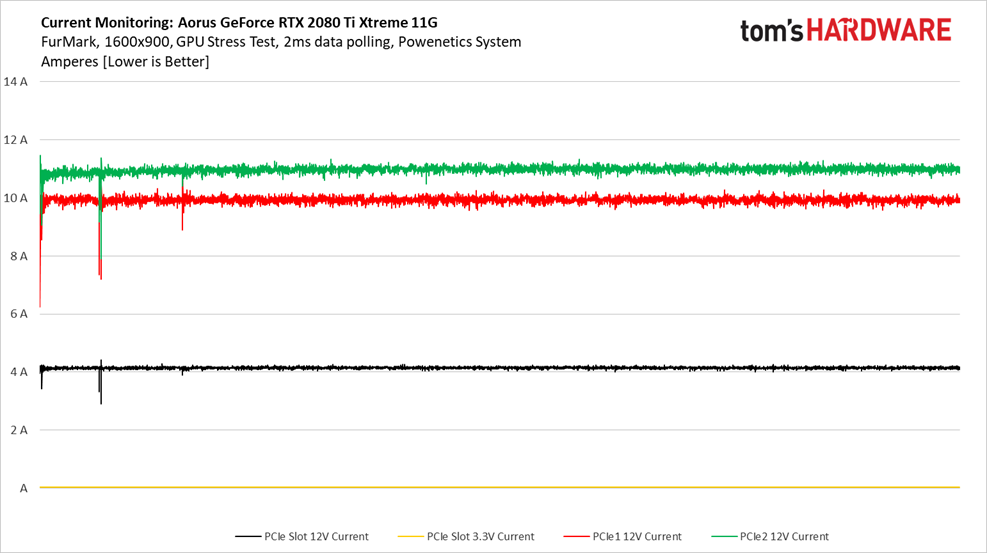
Power consumption under FurMark isn’t much higher than our gaming workload. There is a slightly higher peak reading, and one of the eight-pin connectors shoulders more of the task than before. Still, an average of 303W shows that Gigabyte has its Aorus GeForce RTX 2080 Ti Xtreme 11G capped. Once that power ceiling is hit, voltage and frequency are scaled back.
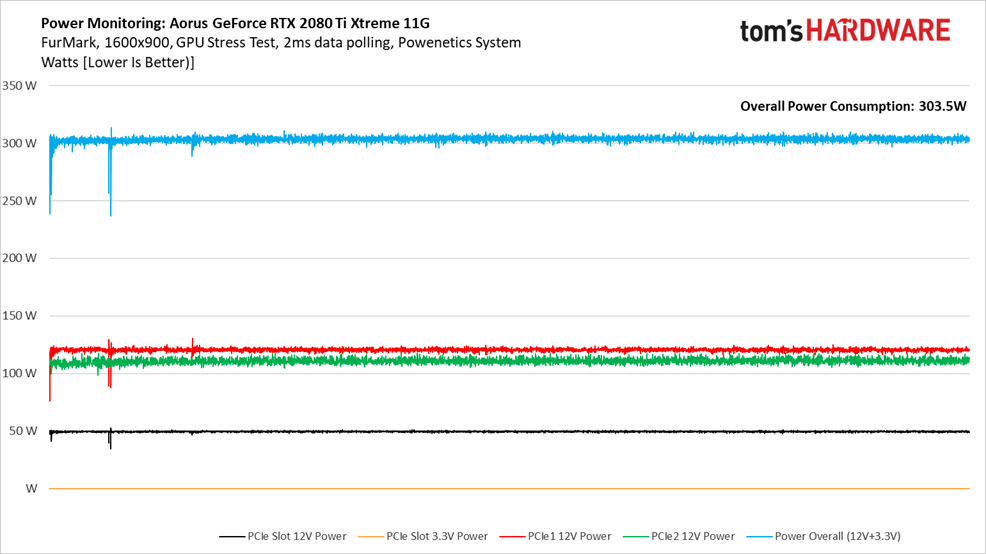
Maximum utilization yields a nice, even line chart as we track ~10 minutes under FurMark.
Tracking power consumption over time in FurMark doesn’t look much different from what we saw under Metro: Last Light. The Aorus GeForce RTX 2080 Ti Xtreme 11G holds steady around 300W. AMD’s Radeon RX Vega 64 tries to maintain the same power level, but has to switch between throttle states after a few minutes. Even a GeForce GTX 1080 Founders Edition starts acting up after a while.
Current draw over the PCIe x16 slot is slightly higher than 4A, and well under the 5.5A ceiling defined by the PCI-SIG.
MORE: Best Graphics Cards
MORE: Desktop GPU Performance Hierarchy Table
MORE: All Graphics Content
Current page: Power Consumption
Prev Page Performance Results: 3840 x 2160 Next Page Temperatures and Fan Speeds-
NinjaNerd56 I’ll keep the GTX1060 machine I have....that cost IN TOTAL 1/2 of what this card goes for...and ray trace around all the money I have left.Reply -
tomspown The price stated of vega 56 and 64 are there to make the price of the 2080ti less wow but the real price of vega 56 is 370 euro and the vega 64 449 euro. i realy hate it when Toms H. uses over blown prices on AMD products just to make the competition a good buy.Reply -
jimmysmitty Reply21631806 said:The price stated of vega 56 and 64 are there to make the price of the 2080ti less wow but the real price of vega 56 is 370 euro and the vega 64 449 euro. i realy hate it when Toms H. uses over blown prices on AMD products just to make the competition a good buy.
I am not sure where they get their pricing but they did the same with the RX590 review with a over priced 1060. I think its a site algorithm that pulls prices and not a person as any normal person can easily find better deals. -
delaro I would think Nvidia would have learned a lesson on overly pricing cards with gimmicky tags... well I guess not and no wonder their stock tanked. I wouldn't think it's all that hard to understand, Selling 20,000 cards @ $1300+ or 250,000 @ $200? Over the last 15 years what range of cards have sold the most and which one gets released last in line? Splatting a big RTX label and charging a premium on a GPU when software is still 12 months behind was just stupid and we can add it to the many other gimmicks Nvidia has come up with over the years that failed to draw sales " PhysX, Early stages of VR, Hairworks, and now RTX" These cards are indeed nice but adding that extra premium just for "RTX" is just bad marketing.Reply -
redgarl How can a card with such a bad value proposition could score that high?Reply
It is insane, that you guys, are now accepting Nvidia price gouging behavior as something normal.... IT IS NOT!
This card offer the worst value ever. -
ingtar33 obviously a paid ad in the form of a review. for shame THGReply
About ready to retire this site for good at this point; first "just buy it because there is a price to NOT be an early adapter tripe", then a 4.5/5.0 for any NVIDIA RTX product is just a slap in the face of the site readers.
Clearly this is about the ad bucks, not sure how your reviewers can look themselves in the mirror anymore. -
cosmin.matei86 Any1 with a 1070ti or above is absolutely fine at 1440p resolution. My card scores about 60 fps in the last tomb raider and 52 in AC Oddysey benchmark. In game with dips to just unde 40. Coupled with a high refresh g sync monitor I don't even notice low framerate.Reply
I'll say pass to shitty rtx. I cannot believe how people could pay 1300 for a gimmick like rays. Gimmick that you will find in 0.0001% of the time played in the 2 existing games. It's like getting the gold frame. I would have preferred they invested in better more advanced phisics and market that. -
Phaaze88 Reply21632900 said:Any1 with a 1070ti or above is absolutely fine at 1440p resolution. My card scores about 60 fps in the last tomb raider and 52 in AC Oddysey benchmark. In game with dips to just unde 40. Coupled with a high refresh g sync monitor I don't even notice low framerate.
I'll say pass to shitty rtx. I cannot believe how people could pay 1300 for a gimmick like rays. Gimmick that you will find in 0.0001% of the time played in the 2 existing games. It's like getting the gold frame. I would have preferred they invested in better more advanced phisics and market that.
Not to mention, the current gen of RTX is only optimized for 1080p!
RTX Off: too powerful for 1080p. Ideal for 1440 and 4k
RTX On: Works best at 1080p. But for 1440 and 4k? NOPE.
The core feature of these cards(flagship) is useless to folks with higher res monitors, while being too powerful without said feature for those on lower res ones. This is why I'm passing on this gen's flagship.
It's just a bad investment all around.
And the 2060 won't fix this either:
RTX Off: great for 1080p.
RTX On: Not going to be able to run max settings like the 2070(?) and up, but hey, the overall build will be better balanced at least?
If they can keep the RTX train running, I'll hop aboard when they can do RTX On: 1440p, 100+hz. -
delaro Reply21632957 said:21632900 said:Any1 with a 1070ti or above is absolutely fine at 1440p resolution. My card scores about 60 fps in the last tomb raider and 52 in AC Oddysey benchmark. In game with dips to just unde 40. Coupled with a high refresh g sync monitor I don't even notice low framerate.
I'll say pass to shitty rtx. I cannot believe how people could pay 1300 for a gimmick like rays. Gimmick that you will find in 0.0001% of the time played in the 2 existing games. It's like getting the gold frame. I would have preferred they invested in better more advanced phisics and market that.
Not to mention, the current gen of RTX is only optimized for 1080p!
RTX Off: too powerful for 1080p. Ideal for 1440 and 4k
RTX On: Works best at 1080p. But for 1440 and 4k? NOPE.
The core feature of these cards(flagship) is useless to folks with higher res monitors, while being too powerful without said feature for those on lower res ones. This is why I'm passing on this gen's flagship.
It's just a bad investment all around.
And the 2060 won't fix this either:
RTX Off: great for 1080p.
RTX On: Not going to be able to run max settings like the 2070(?) and up, but hey, the overall build will be better balanced at least?
If they can keep the RTX train running, I'll hop aboard when they can do RTX On: 1440p, 100+hz.
It's not that the hardware isn't powerful enough.. It's that the API's are a year behind being able to render it without massive performance issues. So yes it makes these premium cards now seem Gimmicky and over inflated in price.
In a way they are listening by releasing Touring cards without the RTX badge at a closer to normal price. The issue here is the market is flooded and Nvidia is going to rush out Touring with 2X the badge numbers they normally release. Glad I moved all my Nvidia stock to AMD when Ryzen launched.
-
lorfa "this is an extremely heavy card to hang from a PCIe slot, so Gigabyte bundles a stand meant to support the card by pushing up from your bottom-mounted PSU or the floor of your chassis."Reply
This made me lol, what a time we are in.
