Graphics Boosters For OpenGL Workstations
Price Comparison And Evaluation
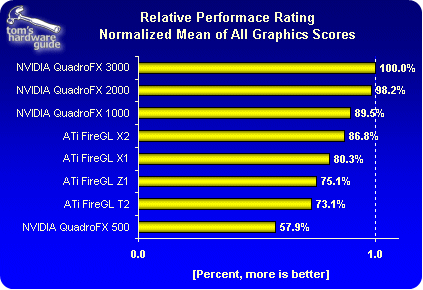
This time around, we wanted to take a closer look at the price/performance ratio. To that end, we standardized all of the graphics-sensitive benchmark results in the comparison at the highest value of 100% and modelled the mean mathematical value. This results in a standardized average for all graphics results and thus represents the relative performance rating for all cards. Note: These specifications refer solely to the benchmarks we used.
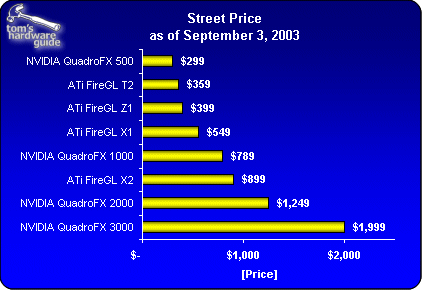
We have now determined the real street prices of the cards.
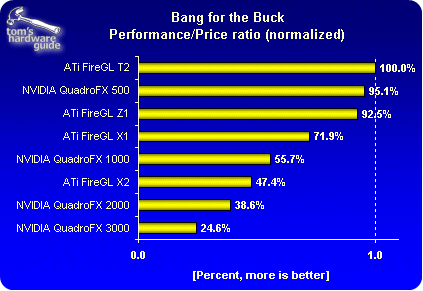
The price/performance ratio can be calculated using these figures.
The low-end cards FireGL T2 and Quadro FX 500 garnered the best scores. However, potential buyers should really think about whether these cards' low performance values are sufficient for their individual needs. NVIDIA is asking quite a pretty penny for the admittedly very good performance ratings of the FX 2000 and 3000, which also received the worst scores in the price/performance rating. Generally speaking, ATI offers the best performance for the money. While somewhat of a dinosaur, the FireGL Z1 merits mention.
Get Tom's Hardware's best news and in-depth reviews, straight to your inbox.


