Core i7-8700K Review: Coffee Lake Brews A Great Gaming CPU
Why you can trust Tom's Hardware
2D & 3D Workstation Performance
2D Workstation Performance
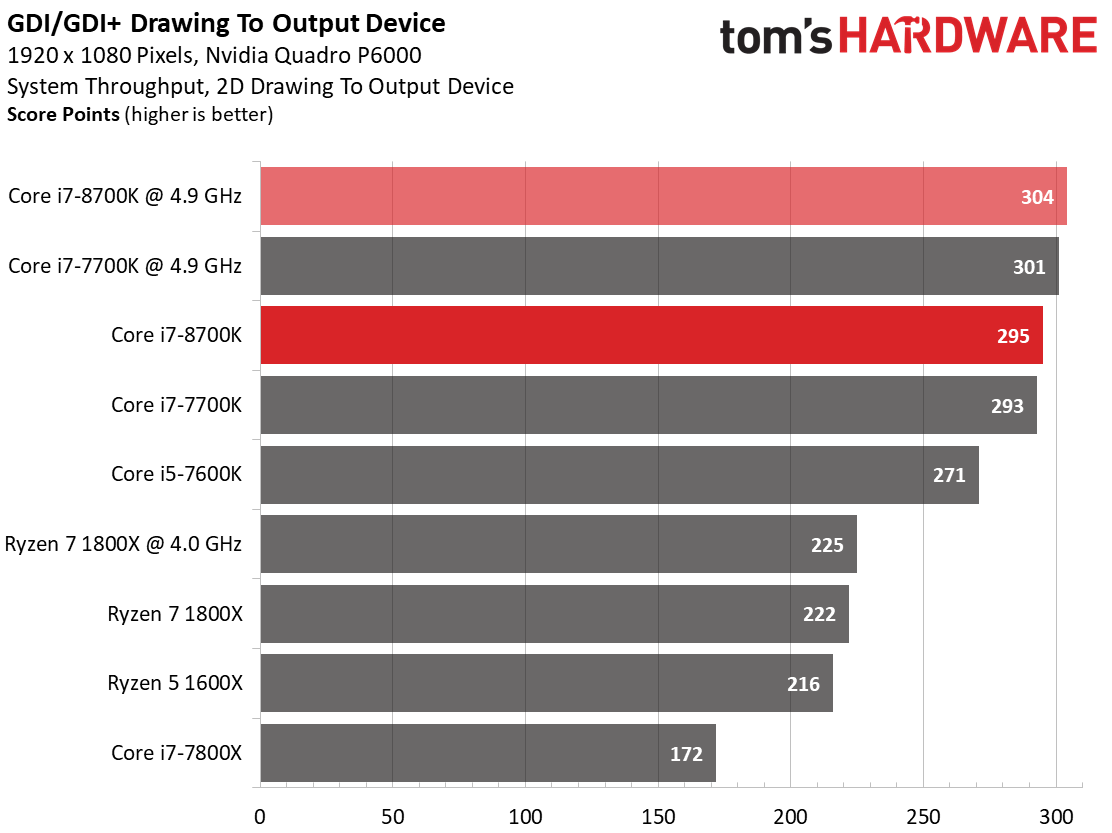
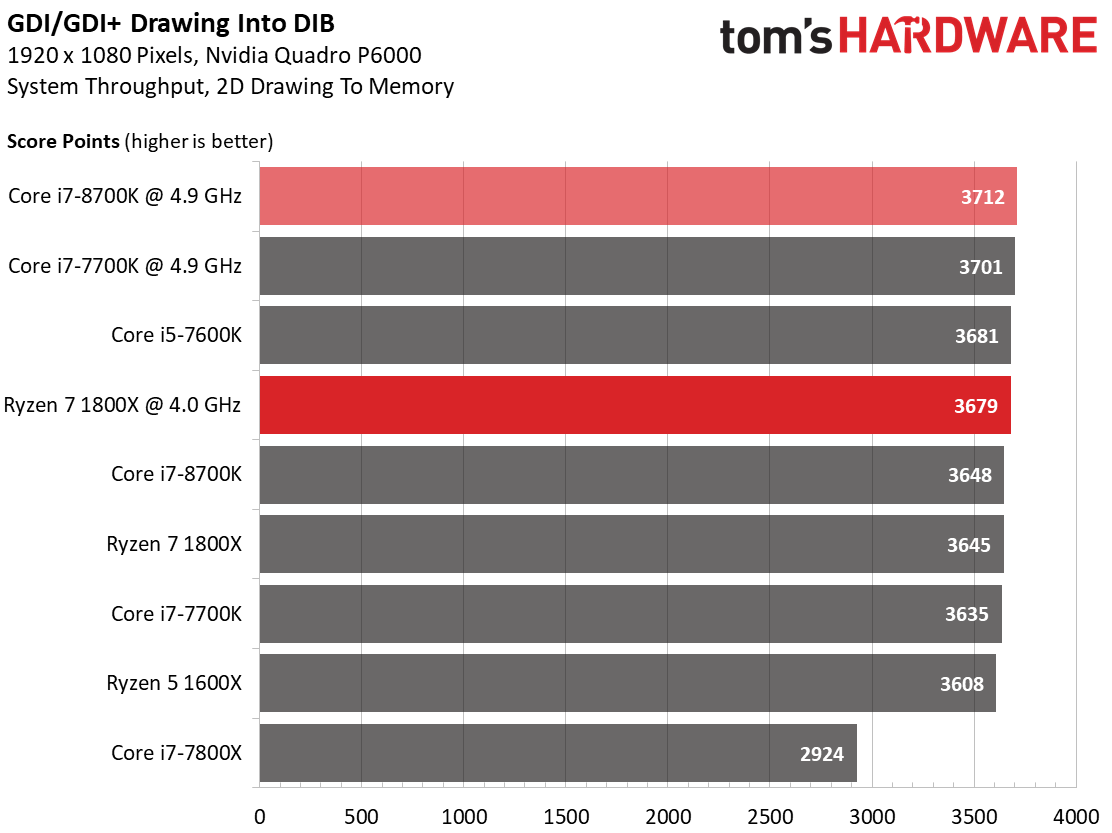
Our GDI/GDI+ tests are used to test two different output methods that can be found in older applications and printing tasks. Today, they, or at least a modified version of them, are commonly used to display the graphical user interface (GUI). They are also great benchmarks for direct device write throughput and memory performance when handling gigantic device-independent bitmap (DIB) files.
Synthetic 2D Benchmarks
We take a look at direct device write throughput first. The graphics driver uses the CPU heavily for this task, but doesn’t employ many threads.
There hasn’t been true 2D hardware acceleration since the introduction of the unified shader architecture, after all. Microsoft's Windows driver model provides a huge obstacle for 2D hardware acceleration as well.
We up the ante by introducing memory to the mix. This is done with the help of the only remaining 2D hardware function: generating the graphics output in memory and then copying it to the output device all at once. The benchmark’s the same as before. We just plot a bitmap in memory, as opposed to sending the information directly to the monitor. The bitmap’s copied to it only once it’s complete. This pushes the CPUs, since they’re no longer platform-bound. The results prove interesting: frequency rules, AMD can keep up, and Skylake-X brings up the rear.
AutoCAD 2016 (2D)
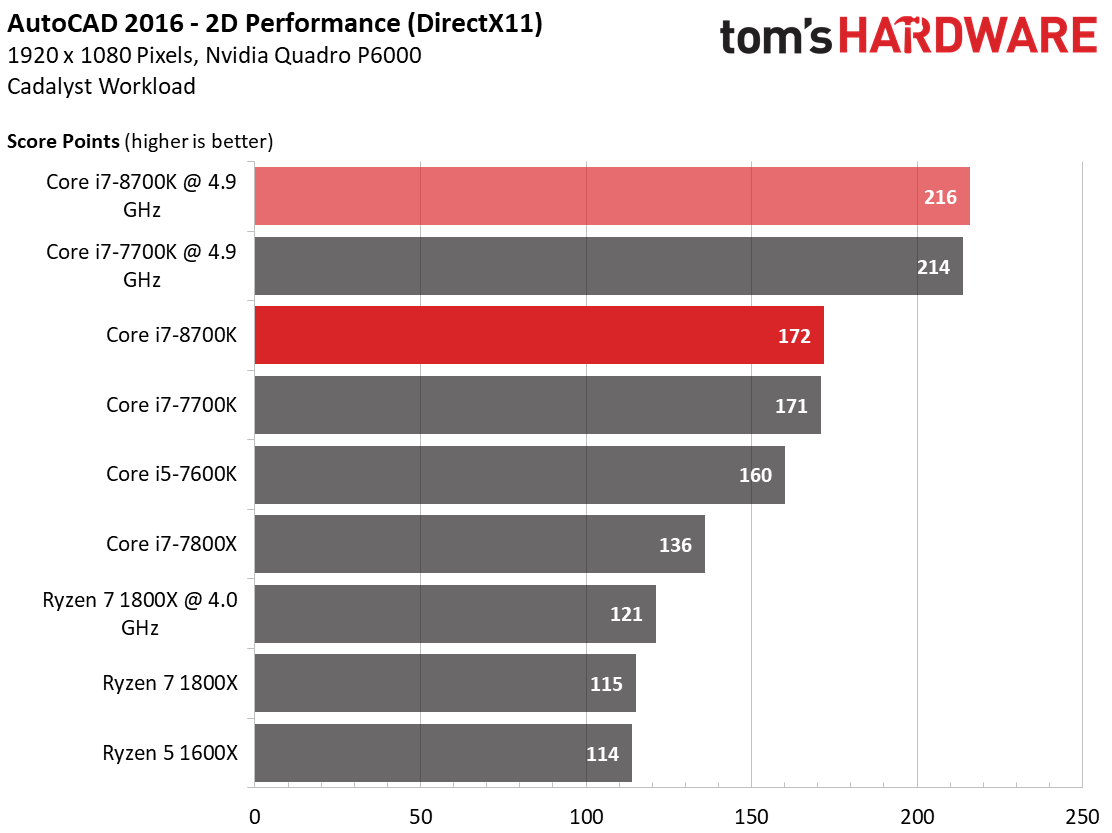
Even though AutoCAD does use DirectX, ultimately it just duplicates every single draw function in software. The results are exactly as expected, and IPC throughput is emphasized due to AutoCAD’s limited scaling with additional cores.
3D Workstation Performance
Most professional development applications have been optimized and compiled with Intel CPUs in mind. This is reflected in their performance numbers. Still, we include them in order to motivate developers to focus their efforts on AMD’s Ryzen processors as well. This would give users more than one choice. The same goes for an emphasis on multi-core processors, at least where that’s feasible and makes sense.
AutoCAD 2016 (3D)
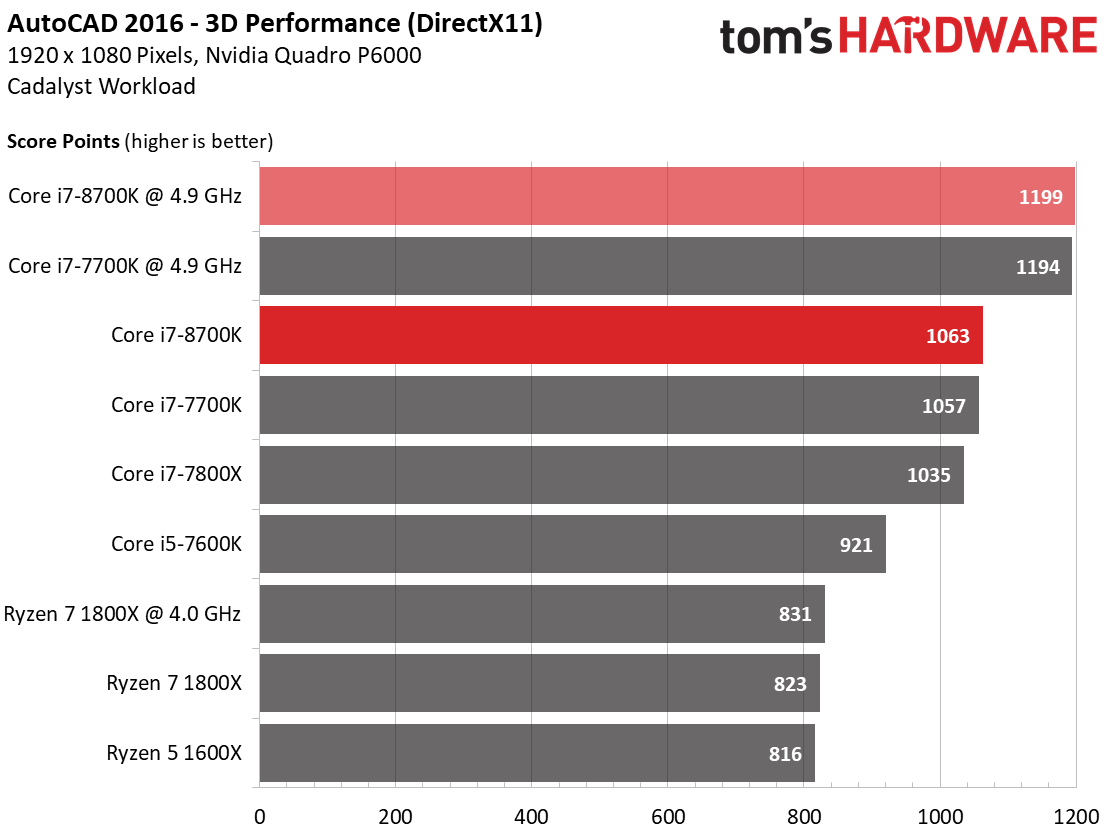
Clock rate trumps core count. Intel’s Kaby Lake and Coffee Lake land fairly close to each other, with clock rate determining the winner. AutoCAD’s performance turns out to be close to that of older games, since it uses DirectX and isn’t really optimized to take advantage of multiple cores.
Get Tom's Hardware's best news and in-depth reviews, straight to your inbox.
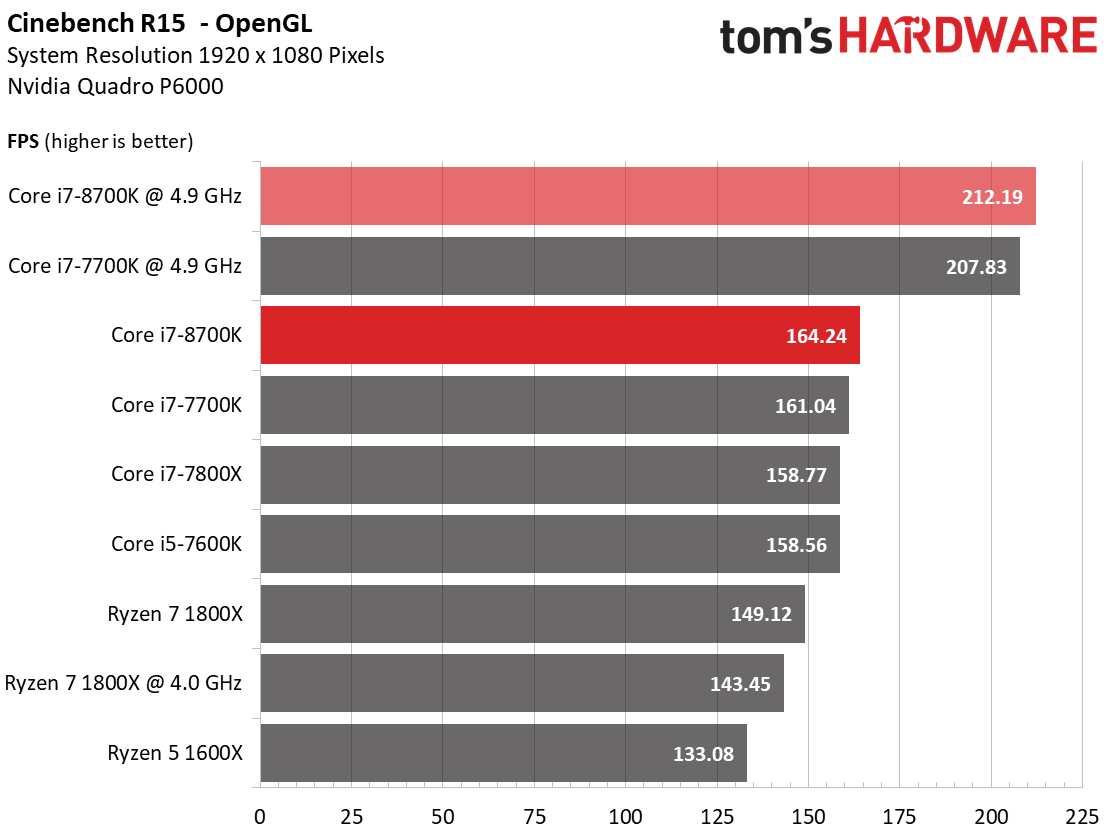
Cinebench R15 OpenGL
Frequency is (almost) everything in the Cinebench R15 OpenGL benchmark. However, Intel’s Core i7-7800X does better than usual.
Our overclocked Ryzen 7 1800X lands behind the stock configuration, regardless of how many times we re-run the benchmark, and we don't have a good explanation as to why.
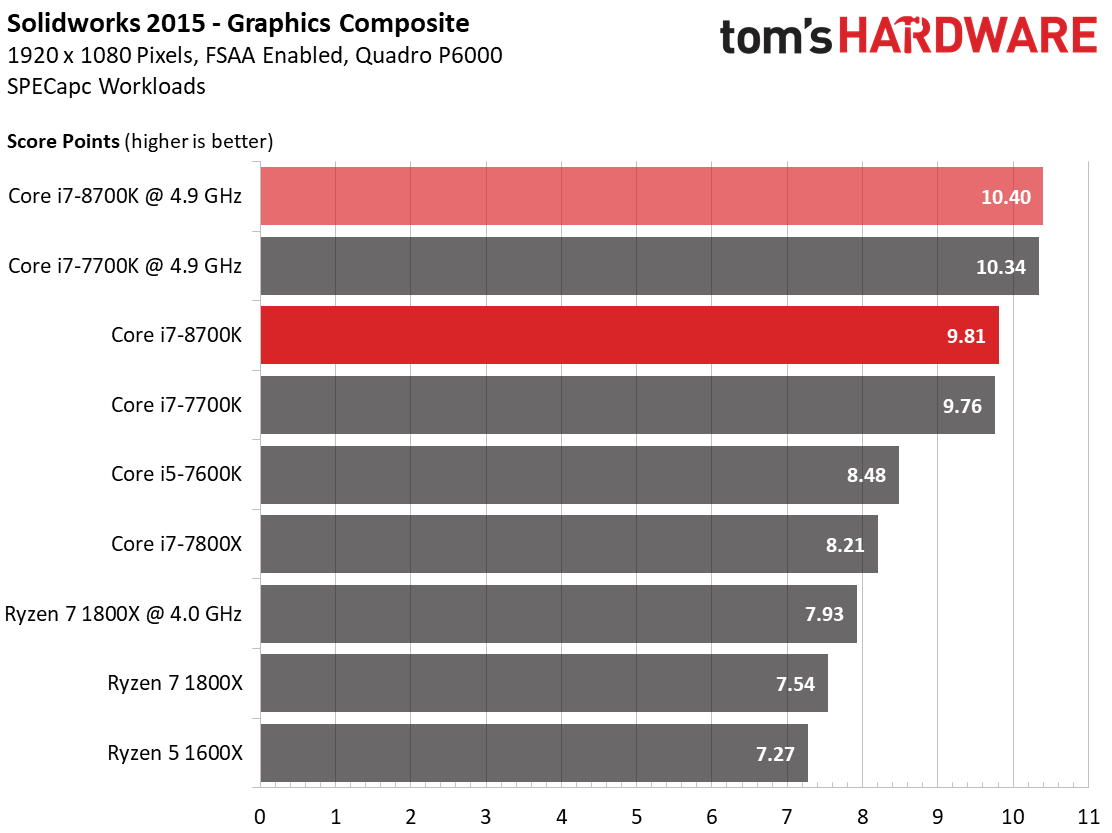
SolidWorks 2015
SolidWorks 2015 also emphasizes clock rate. At the same frequency, Coffee Lake and its predecessor end up in the same place. This doesn’t come as a surprise though, since SolidWorks 2015 typically doesn’t use more than four cores. The exceptions are a few very specific tasks, which we’ll see tested when we get to the CPU composite score on the next page.
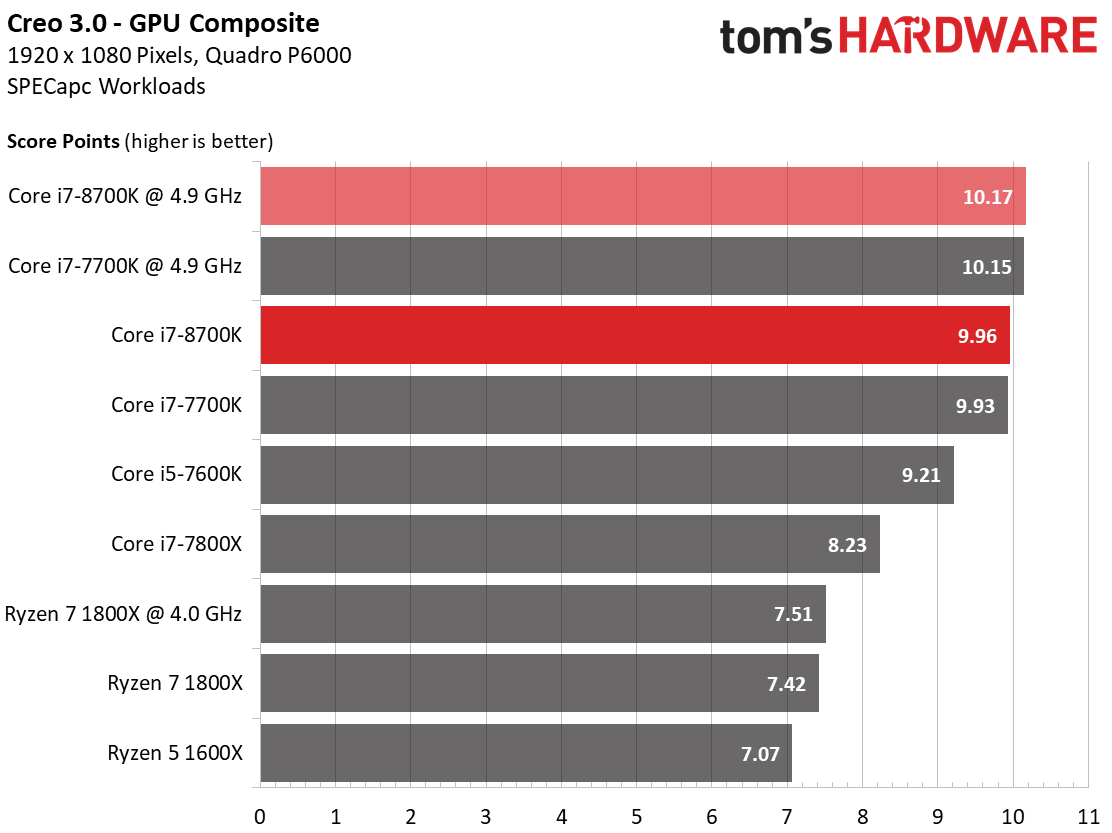
Creo 3.0
Creo 3.0 paints a similar picture; a high core count just doesn’t provide any benefits when it comes to drafting using real-time 3D graphics output.
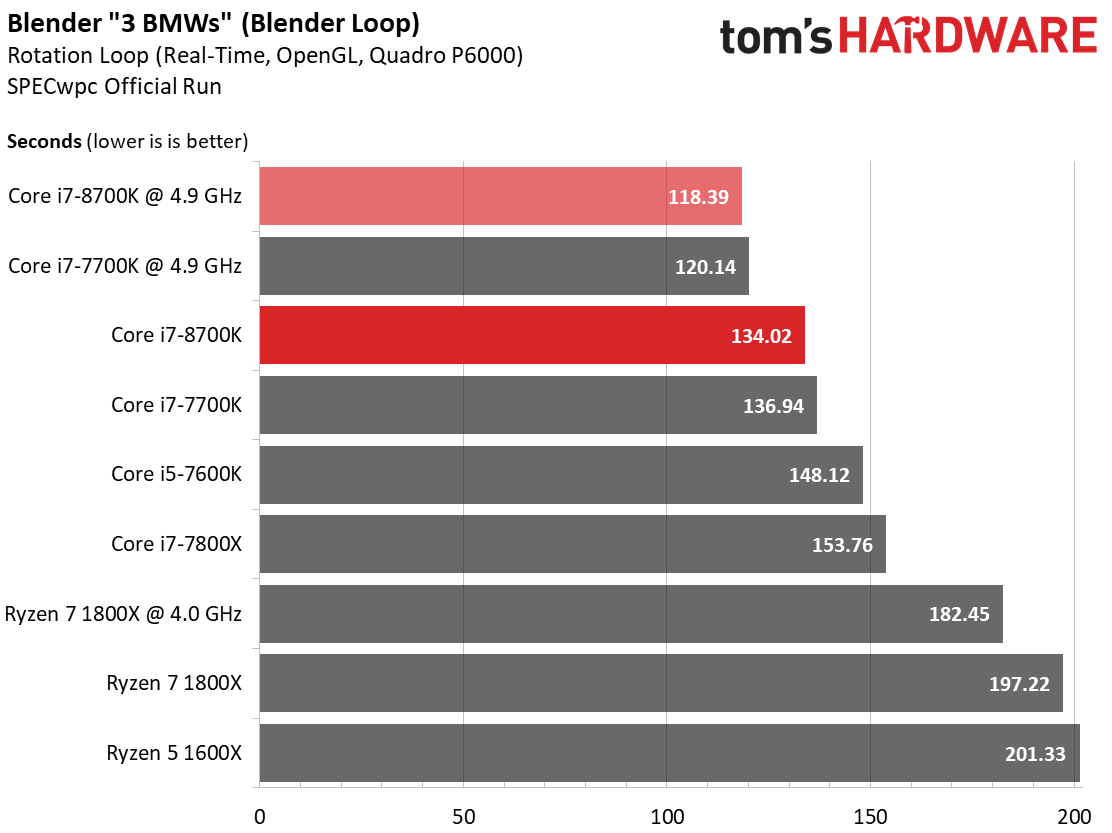
Blender & 3ds Max (Real-time 3D Preview)
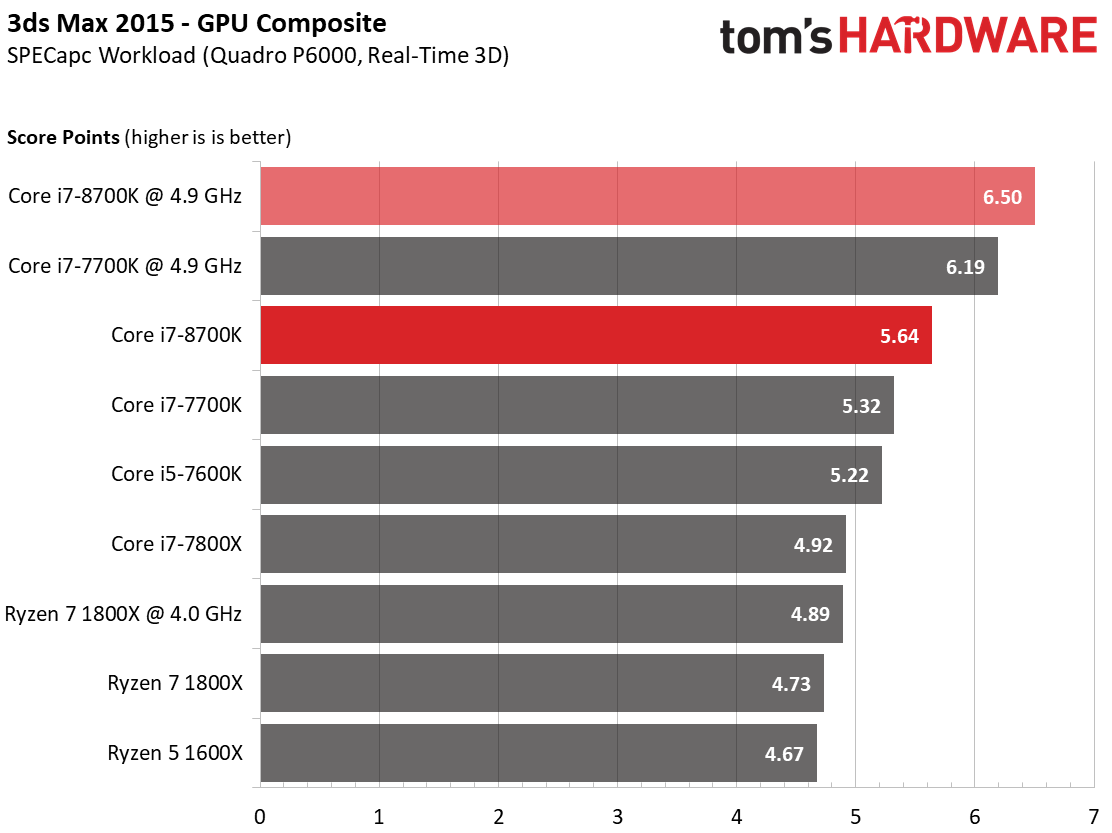
The Blender and 3ds Max real-time 3D previews yield similar results: frequency is everything. Of course, final rendering is a different story, and we'll get to that shortly.
The 3ds Max results aren’t based on time to completion. Rather, this benchmark generates a composite index based on CPU performance during a set time period.
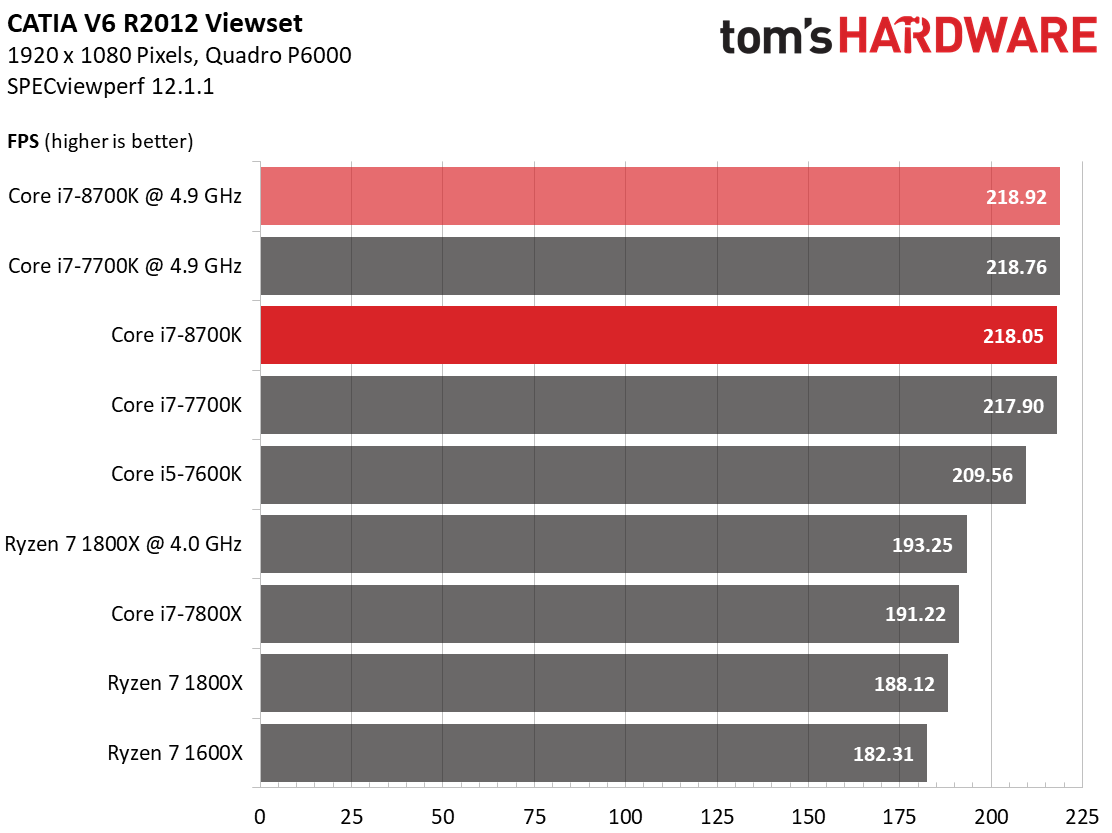
Catia V6 R2012
This is one of the graphics benchmarks that has been optimized time and again (it’s part of the free SPECviewperf 12 suite). However, it still provides a fairly good measure of CPU performance, with an emphasis on clock rate. Based on the previous benchmark results, you can guess how this story ends.
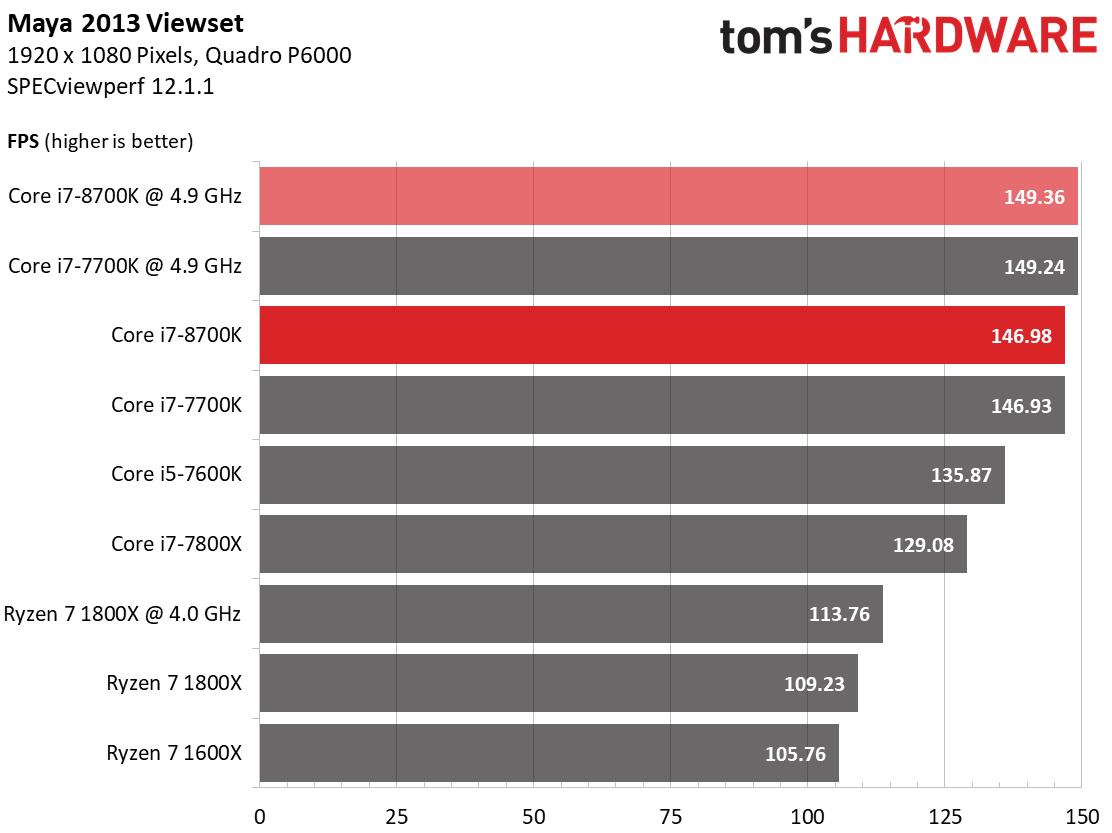
Maya 2013
At the risk of beating a dead horse, our chart paints a picture we've seen several times already. The real-time 3D output numbers don’t tell a complete story, though. As we're about to see, core count reigns supreme when it comes to final rendering.
What we can say is that two additional cores don't hurt Intel's Coffee Lake-based flagship. That's good news for a six-core chip trying to prove itself against a smaller quad-core design. The test results should only get better from here.
MORE: Best CPUs
MORE: Intel & AMD Processor Hierarchy
MORE: All CPUs Content
Current page: 2D & 3D Workstation Performance
Prev Page DTP, Office, Multimedia & Compression Performance Next Page CPU Computing & Rendering Performance
Paul Alcorn is the Editor-in-Chief for Tom's Hardware US. He also writes news and reviews on CPUs, storage, and enterprise hardware.
-
cknobman Looks like it might be time for AMD to lower prices.Reply
AMD really has shaken Intel up, never would I have dreamed (before this year) I'd see Intels best gaming cpu (especially a K model) release at $360. -
AgentLozen AMD's price per core is still very strong. It struggles in gaming at 1080p but Tomshardware didn't provide data in 1440p or 4K.Reply
I'm not yet convinced that AMD is in trouble. -
saunupe1911 Hmmm is it worth a skylake 6700K that's stable at 4.6 Overclock to upgrade? Probably not. I wouldn't mind 6 cores though. I wonder how many will hit 5.0!Reply -
jroc188 8700k is $480ca got the R5 1600 for $255ca and mobo for $120ca. $375 all together and more then happy with the gaming results. But the 8700k dose look sweet on the benchmarks. AMD with a price drop will still sell wellReply -
shrapnel_indie ReplyOf course, while Intel's accelerated Coffee Lake-S launch makes it look today's unveiling is a direct response to heated competition, in reality, the long incubation period for new processors means it’s more likely the result of 10nm manufacturing delays.
Ummm... Yeah, the design may have been kicking around, and ready to go before Ryzen, but when it is released months earlier than scheduled.... Saying that it wasn't a response to Ryzen seems more like misinformation more than pure fact. Yeah, I don't doubt 10nm manufacturing delays played a part in the previous release date, but Ryzen forced its release a little earlier than planned. -
bloodroses To AMD fanbois who claimed that Intel was toast and couldn't respond to Ryzen's release, here's Intel's Mic drop. *thud*Reply
For the rest of us consumers, this is great news for continued strong competition at reduced prices from both companies. :) -
massacre.h4te Nearly 90 degrees Celsius when overclocked gaming on an AiO. Prettttttty toasty!Reply -
saunupe1911 Reply20241606 said:To AMD fanbois who claimed that Intel was toast and couldn't respond to Ryzen's release, here's Intel's Mic drop. *thud*
For the rest of us consumers, this is great news for continued strong competition at reduced prices from both companies. :)
Z370 motherboards are expensive though...sheesh. And you gotta reach out to liquid cooling companies for attachments for mounting to this socket. Canon Lake may be out before you can get everything situated for a nice 8700k upgrade lmao. -
FormatC Reply
The reason is simple:20241615 said:Nearly 90 degrees Celsius when overclocked gaming on an AiO. Prettttttty toasty!
The built-in frying fat between IHS and die :) -
LilDog1291 Reply20241606 said:To AMD fanbois who claimed that Intel was toast and couldn't respond to Ryzen's release, here's Intel's Mic drop. *thud*
For the rest of us consumers, this is great news for continued strong competition at reduced prices from both companies. :)
I don't know if I would call 90C+ on a chiller cooler (granted its a high overclock but the 7700k had the same problem) a mic drop but it is definitely a step in the right direction. If they can get their temperatures under control in the next generation they will win my vote back.
