Intel Optane SSD 900P Review: 3D XPoint Unleashed (Update)
Why you can trust Tom's Hardware
512GB And VROC RAID Performance Testing
Comparison Products
In the previous section, we tested the Intel Optane SSD 280GB against products with comparable price points. That meant 1TB-class NVMe SSDs. There aren't any consumer SSDs with price points similar to the Optane SSD 480GB, so we're comparing it to other 512GB-class SSDs.
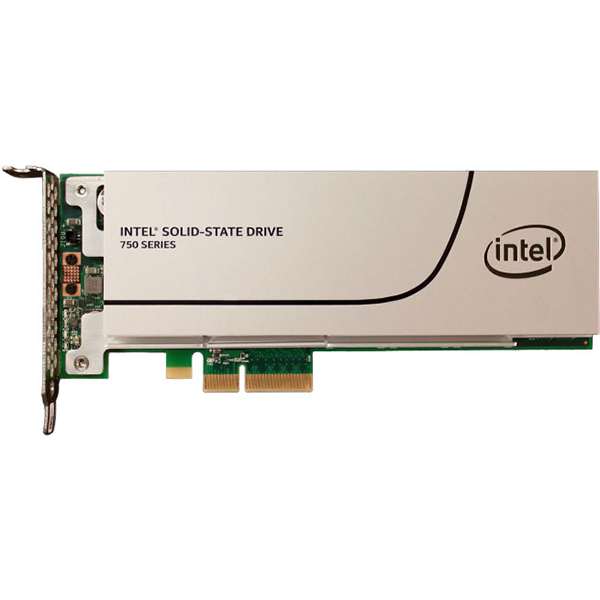
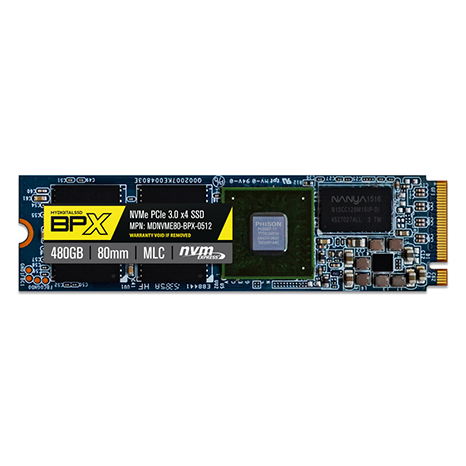
The Intel 600p and MyDigitalSSD BPX represent the entry-level NVMe class, while the Toshiba RD400 and Plextor M8Pe (the add-in card with a heatsink version) land in the middle of the NVMe performance hierarchy. The Intel SSD 750 and Samsung 950 Pro make up the high-performance tier.
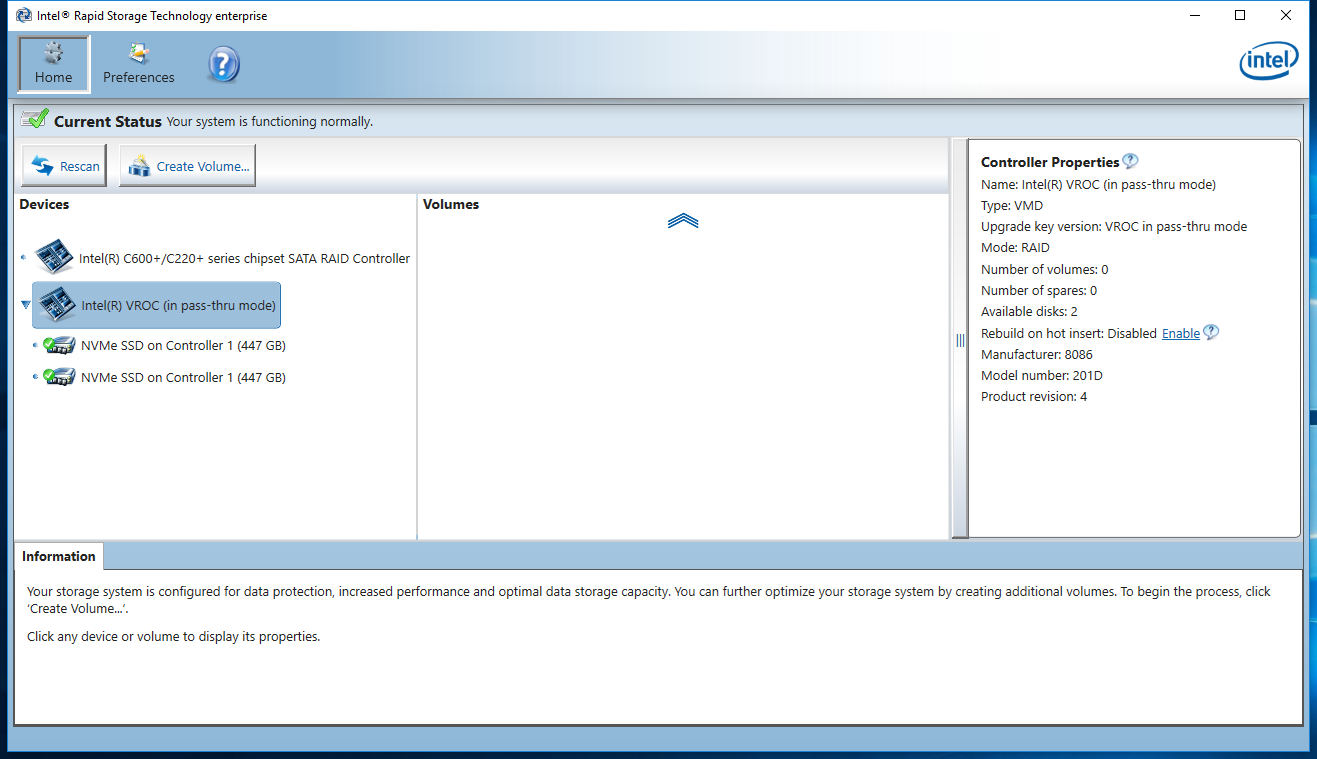
We have also answered your requests for RAID testing with a pair of Intel Optane SSD 900P 480GB drives in a VROC (Virtual RAID On CPU) array.
Intel X299 VROC Settings
Motherboard vendors ruffled a few feathers when they demoed Intel's VROC technology at Computex 2017. The technology brings RAID functionality on-die and allows for bootable NVMe volumes. But some of the arbitrary restrictions, including the requirement to purchase an additional dongle to use RAID 5 or non-Intel SSDs, doesn't mesh well with the enthusiast crowd.
Intel's VROC technology will work out of the box with two Optane SSD 900P drives. Because the drives come from Intel, you don't need to purchase a dongle (you've already paid the Intel tax to get this setup running). VROC only supports RAID 0 or 1 without a dongle, however, so you'll still have to purchase the dongle for RAID 5 support. We only have two drives, so that isn't a big issue--RAID 5 requires a minimum of three drives.
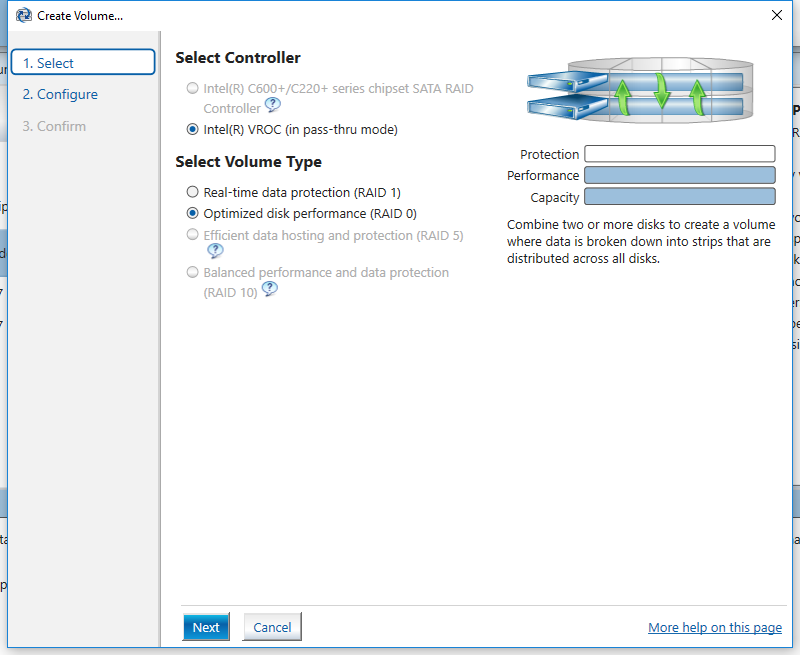
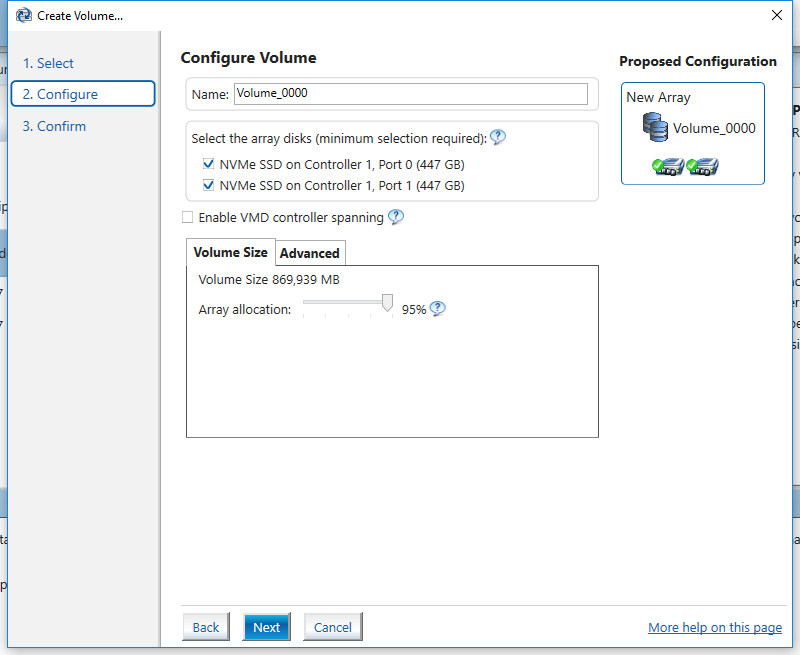
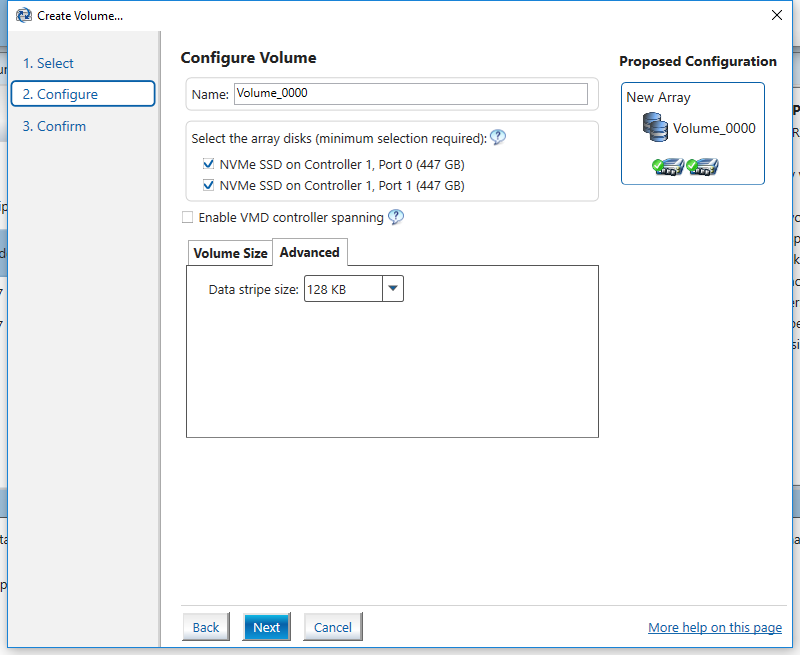
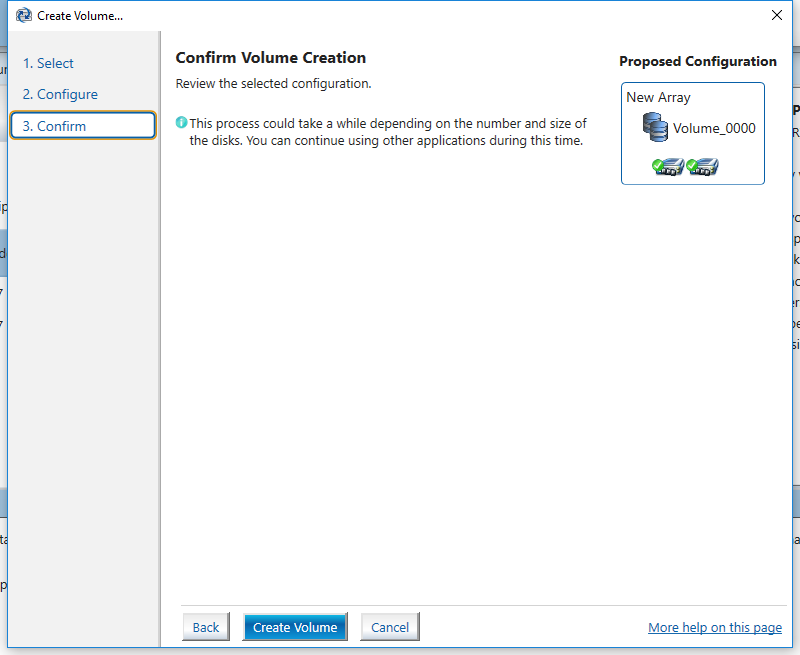
Assembling the VROC array on our Asrock X299 Taichi motherboard wasn't easy. VROC isn't well documented, and we believe Intel rushed it to market. We had to move our video card down to the third PCI Express slot and place our 900P SSDs in the first and fifth slots. That allowed us to check the correct boxes in the UEFI BIOS to build the RAID 0 array.
We used a 128KB data stripe, the VROC default, for the RAID 0 array. This stripe size favors sequential access patterns over random data, but this is an adjustable parameter. If your workloads consist of smaller random accesses, you can adjust the stripe size to a smaller value. Intel's PCH RAID uses a default 16KB stripe size that we often recommend for general computing.
Get Tom's Hardware's best news and in-depth reviews, straight to your inbox.
The array came together after we worked out all of the platform limitations and had configured the software. The Optane SSD 900P drives are so fast that any latency penalties due to sub-par RAID scaling will be easy to identify.
Sequential Read Performance
To read about our storage tests in depth, please check out How We Test HDDs And SSDs. We cover four-corner testing on page six of our How We Test guide.
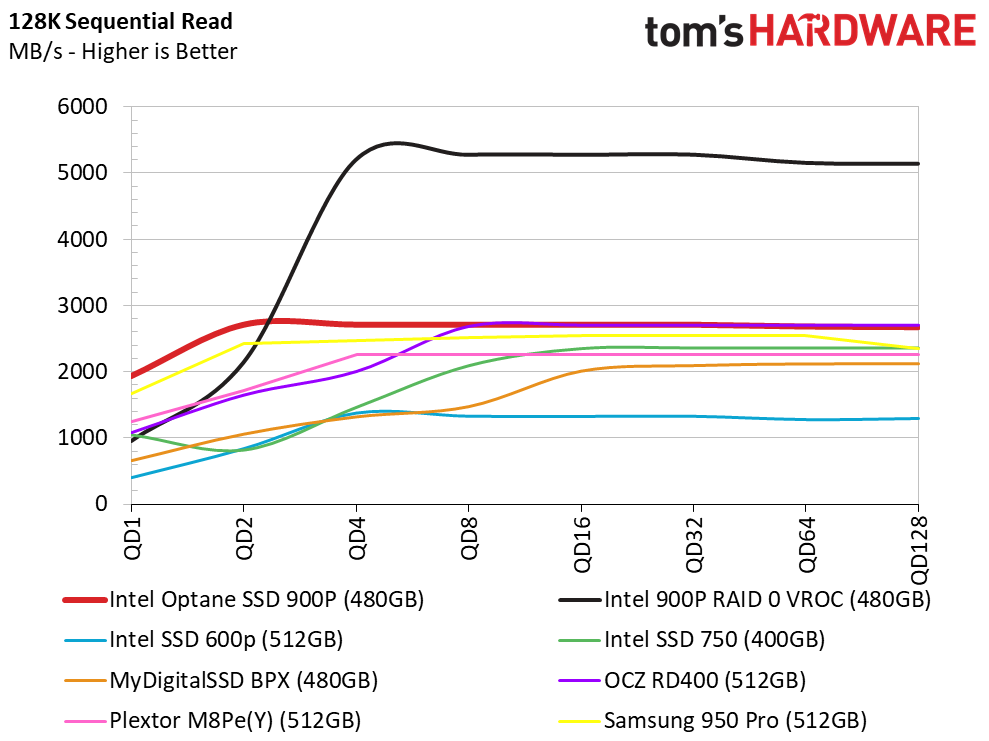
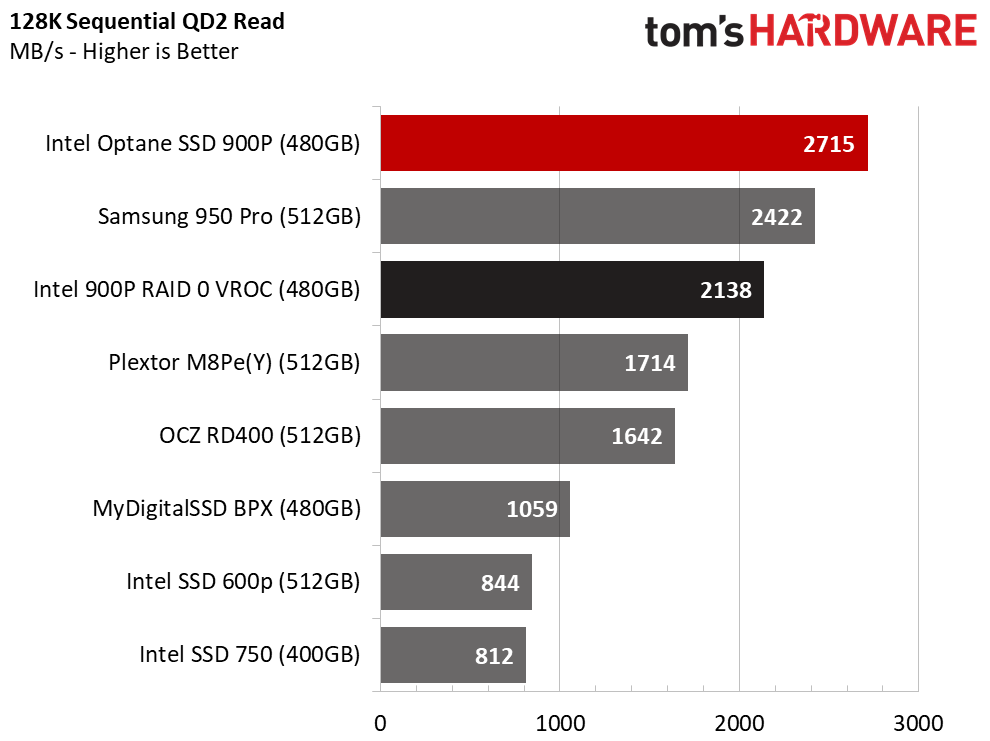
The high-capacity 480GB Optane has the same performance specifications as the 280GB model. The same latency advantages at low queue depths shine through during the sequential read test.
It appears that VROC was not designed with 3D XPoint memory in mind, though. Combining the Optane drives into a RAID 0 array brings QD1 performance down to traditional SSD levels. Even at QD2, the Samsung 950 Pro is slightly faster than the Optane array. The VROC array reaches its peak performance at QD4 with nearly 5,500 MB/s of throughput.
The Samsung 950 Pro has the lowest latency of any NVMe NAND-based SSD. In this chart, you can see the 950 Pro well above the other "normal" SSDs at QD1, but the single 900P 480GB drive beats it easily.
Sequential Write Performance
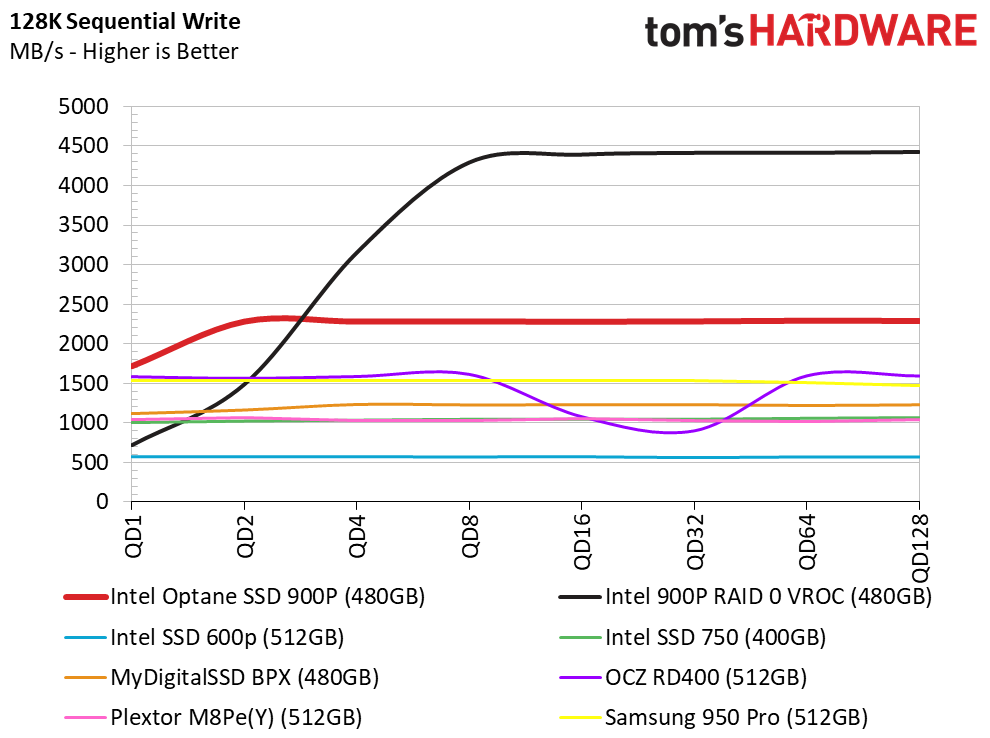
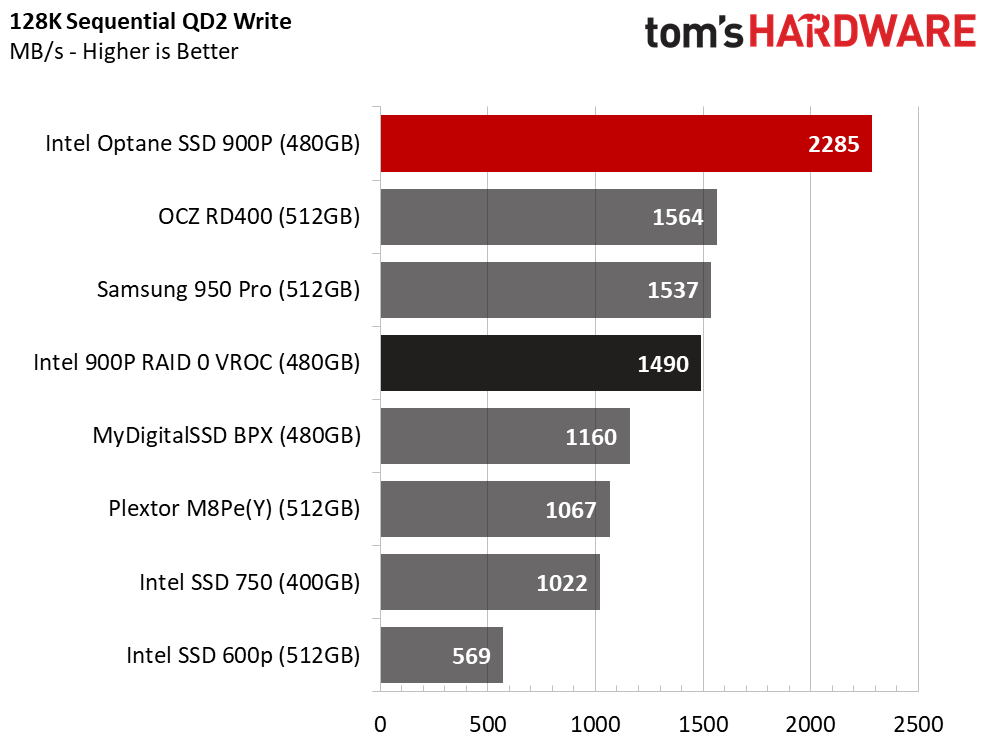
Two other SSDs challenge Optane's QD1 sequential write speed but adding just one more command into the queue (QD2) is enough for the 3D XPoint technology to take off and leave the others behind.
The VROC array struggles at low queue depths again. We still measured around 600 MB/s at QD1 and 1,500 MB/s at QD2. By QD4, the array again stepped away from the single drives on its way to nearly 4,500 MB/s of throughput.
Random Read Performance
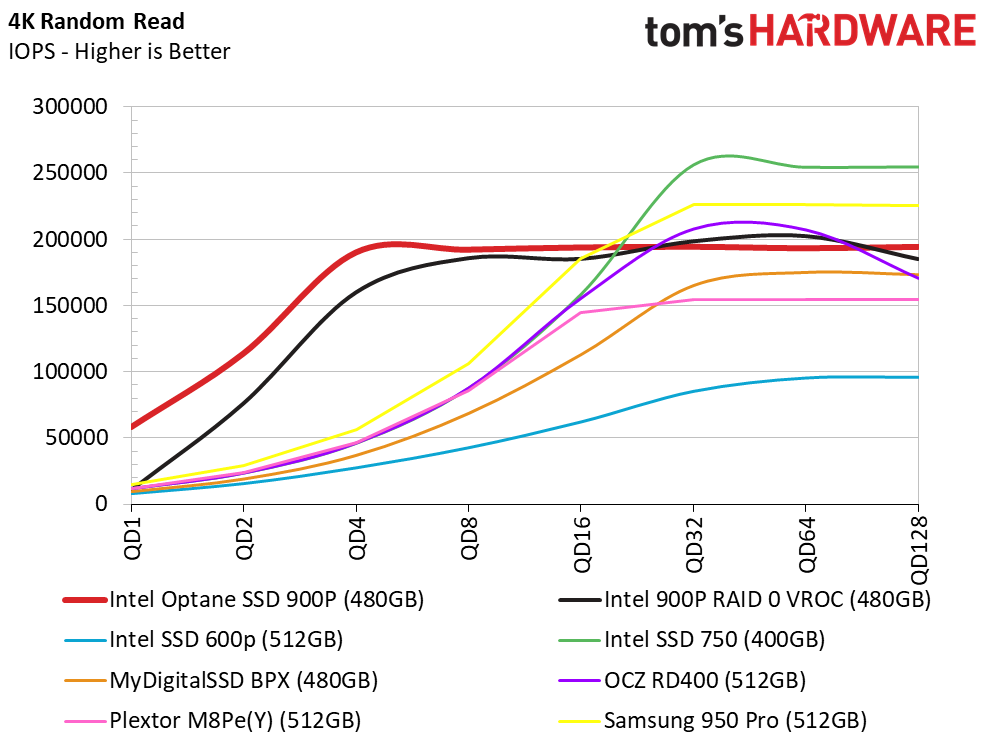
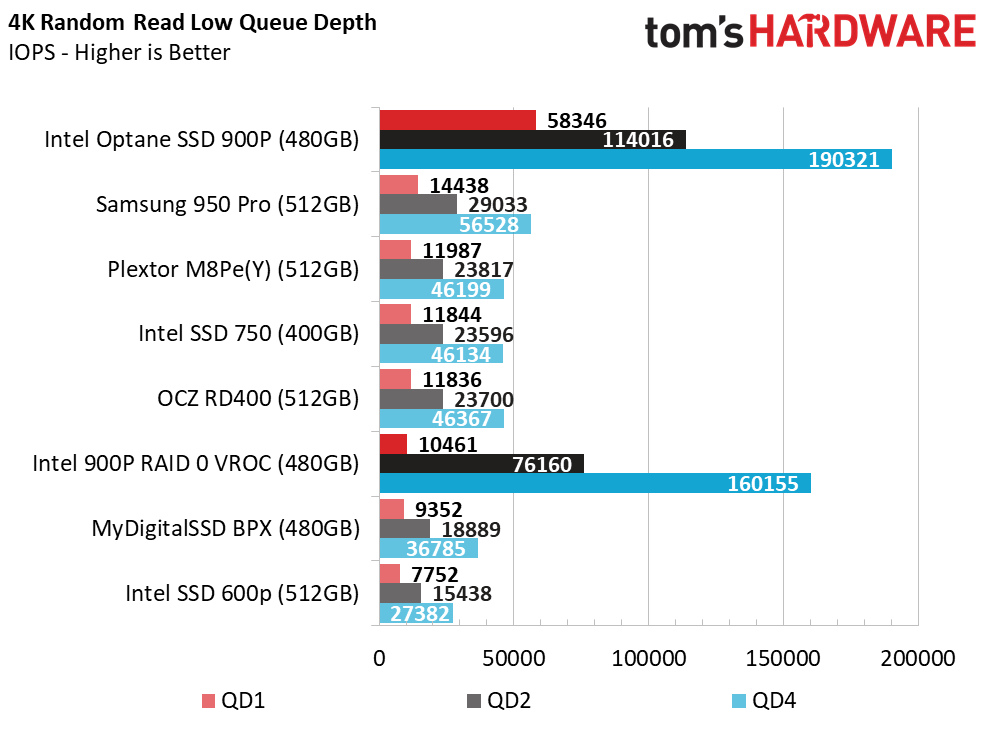
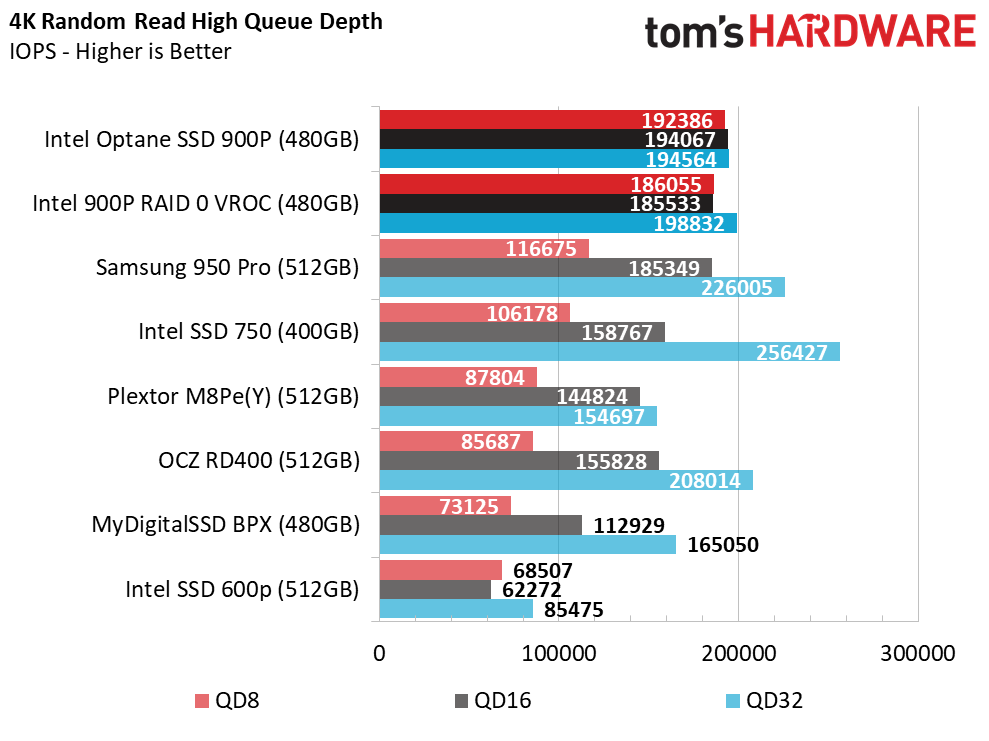
Optane destroys the normal tendencies we see with NAND-based drives. A single Optane 900P SSD grossly outperforms NAND-based products during random read workloads, particularly at low queue depths. The 900P 480GB achieves nearly 60,000 IOPS at QD1. Before Optane, we would get excited about a 2,000 IOPS increase from one product generation to the next.
VROC erases Optane's QD1 performance advantage. The array's QD1 random read performance falls to just over 10,000 IOPS. At QD2, the array shoots up to just over 76,000 IOPS. That's twice as much performance as the closest NAND-based SSD.
Random Write Performance
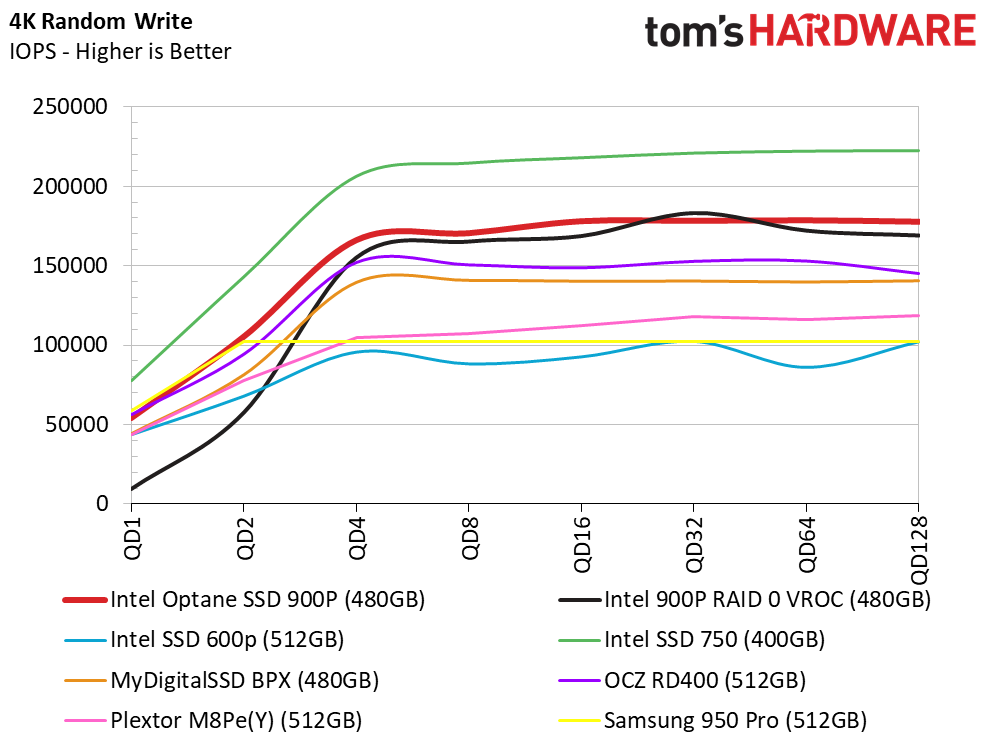
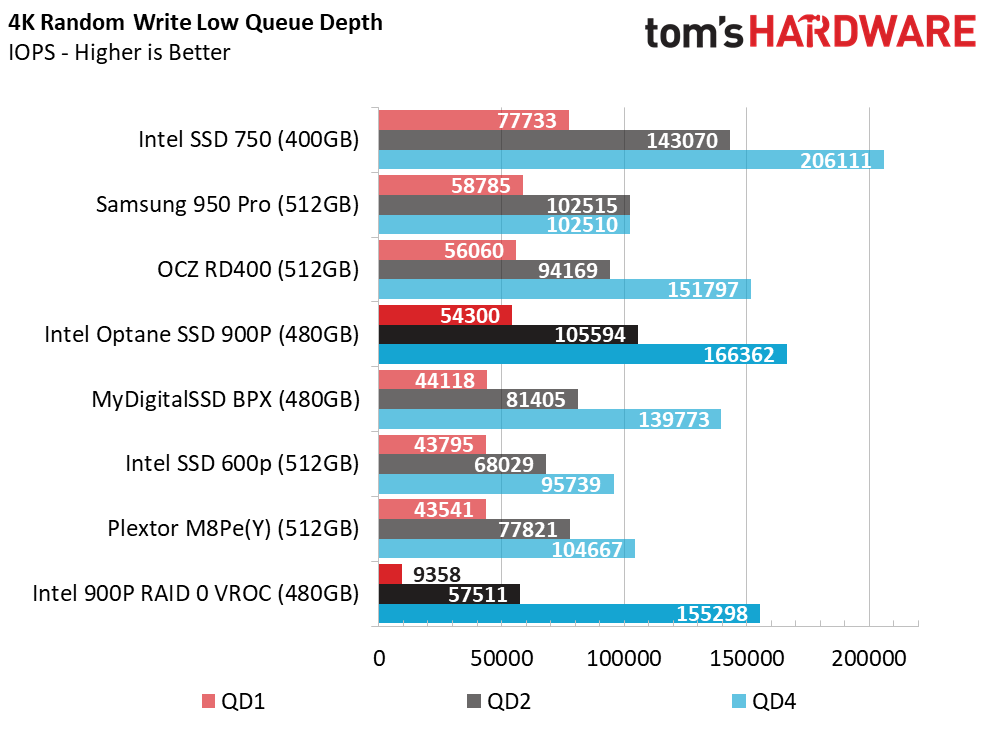
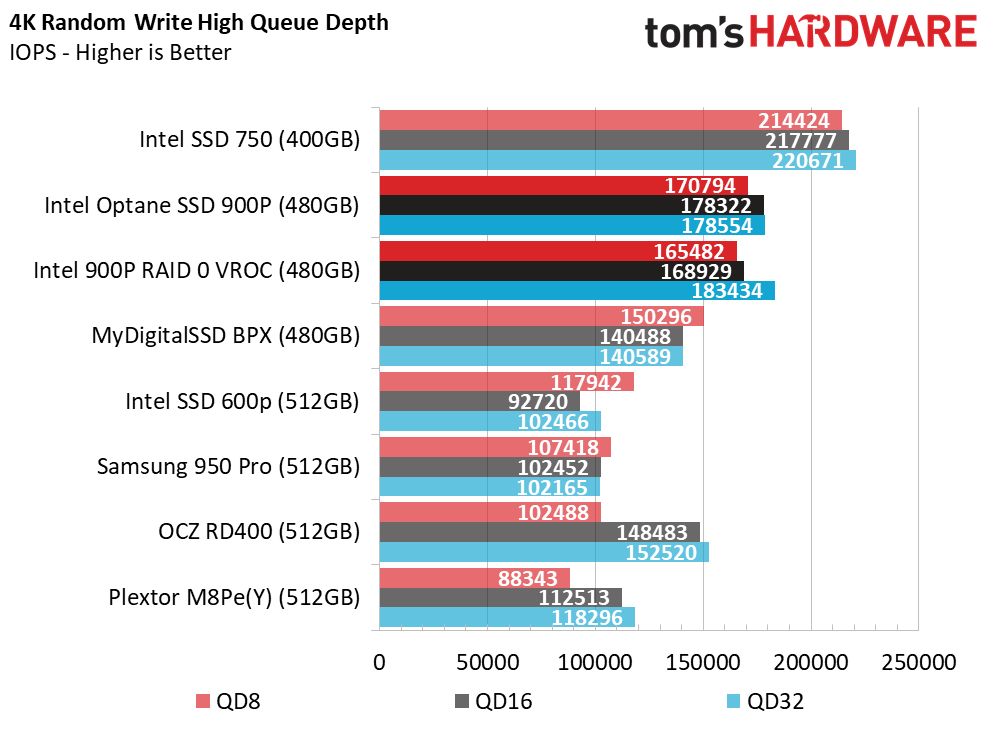
We see the same trends with the Intel 900P 480GB that we observed with the smaller model. Peak random write performance is about the same as a premium NAND-based NVMe SSD. It's speedy, but there isn't a huge advantage like we see in the three other corners of performance (random read, sequential read/write). Random write performance is already high with all SSDs, including those tied to a SATA bus.
Premium SATA SSDs deliver roughly 35,000 IOPS of random write performance at QD1. Hard disk drives deliver around 250 IOPS. The VROC array with two Optane SSDs only rises to 9,300 IOPS at QD1. By QD4, the array has caught up to the performance of a single SSD. It's very difficult to build up a queue full of waiting commands with drives this fast, so most of your random writes will occur at very low depths.
80% Mixed Sequential Workload
We describe our mixed workload testing in detail here and describe our steady state tests here.
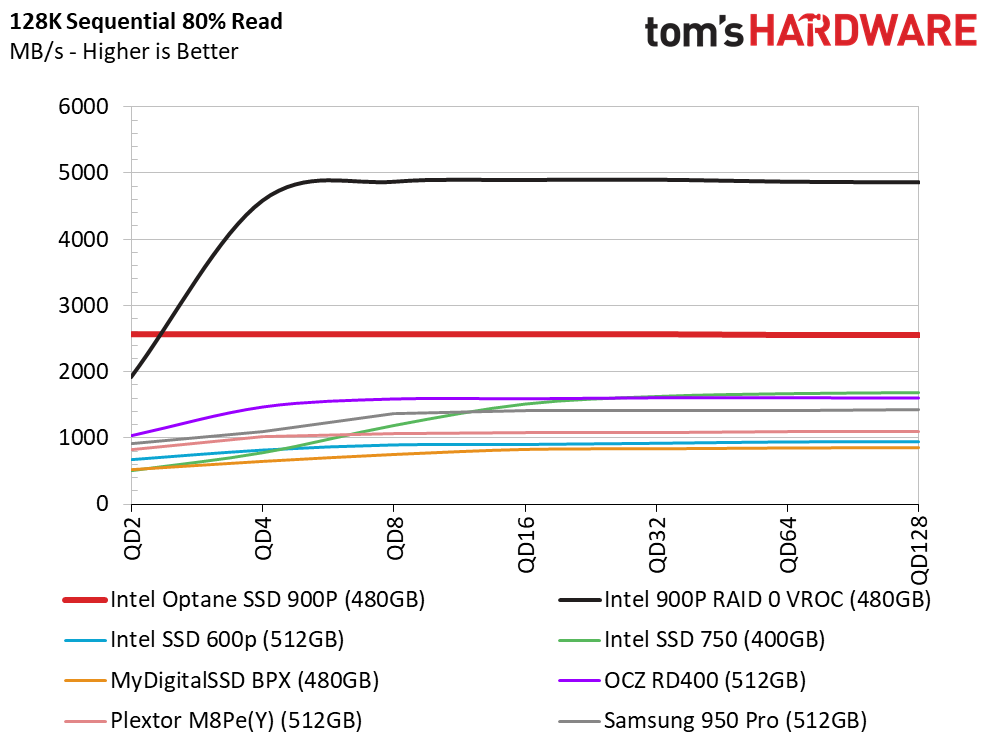
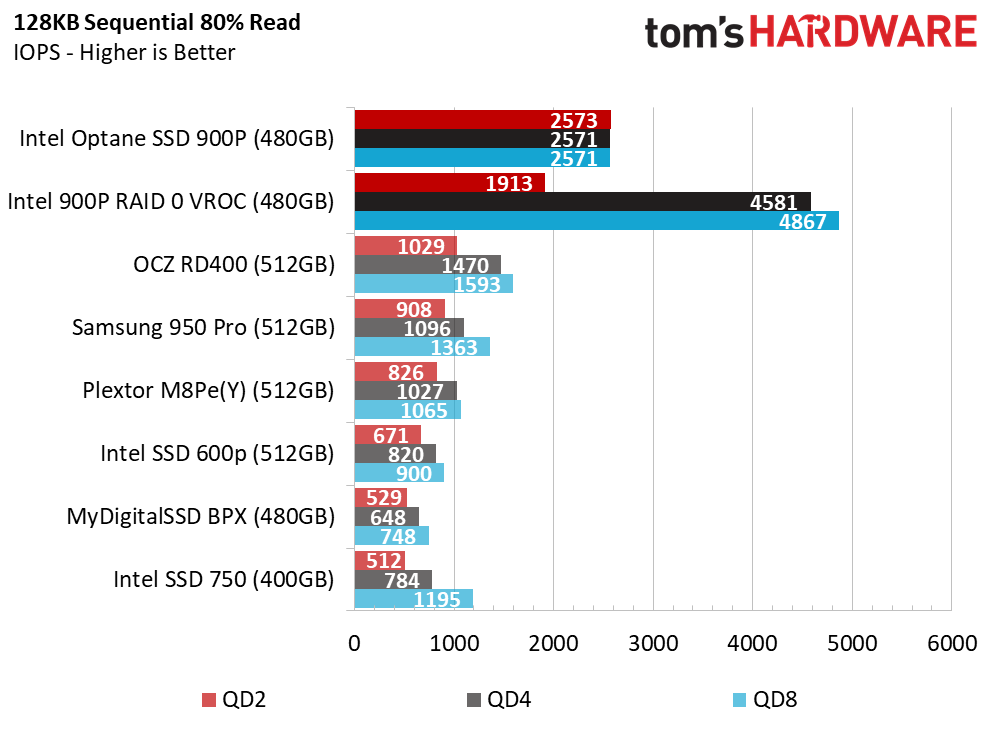
3D XPoint memory is amazing with mixed workloads. With a relatively low power controller, the 900P gives you ample headroom to tackle complex workloads. Optane technology delivers incredible performance advantages during heavy mixed sequential workloads.
80% Mixed Random Workload
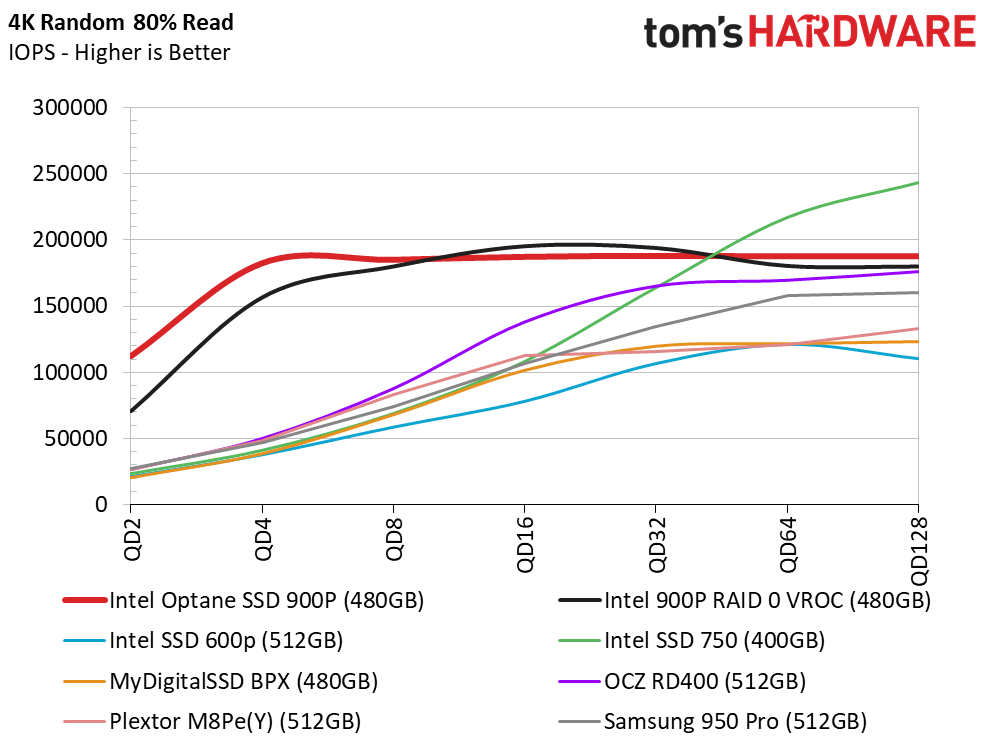
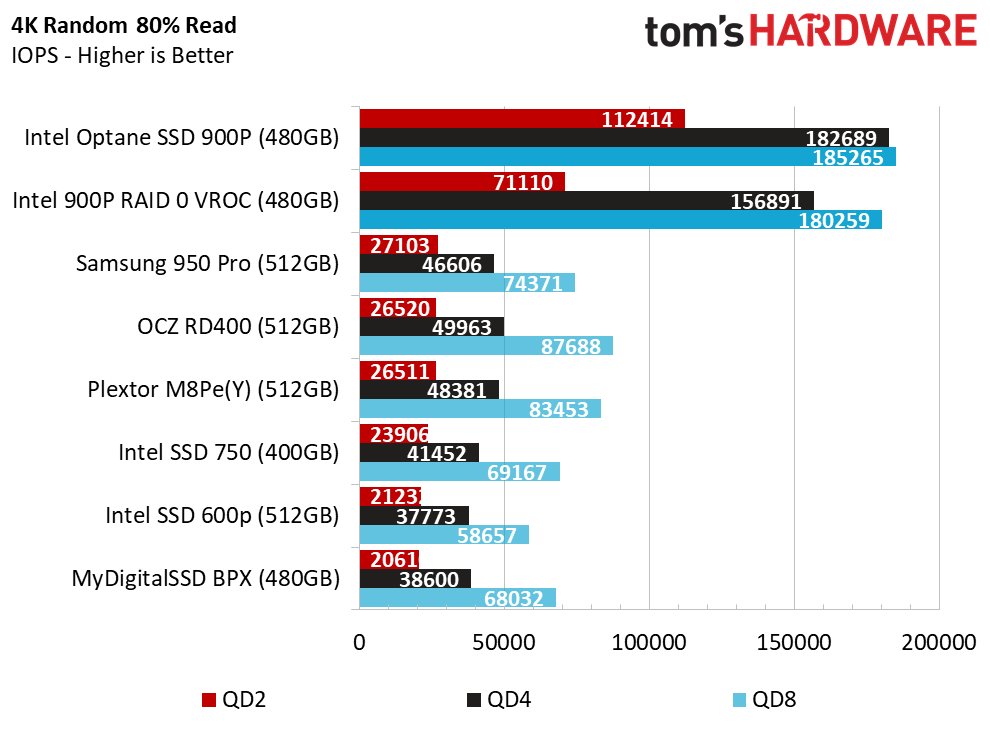
During the mixed random workloads, the Optane drives overcome their middling random write speed. We know that Optane can increase server efficiency by boosting processor utilization, and its no doubt that the 900P delivers massive performance advantages over NAND-based products. The real question is if a desktop user can take advantage of the performance Optane has to offer.
Sequential Steady-State
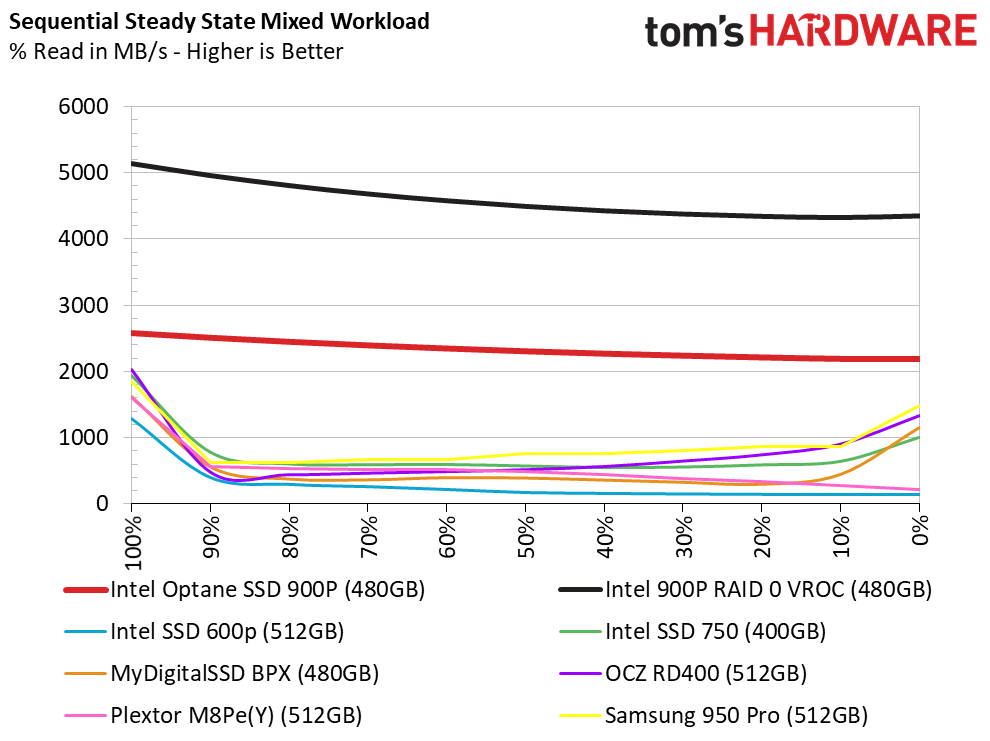
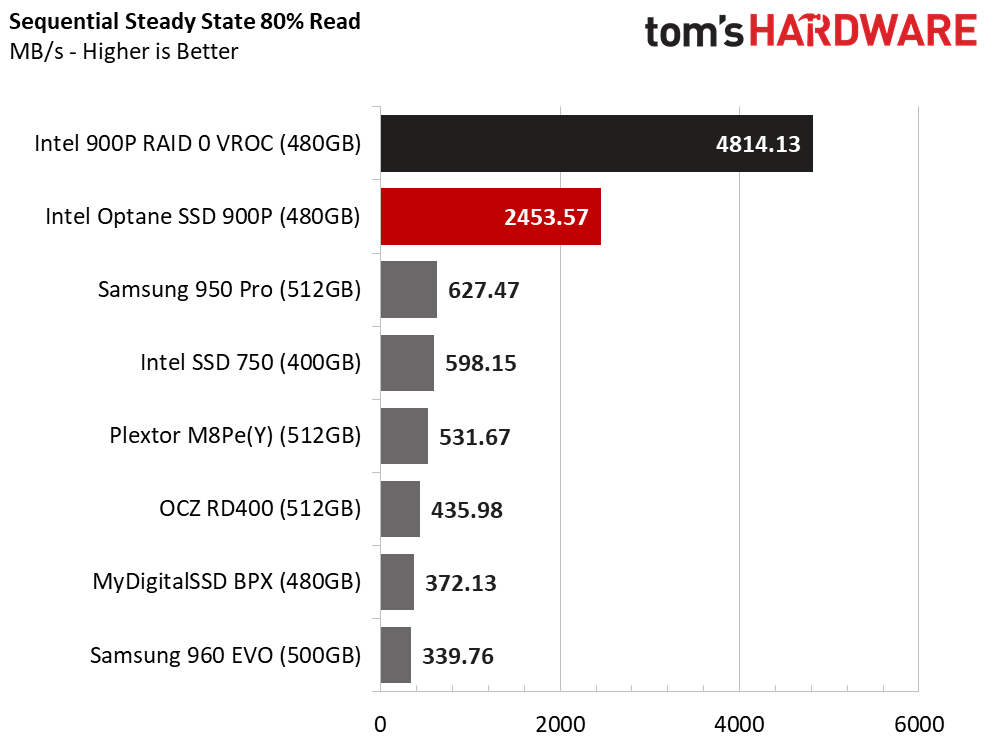
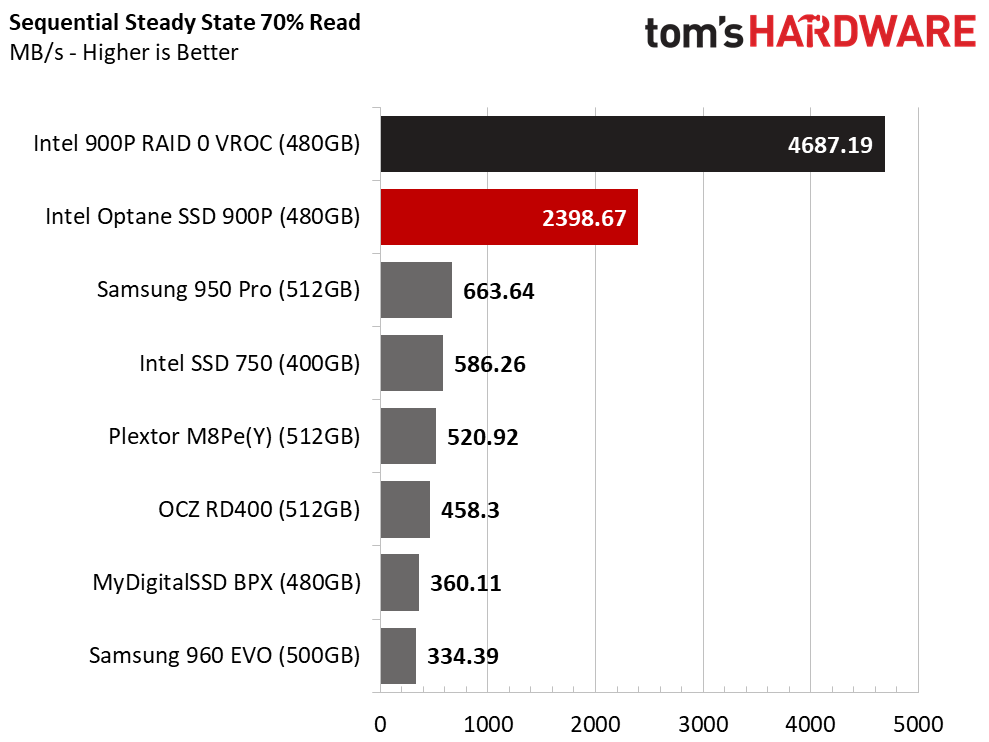
We wouldn't be surprised to see many consumer Optane 900P SSDs make it into servers, due in part to their very large dose of endurance. Other SSDs lose performance in steady-state conditions, but the 900P doesn't suffer from the same dropoff– it retains its fresh out of the box performance even after we increase the write mixture. These types of intense write workloads cause NAND-based SSDs to fall flat.
Random Steady-State
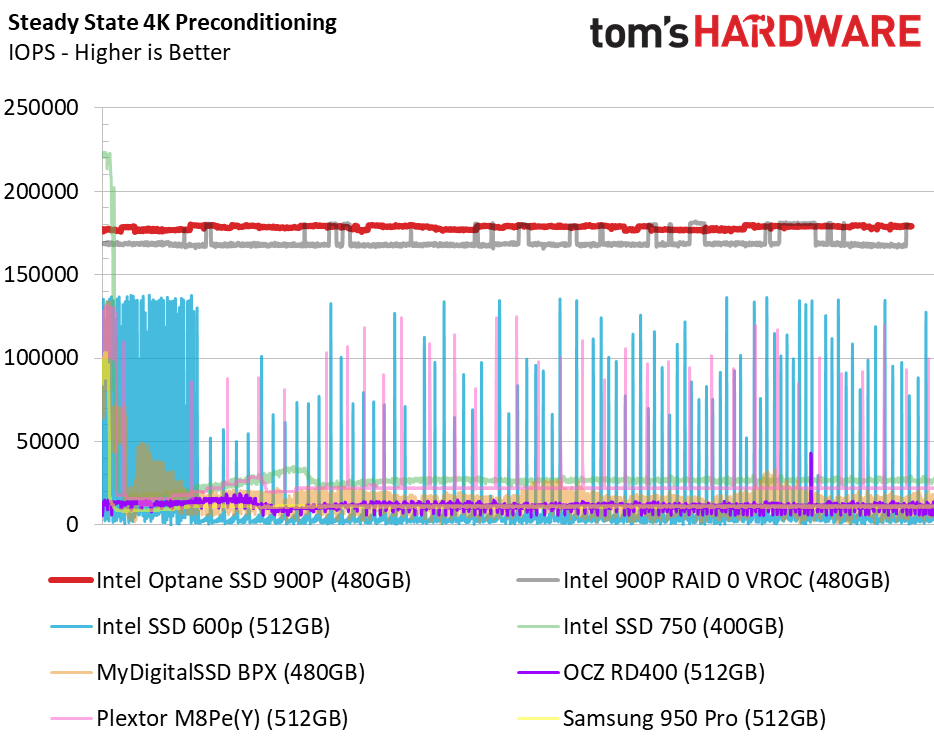
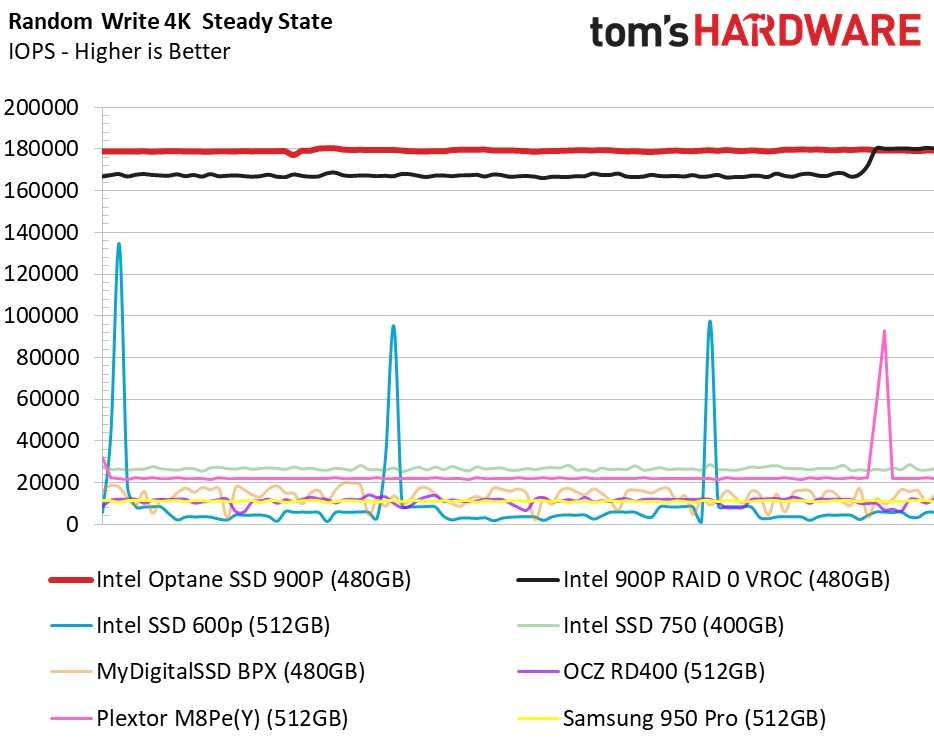
We used to rave about the Intel SSD 750 series' consistent random write performance in steady state. It still does a very good job, but the 900P literally raises the bar. Given the baby steps we see with flash technology, it could take at least twenty years for it to catch up to Optane if it ever does at all.
PCMark 8 Real-World Software Performance
For details on our real-world software performance testing, please click here.
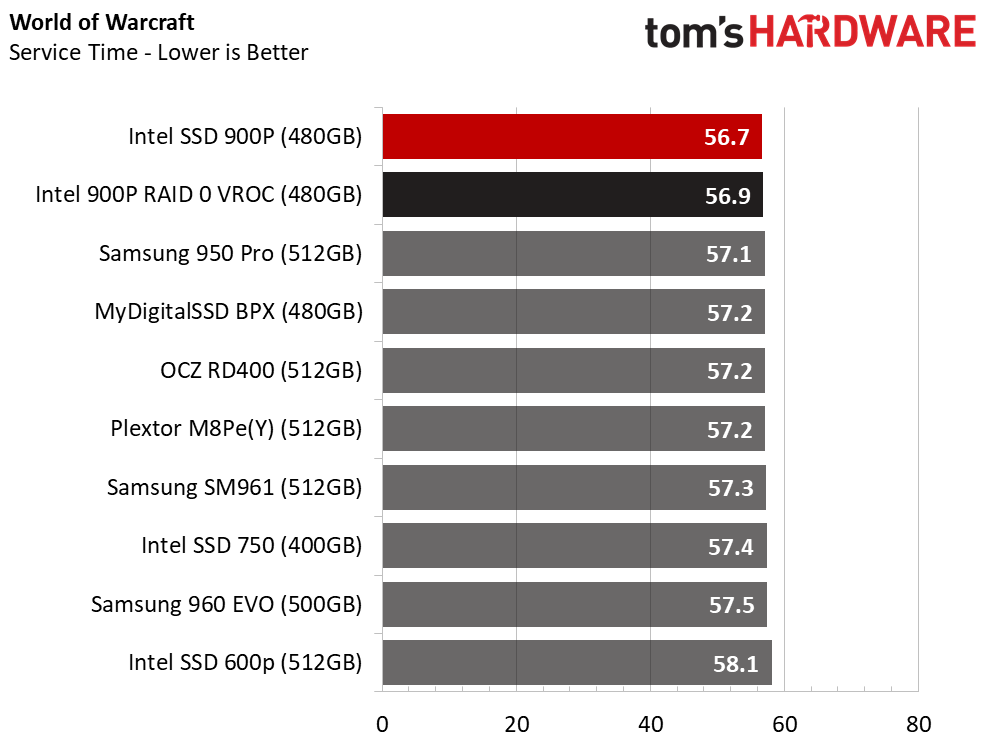
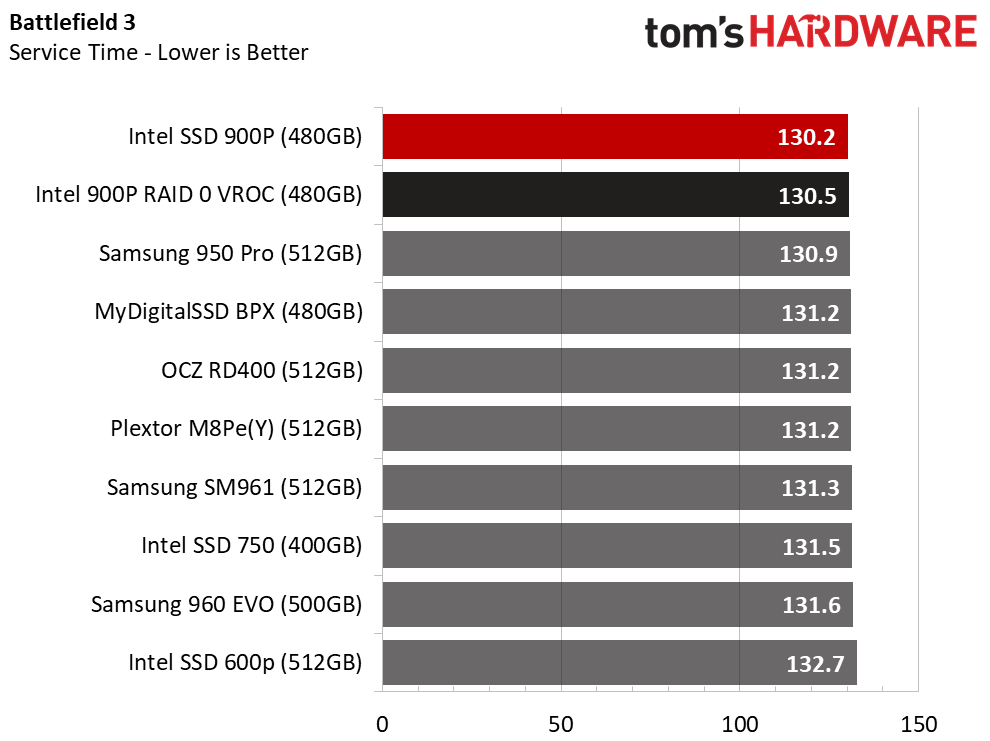
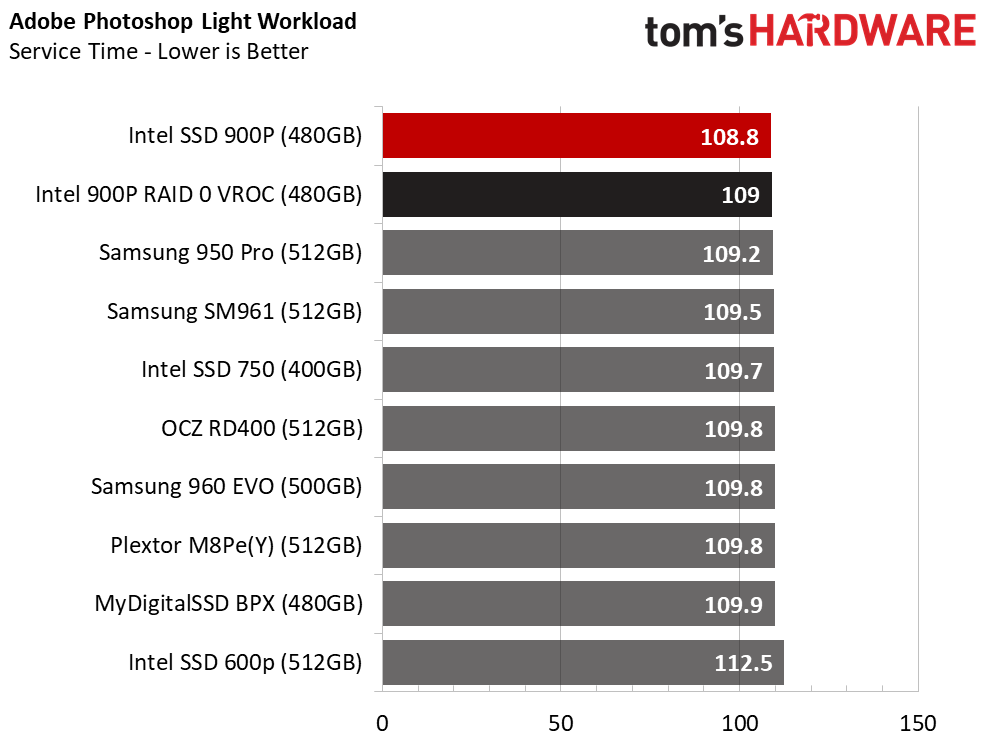
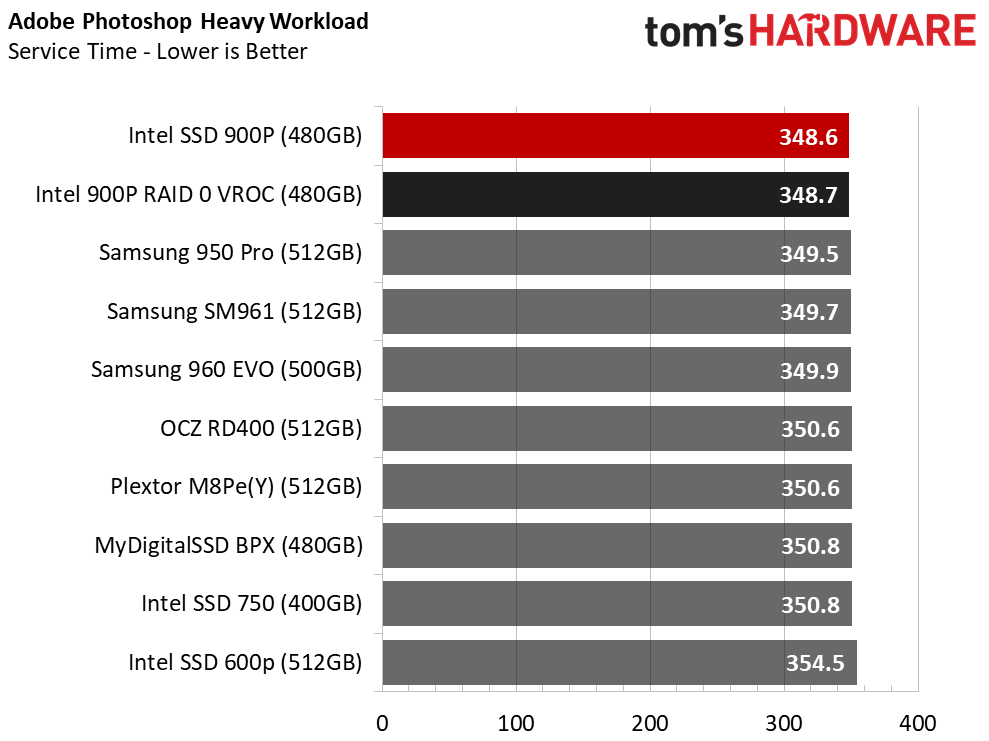
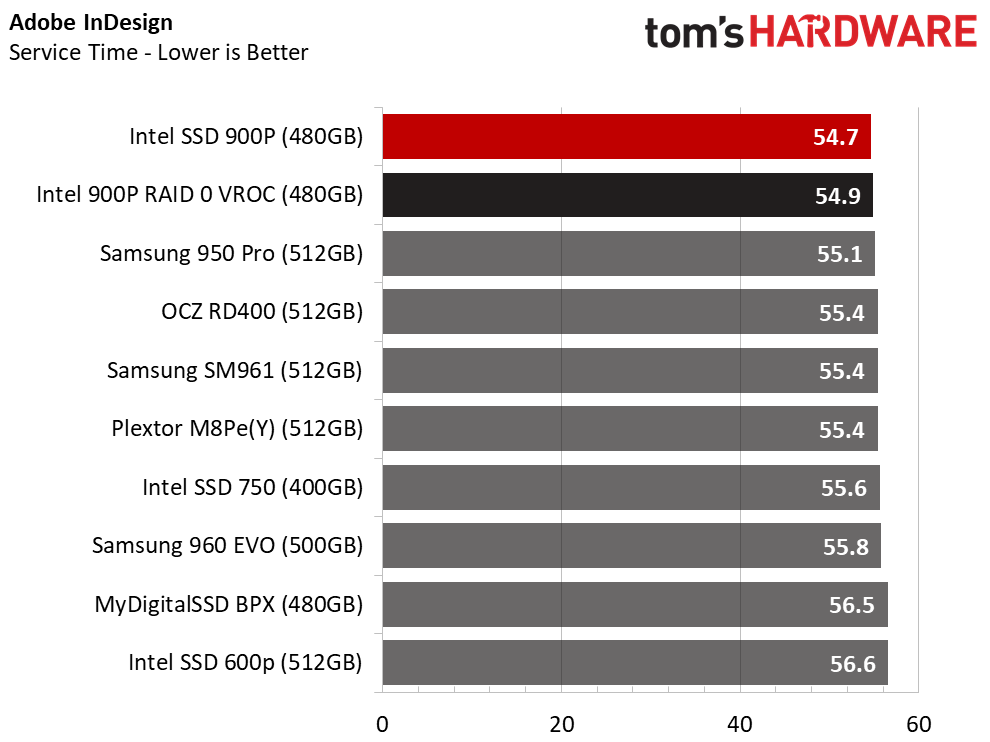
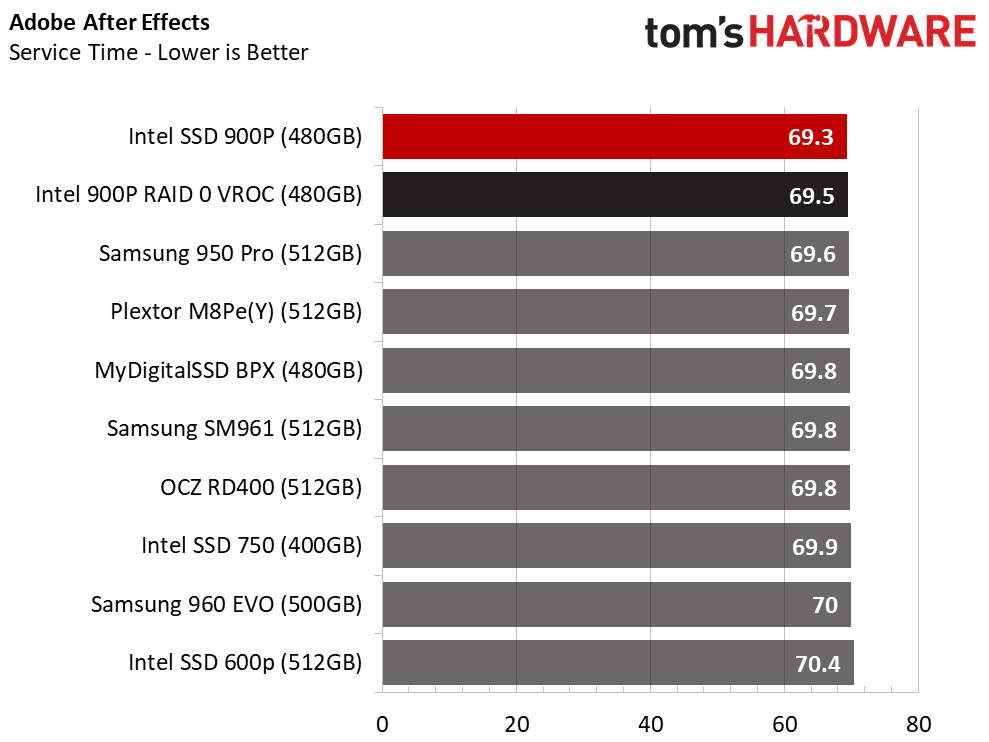
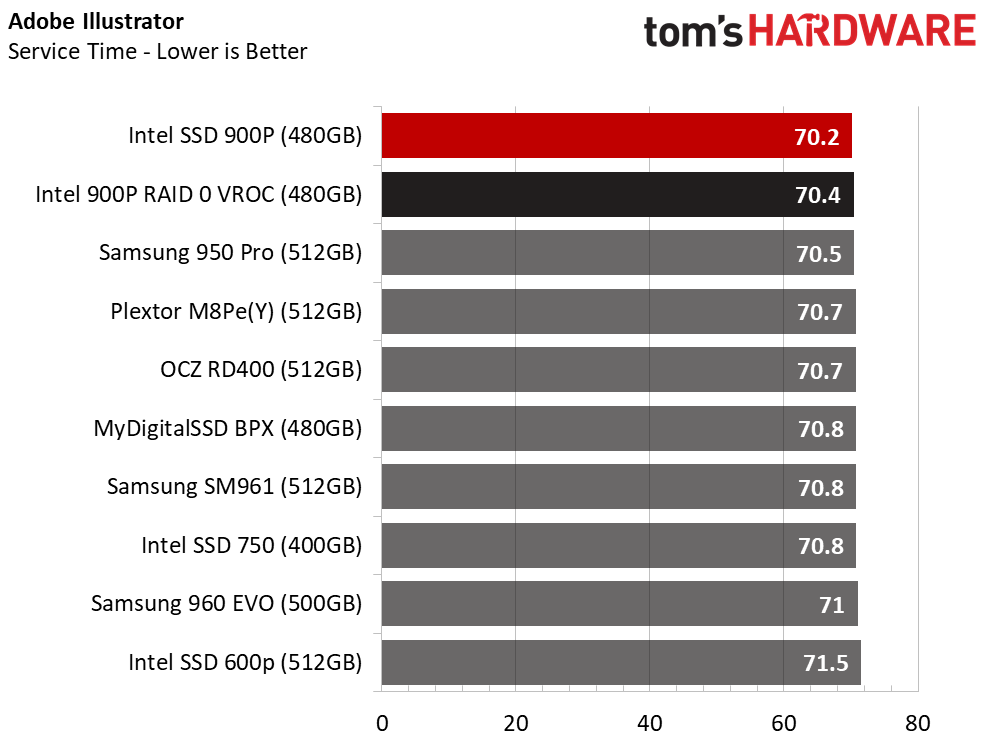
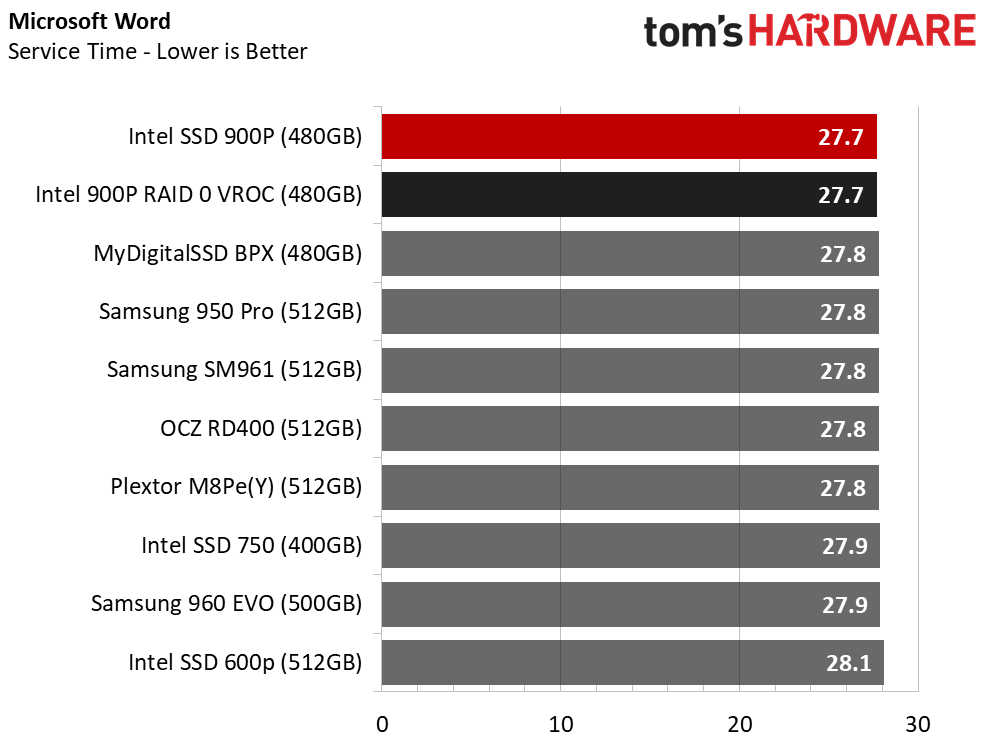
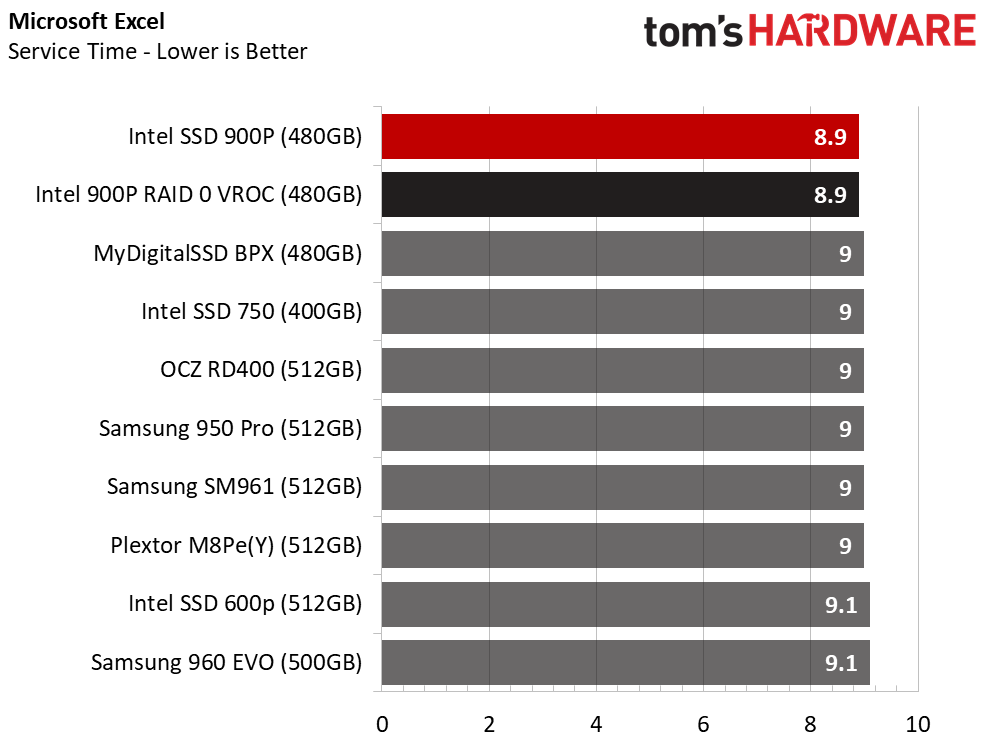
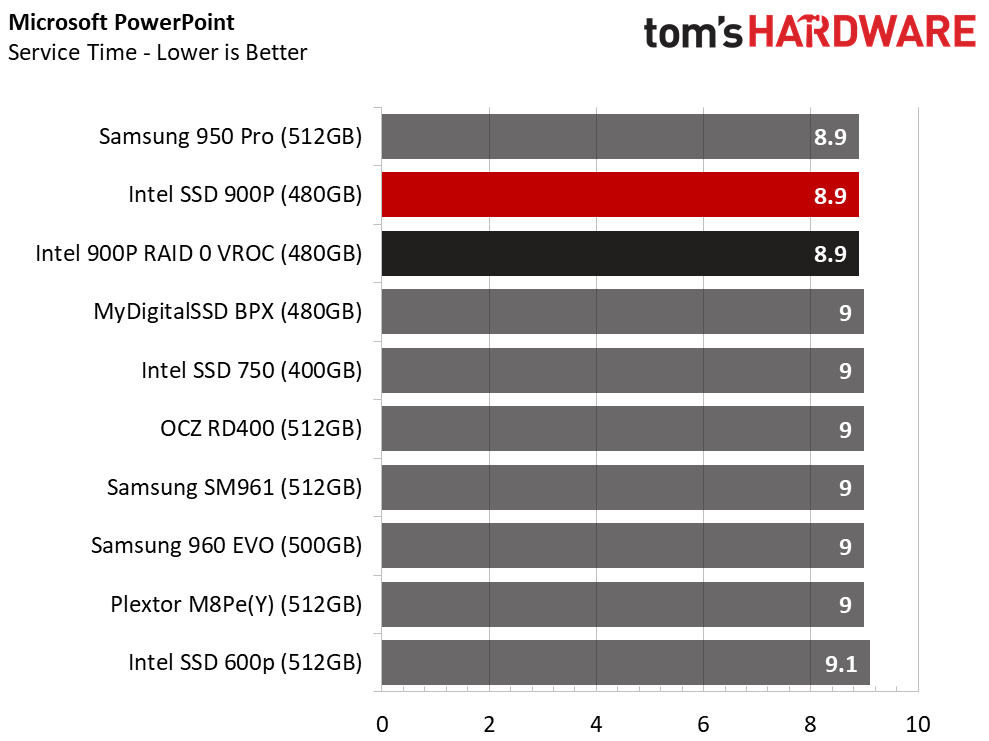
Just like on the previous page, the 900P 480GB wins or ties every application launch test. Also, like the 280GB model, the other drives are not far behind in these low-intensity workloads.
Application Storage Bandwidth
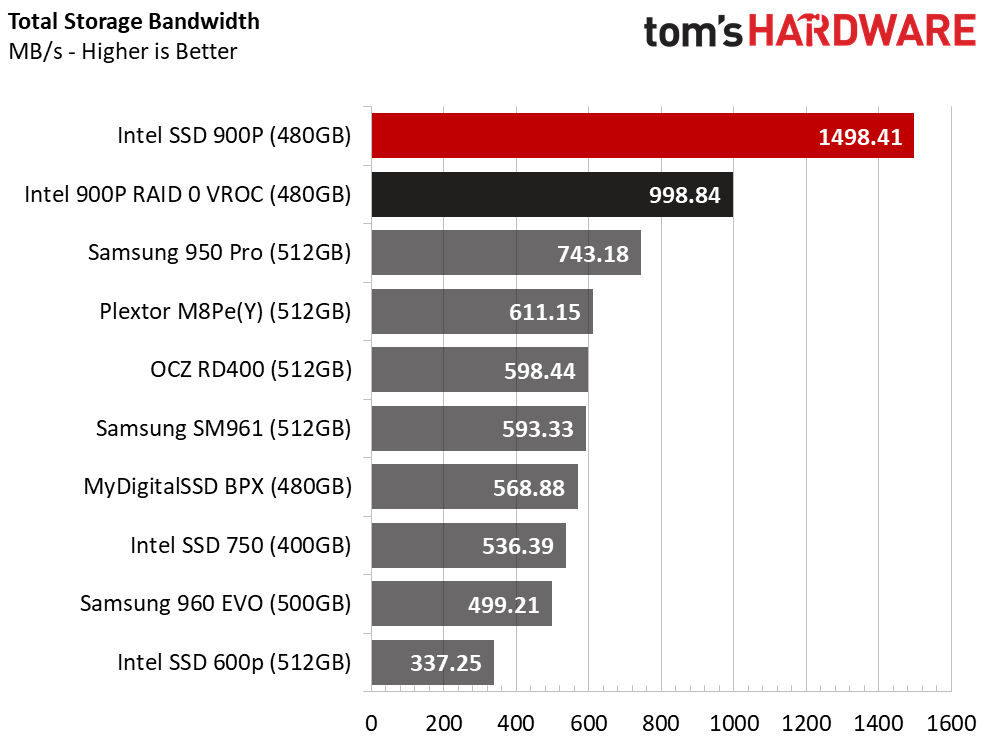
Viewing the PCMark 8 results as average throughput is a good way to gauge the systems' effectiveness. The Optane 900P basically doubles the throughput performance of the 950 Pro 512GB NVMe SSD, but that doesn't equate to twice the application loading speed. This test highlights how the operating system and today's applications can't take full advantage of next-gen memories. That ultimately restricts performance gains with Optane.
PCMark 8 Advanced Workload Performance
To learn how we test advanced workload performance, please click here.
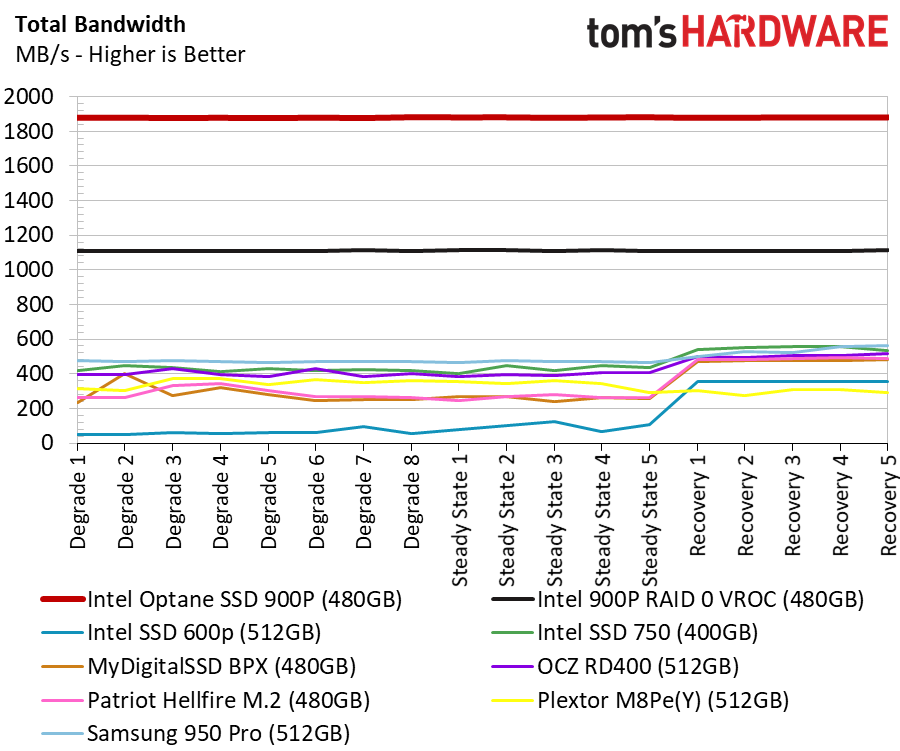
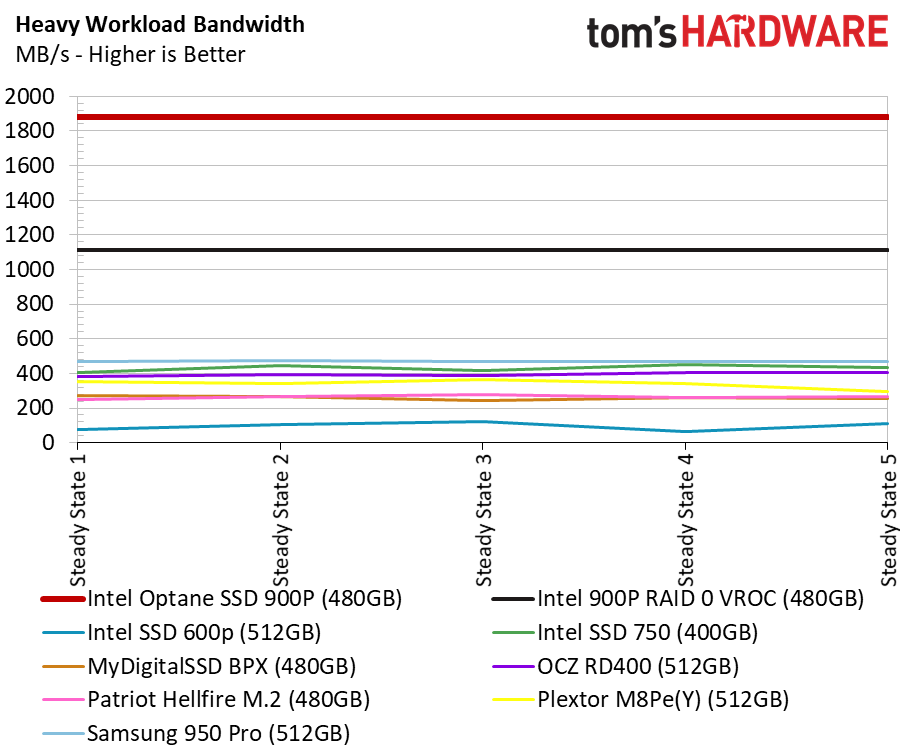
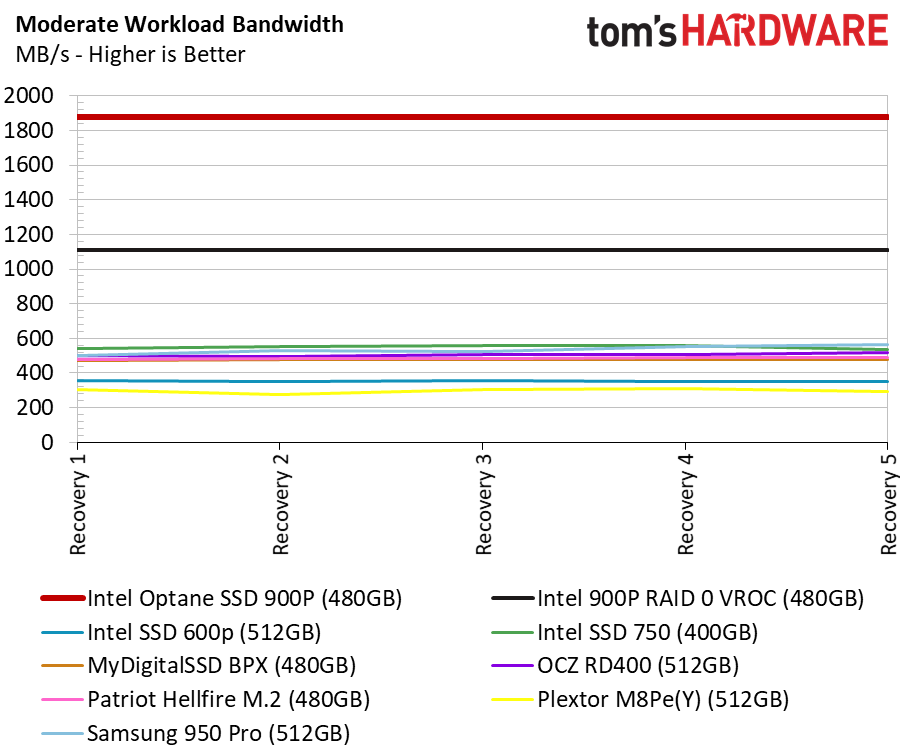
Filling the drives with data and then running extended write workloads pushes them into a worst-case steady state, thus bringing NAND-based SSDs to their knees. Optane SSDs don't have an issue with the amount of data on the drive or workload duration.
VROC's performance is disappointing. At the very least we expected to see parity between a single Optane 900P SSD and the VROC array, but the single drive delivers much more performance in desktop applications than the array. We've yet to see true hardware RAID for NVMe, such as with a standard RAID adapter. Most NVMe RAID implementations are "soft RAID," meaning they are implemented in software in the operating system rather than through dedicated hardware components.
In contrast, VROC offloads RAID calculations directly to the processor, so it does consume CPU cycles. That means the feature competes for processor cycles with your applications. There currently aren't any hardware NVMe RAID controllers, which offload computation overhead entirely, though some have been announced. We can't help but wonder how they will compare.
Total Service Time
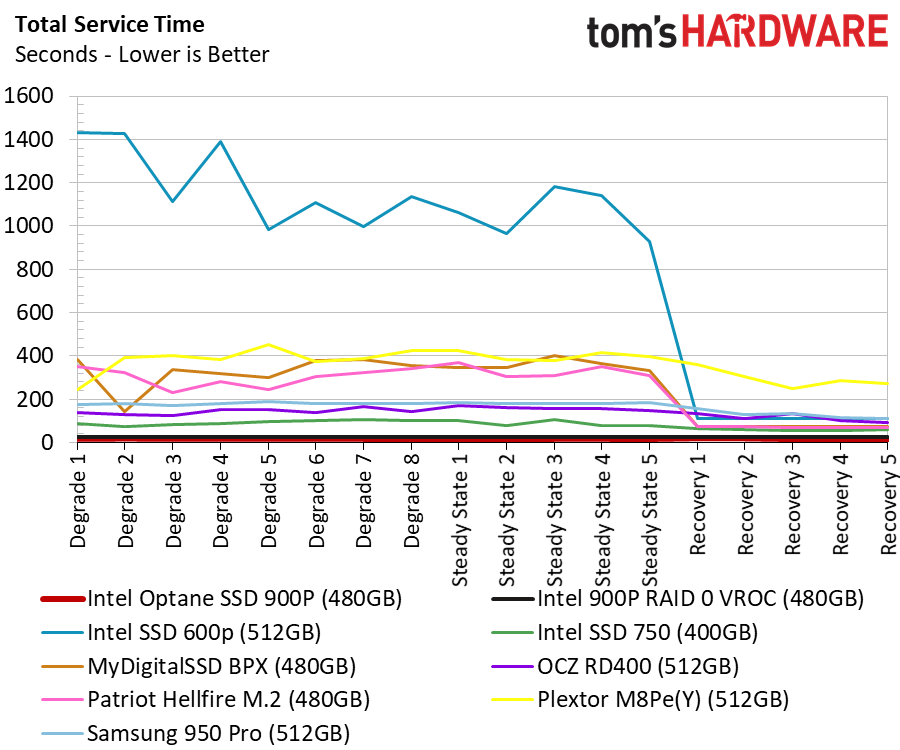
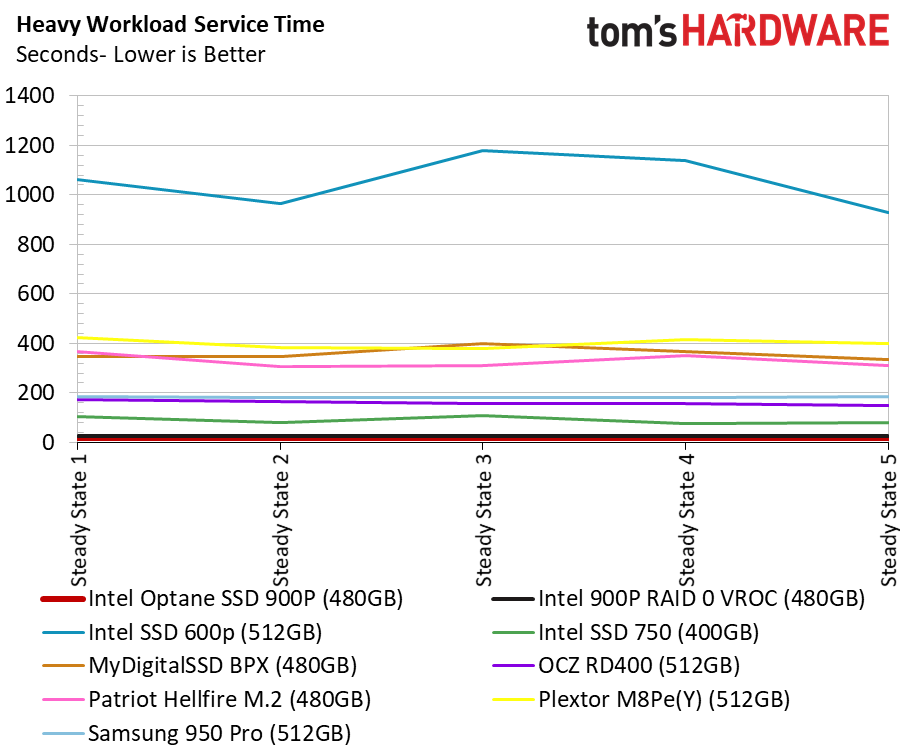
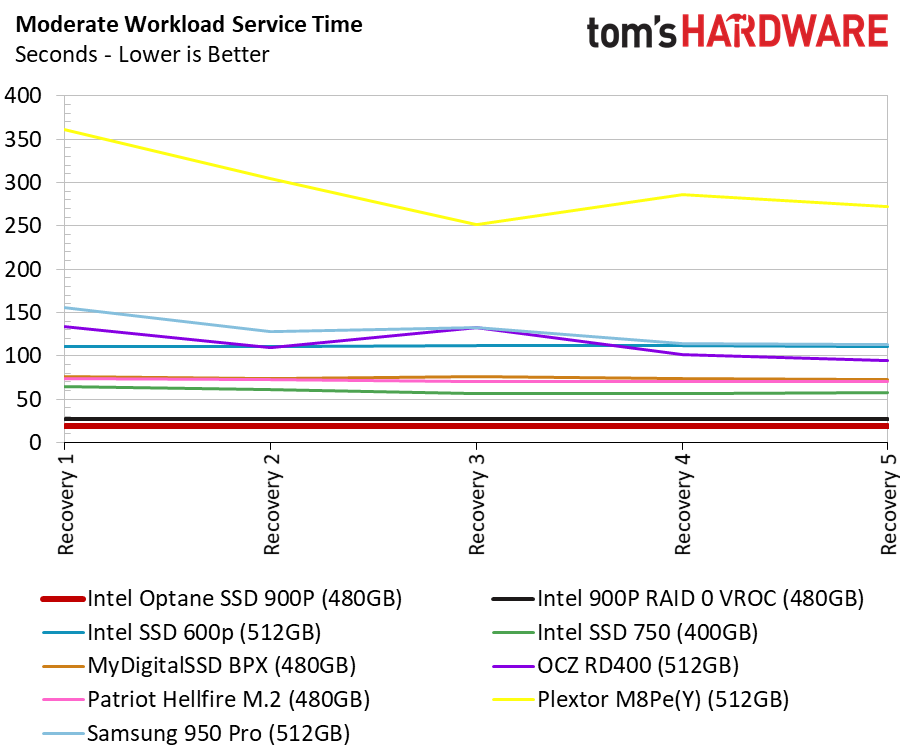
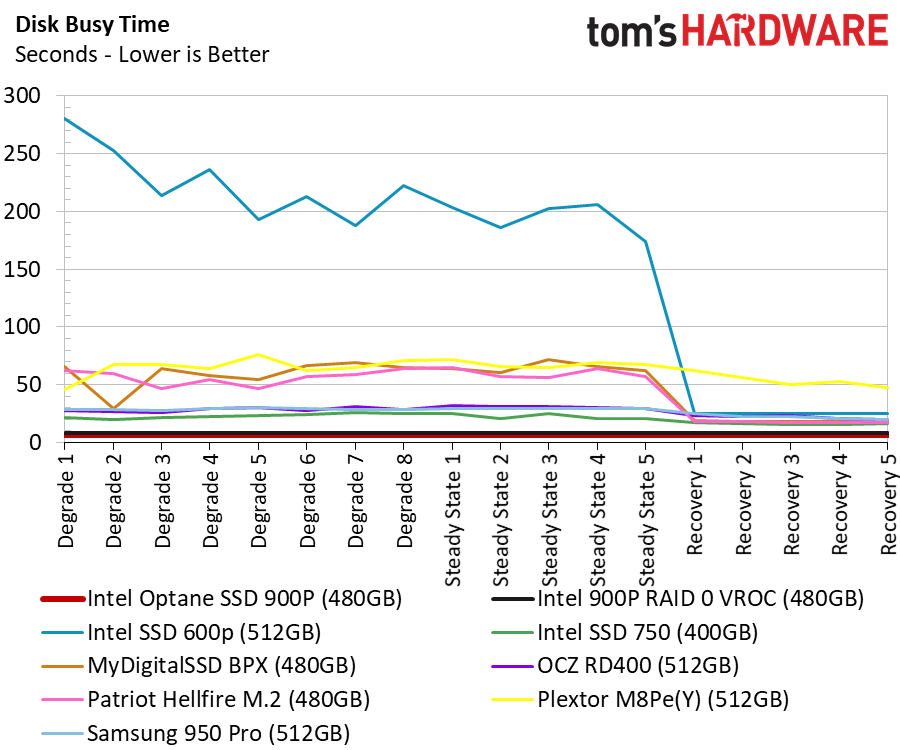
You need to look close to find the two Optane 900P 480GB drives because the service time for the workloads is so low. The drives are barely working during desktop workloads.
Disk Busy Time
The disk busy time test measures how long the drives work to complete tasks. This is in contrast to the previous set of charts that shows how long it took to complete the tasks. The performance advantage is lost in the operating system, application, and file system.
MORE: Best SSDs
MORE: How We Test HDDs And SSDs
MORE: All SSD Content
Current page: 512GB And VROC RAID Performance Testing
Prev Page 256 Optane Performance Testing Next Page Conclusion
Chris Ramseyer was a senior contributing editor for Tom's Hardware. He tested and reviewed consumer storage.
-
Aspiring techie If Intel would have properly implemented NVMe raid, imagine what would happen if you put 8 of these in RAID 0.Reply -
hdmark Can someone comment on the statement "your shiny new operating system was designed to run on an old hard disk drive. "? I somewhat understand it, but what does that mean in this case? If microsoft wanted... could they rewrite windows to perform better on an SSD or optane? Obviously they wont until there are literally no HDD's on the market anymore due to compatibility issues but I just wasnt sure what changes could be made to improve performance for these faster drives.Reply -
AgentLozen Thanks for the review. I have a couple questions if you don't mind answering them.Reply
1. Is PCI-e 3.0 a bottleneck for Optane drives (or even flash in general). If solid state drive developers built PCI-e 4.0 drives today, would they scale to 2x the performance of modern 3.0 drives assuming there were compatible motherboards?
2. Can someone explain what queue depth is and under what circumstances it's most important? The benchmarks show WILD differences in performance at various queue depths. Does it matter that flash based drives catch up at greater queue depths? Is QD1 the most important measurement to desktop users?
3. In the service time benchmarks, it seems like there is no difference between drives in World of Warcraft, Battlefield 3, Adobe Photoshop, Indesign, After Effects. Sequential and Random Read and Write conclude "Optane is WAAAAY better" but the application service time concludes "there's no difference". Is it even worth investing in an Intel Optane drive if you won't see a difference in real world performance? -
AndrewJacksonZA This...Reply
I mean...
This is just...
.
.
.
I want one. I want ten!!!
Also, "Where Is VROC?" listed as a con? Hehe, I like how you're thinking. :-) -
dudmont Reply20314320 said:Can someone comment on the statement "your shiny new operating system was designed to run on an old hard disk drive. "? I somewhat understand it, but what does that mean in this case? If microsoft wanted... could they rewrite windows to perform better on an SSD or optane? Obviously they wont until there are literally no HDD's on the market anymore due to compatibility issues but I just wasnt sure what changes could be made to improve performance for these faster drives.
Simplest way to answer is the term, "lowest common denominator". They(MS) designed 10 to be as smooth and fast as a standard old platter HD could run it, not a RAID array(which a SSD is basically a NAND raid array), or even better an XPoint raid array. Short queue depths(think of data movement as people standing in line) were what Windows is designed for, cause platter drives can't do more data movements than the number of heads on all the platters combined without the queue(people in line) growing, and thus slowing things down. In short, old platter drives can slowly handle like 8-20 lines of people, before they start to clog up, while nand, can quickly handle many lines of people(how many lines depends on the controller and the number of nand packages). Admittedly, it may not be the best answer, but it's how I visualize it in my head. -
hdmark Reply20314454 said:20314320 said:Can someone comment on the statement "your shiny new operating system was designed to run on an old hard disk drive. "? I somewhat understand it, but what does that mean in this case? If microsoft wanted... could they rewrite windows to perform better on an SSD or optane? Obviously they wont until there are literally no HDD's on the market anymore due to compatibility issues but I just wasnt sure what changes could be made to improve performance for these faster drives.
Simplest way to answer is the term, "lowest common denominator". They(MS) designed 10 to be as smooth and fast as a standard old platter HD could run it, not a RAID array(which a SSD is basically a NAND raid array), or even better an XPoint raid array. Short queue depths(think of data movement as people standing in line) were what Windows is designed for, cause platter drives can't do more data movements than the number of heads on all the platters combined without the queue(people in line) growing, and thus slowing things down. In short, old platter drives can slowly handle like 8-20 lines of people, before they start to clog up, while nand, can quickly handle many lines of people(how many lines depends on the controller and the number of nand packages). Admittedly, it may not be the best answer, but it's how I visualize it in my head.
That helps a lot actually! thank you!
-
WyomingKnott Queue depth can be simplified to how many operations can be started but not completed at the same time. It tends to stay low for consumer applications, and get higher if you are running many virtualized servers or heavy database access.Reply
With spinning metal disks, the main advantage was that the drive could re-order the queued requests to reduce total seek and latency at higher queue depths. With NMMe the possible queue size increased many-fold (weasel words for I don't know how much), and I have no idea why they provide a benefit for actually random-access memory. -
TMTOWTSAC Reply20314320 said:Can someone comment on the statement "your shiny new operating system was designed to run on an old hard disk drive. "? I somewhat understand it, but what does that mean in this case? If microsoft wanted... could they rewrite windows to perform better on an SSD or optane? Obviously they wont until there are literally no HDD's on the market anymore due to compatibility issues but I just wasnt sure what changes could be made to improve performance for these faster drives.
Off the top of my head, the entire caching structure and methodology. Right now, the number one job of any cache is to avoid accessing the hard drive during computation. As soon as that happens, your billions of cycles per second CPU is stuck waiting behind your hundredths of a second hard drive access and multiple second transfer speed. This penalty is tens of orders of magnitude greater than anything else, branch misprediction, in-order stalls, etc. So anytime you have a choice between coding your cache for greater speed (like filling it completely to speed up just one program) vs avoiding a cache miss (reserving space for other programs that might be accessed), you have to weigh it against that enormous penalty. -
samer.forums where is the power usage test ? I can see a HUGE heatsink on that monster , and I want the Wattage of this card compared to other PLEASE.Reply
This SSD cant be made M2 card . so Samsung 960 pro has a huge advantage over it. -
dbrees A lot of the charts that show these massive performance gains are captioned that this is theoretical bandwidth which is not seen in actual usage due to the limitations of the OS. I get it, it's very cool, but if the OS is the bottleneck, no one in the consumer space would see a benefit, especially since NVMe RAID is still not fully developed. If I am wrong, please correct me.Reply

