Why you can trust Tom's Hardware
Power Consumption
We used GPUz’s logging to measure the card’s power consumption with the Metro: Exodus benchmark running at 2560 x 1440 using the default Ultra settings. The card is warmed up prior to testing and benchmarking is started when it settles to a normalized idle temperature (after about 10 minutes). The benchmark is looped a total of five times, which yields around 10 minutes of testing. In the charts you will see a few blips in power use; this is a result of the benchmark starting the next loop.
We also use Furmark to capture worst-case power readings. Although both Nvidia and AMD consider the application to be a “power virus,” or a program that deliberately taxes the components beyond normal limits, the data we gather from it tells us about a card’s capabilities.
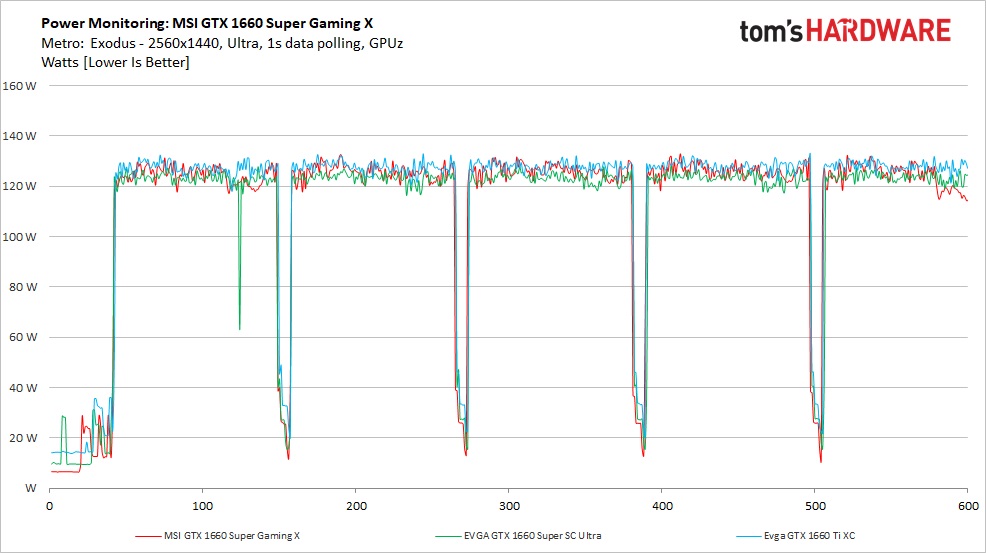
Our power consumption values during a gaming scenario were similar, around 125W, for all GTX 1660 cards in the chart (two 1660 Supers and one 1660 Ti). The MSI card averaged 125W, 5W over the reference TDP, while the EVGA card was just under that at 123W. The EVGA GTX 1660 Ti XC was a bit higher, averaging nearly 128W. In this case, the MSI card is a bit more efficient than the EVGA, but you will not notice such small differences running even several hours per day. Nvidia has found a nice sweet spot for performance and efficiency on this mature 12nm process in the 1660 variants.
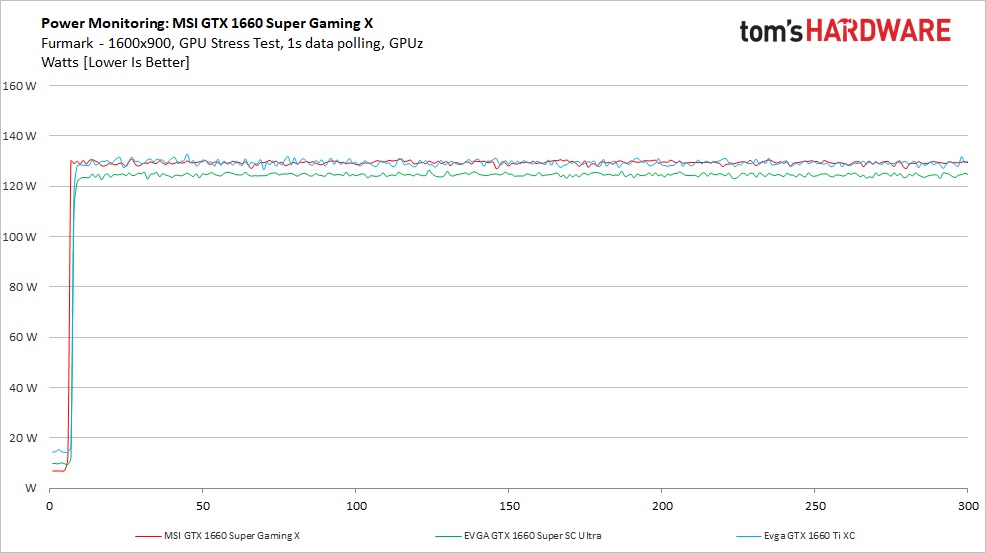
Moving on to Furmark, what we found here, are the cards power limits. Each card held steady throughout the test while they all worked diligently to maintain themselves under the maximum board power. For the MSI this was 130W, same as the GTX 1660 Ti. The GTX 1660 Super was a bit less at 125W. You’ll see how this affected clock speeds below.
Temperatures, Fan Speeds and Clock Rates
Gaming
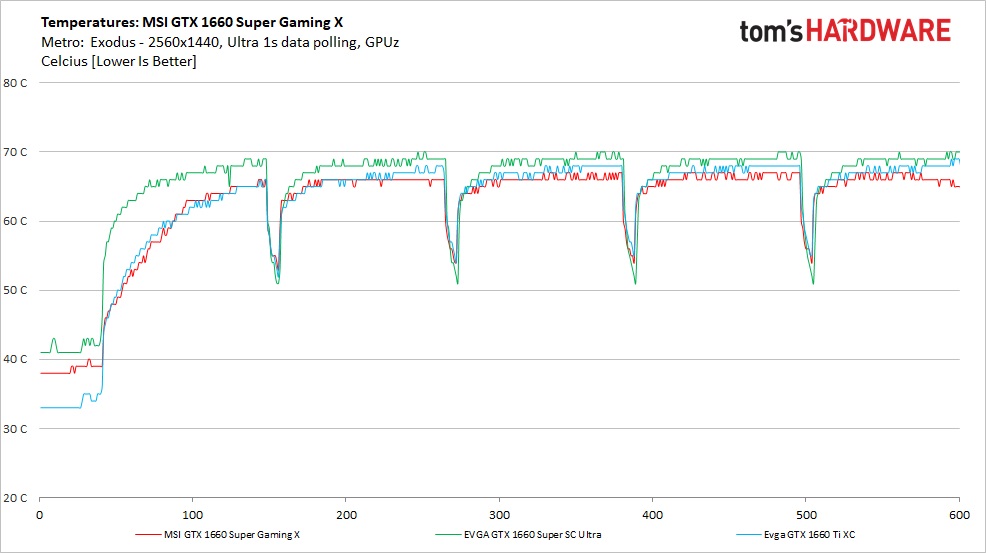
MSI’s Twin Frozr 7 cooler managed to keep the card at a cool 67C or less. Compare this to EVGA’s result, a couple of degrees Celsius higher at 70C, and we find that the MSI solution is a bit more effective. That said, both values are well within an acceptable range.
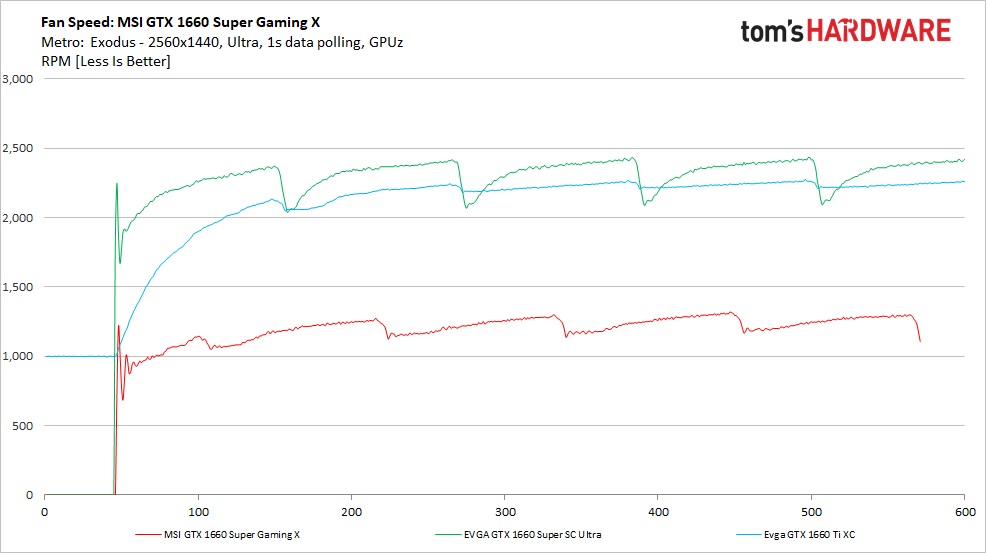
In order to keep the temperatures where they are, the GTX 1660 Super Gaming X's fans settled at 1,200 RPM for an average, which was whisper quiet on the large 90mm fans. EVGA’s cooling solution spun a lot faster at almost 2,300 RPM. And though it was louder than Twin Frozr, it was not intrusive over the other system fans.
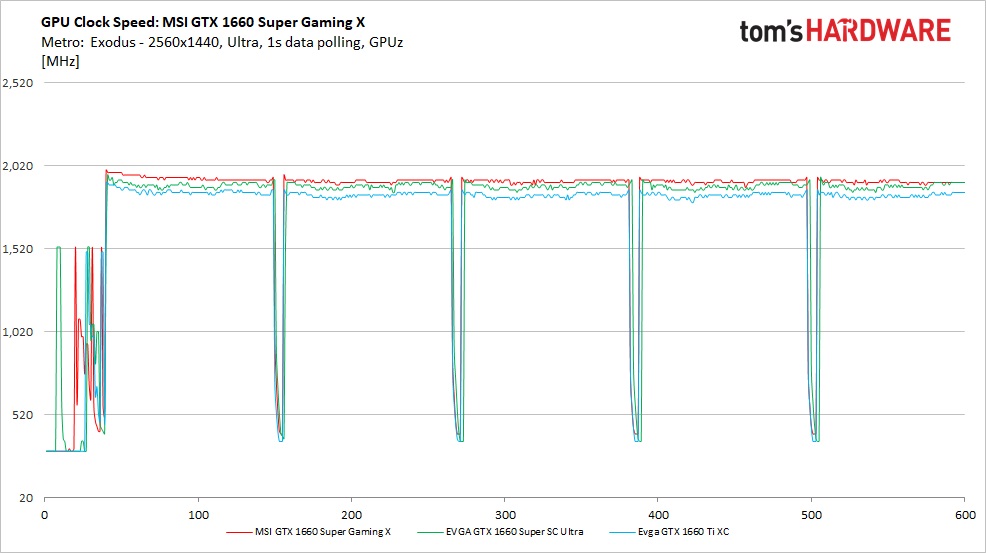
In order to determine the average clock speed during the game testing, we averaged the clocks speeds during the 5th loop of the Metro: Exodus test. This way, the card is warmed up and clocks settle a bit (clocks in the first loop average around 30 MHz higher).
Get Tom's Hardware's best news and in-depth reviews, straight to your inbox.
In this case, the MSI averaged 1,929 MHz, well over the listed boost clock of 1,830 MHz. The EVGA 1660 Super XC came in at 1,899 MHz, around 30 MHz less than the MSI. The slightly higher clock speed is the reason for the just slightly better performance of the MSI.
Furmark
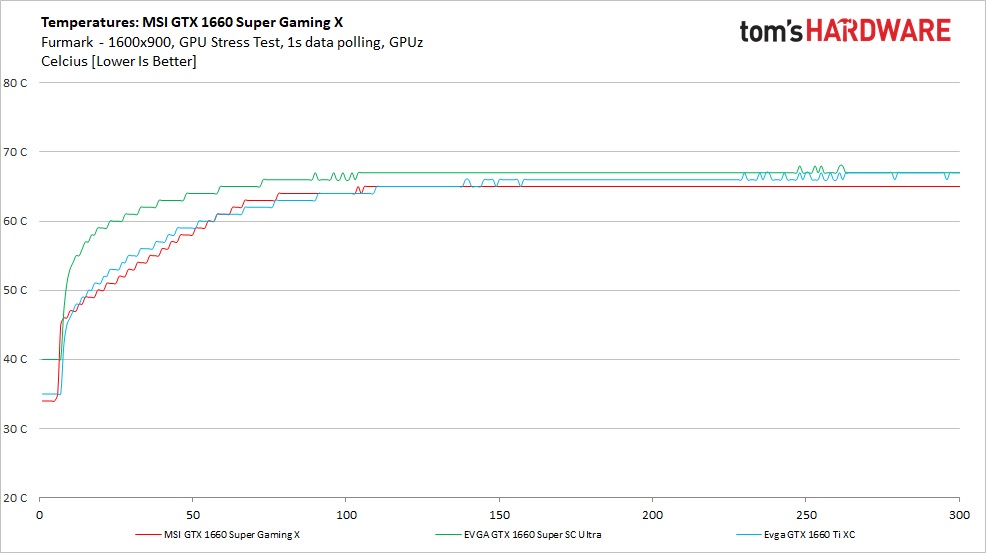
Switching up to our GPU killer Furmark, temperatures here were similar with the MSI peaking at 65C -- two degrees Celsius less. The reason why we see lower temperatures is due to the card significantly reducing clock speeds and voltage in order to fit within the power budget. The EVGA card behaved in the same manner, peaking at 68C.
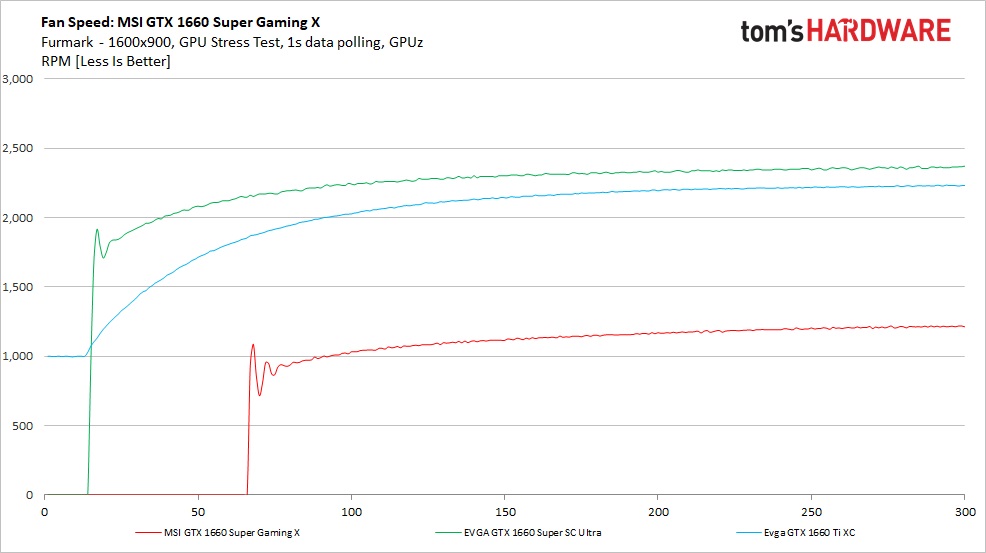
Fan speeds when running Furmark ramped up steadily and ended running a little slower averaging 1,000 RPM across the entirety of the test. The EVGA card settled in a little slower as well at 2,250 RPM. During both tests, both cards were quiet, though I could hear the EVGA more clearly over the MSI.
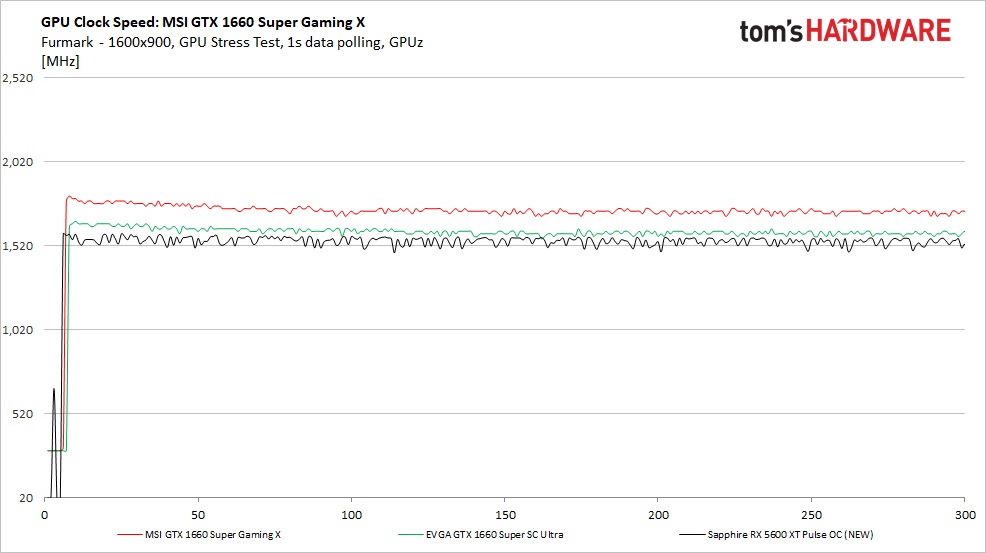
About those clock speeds we mentioned earlier: Here the MSI was running at 1,731 MHz or around 200 MHz slower. Voltage was lowered to around 0.85V compared to 1.03V with higher clocks and gaming. The comparison EVGA ran at 1,603 MHz versus 1,899 MHz -- an almost 300 MHz difference with similar voltage drops. Furmark isn’t a very realistic scenario, but it shows how the card can react to non-gaming loads maxed out.
MORE: Best Graphics Cards
MORE: Desktop GPU Performance Hierarchy Table
MORE: All Graphics Content
Current page: Power Consumption, Fan Speeds, Clock Rates and Temperature
Prev Page Performance Results: 2560 x 1440 (Medium) Next Page Software: MSI Afterburner
Joe Shields is a staff writer at Tom’s Hardware. He reviews motherboards and PC components.