GeChic On-Lap 2501M 15.6" Battery-Powered Monitor, Tested
Do you ever wish you could watch video on something larger than a smartphone when you're on the road? GeChic thinks it has an answer with the On-Lap 2501M portable monitor. We benchmark the display to see if its performance matches its convenience.
Results: Gamma And ANSI Contrast Ratio
Gamma
Gamma is the measurement of luminance levels at every step in the brightness range from 0 to 100 percent. This is important because a poor gamma can either crush detail at various points, or wash it out, making the entire picture appear flat and dull. Correct gamma produces a more three-dimensional image, with greater depth and pop. Meanwhile, incorrect gamma can negatively affect image quality even in monitors with high contrast ratios.
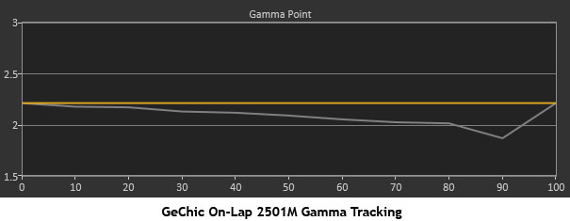
We’re now including the gamma tracking charts for all the monitors we test. The yellow line represents 2.2. The closer the white measurement trace comes to 2.2, the better.
The On-Lap does fairly well in this test. The values drop slightly as the signal level approaches 90 percent. A lower gamma value means the image is too bright at that luminance point. The measurement at 90 percent is around 1.8, which equates to four percent too high.
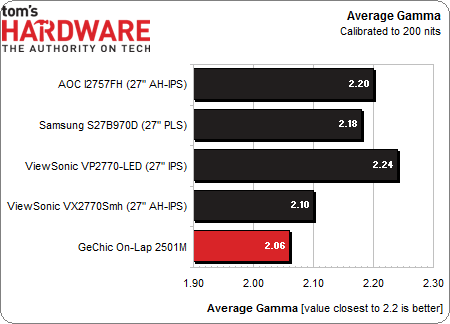
Turning to the comparison charts, the On-Lap performs adequately versus its competition. We don’t have gamma data for any of the TN-based panels from past reviews, so we only included the IPS monitors in these charts.
Bear in mind that the four IPS panels in this comparison boast superb gamma performance, and the On-Lap is only slightly behind the group.
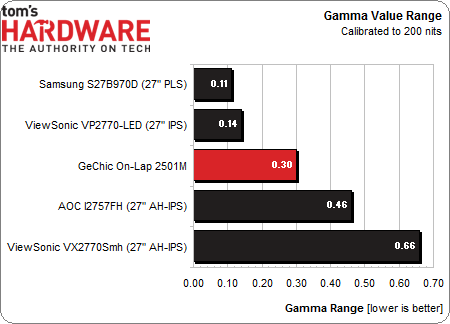
The gamma value range tells us how close each signal level from zero to 100 percent comes to the 2.2 standard.
Get Tom's Hardware's best news and in-depth reviews, straight to your inbox.
This is a very good result. The lower numbers indicate flatter gamma tracking. This means the display will closely match the mastering specification of the original content, so you’ll see maximum detail no matter what the brightness level is set to.
ANSI Contrast Ratio
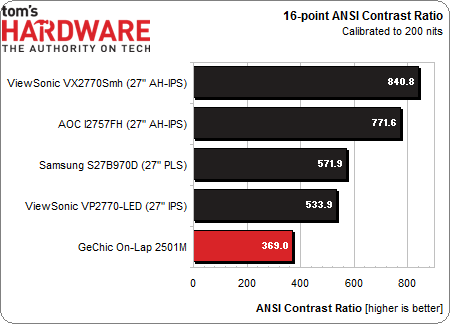
Another important measure of contrast is ANSI. This is a relatively new benchmark for our monitor reviews. To perform this test, a checkerboard pattern of sixteen 0 and 100 percent squares are measured. This is somewhat more real-world than on/off measurements because it tests a display’s ability to simultaneously maintain both low black and full white levels. This test also factors in screen uniformity. The average of the eight full-white measurements is divided by the average of the eight full-black measurements to arrive at the ANSI result.
It’s not surprising that the On-Lap doesn’t do particularly well. After all, the on/off contrast is only fair. On the plus side, its ANSI contrast ratio is slightly higher than its on/off ratio, meaning that contrast will be maintained no matter what image is being displayed.
Current page: Results: Gamma And ANSI Contrast Ratio
Prev Page Results: Calibrated Brightness And Contrast Next Page Results: Grayscale Tracking
Christian Eberle is a Contributing Editor for Tom's Hardware US. He's a veteran reviewer of A/V equipment, specializing in monitors. Christian began his obsession with tech when he built his first PC in 1991, a 286 running DOS 3.0 at a blazing 12MHz. In 2006, he undertook training from the Imaging Science Foundation in video calibration and testing and thus started a passion for precise imaging that persists to this day. He is also a professional musician with a degree from the New England Conservatory as a classical bassoonist which he used to good effect as a performer with the West Point Army Band from 1987 to 2013. He enjoys watching movies and listening to high-end audio in his custom-built home theater and can be seen riding trails near his home on a race-ready ICE VTX recumbent trike. Christian enjoys the endless summer in Florida where he lives with his wife and Chihuahua and plays with orchestras around the state.
-
mayankleoboy1 So even though the hardware itself is excellent, the final product is too niche-y to sell ?Reply -
slomo4sho A portable monitor at the conveniently low price of an entry level tablet or chromebook... I see real utility here.Reply -
warezme It is an industry artificial block in my opinion. All they would have to do is include a little extra circuitry to the existing pads for an HDMI input and viola, you could use your pad as a monitor to another device. Most pads have at least that resolution on some even better. I would never buy this item unless it was under $150 or less. It is a one trick pony with a low resolution screen.Reply -
groundhogdaze I'd love to have one of these portable monitors. I've go a bunch of headless PC's that I need to check every once in a while and don't want to lug a regular monitor around nor hunt for a power socket for the test monitor. If only the price were a little lower...Reply -
Fulgurant warezmeIt is an industry artificial block in my opinion. All they would have to do is include a little extra circuitry to the existing pads for an HDMI input and viola, you could use your pad as a monitor to another device. Most pads have at least that resolution on some even better. I would never buy this item unless it was under $150 or less. It is a one trick pony with a low resolution screen.I don't disagree that tablets could easily include an input, but to be fair, this product is far bigger than a tablet. It may only have a niche use, but it is clearly better suited for that niche use than a tablet screen would be.Reply -
Fulgurant FulgurantI don't disagree that tablets could easily include an input, but to be fair, this product is far bigger than a tablet. It may only have a niche use, but it is clearly better suited for that niche use than a tablet screen would be.Come to think of it, laptops should include inputs too -- but to my knowledge, they never have.Reply -
g00fysmiley interesting concept but would be nice if bluetooth connectivity wee there unless i am missing somethign it s hdmi only. touchscereen i know is pricier but again would add to utility. interesting product just as it is looks very limitedReply -
RedJaron Senor Kalyanhttp://us.aoc.com/monitor_displays/e2251fwuNice product, except it doesn't have its own power supply and can only take a USB signal over a DisplayLink driver. Makes for a nice quasi-mobile secondary monitor for computers, but it won't connect to most types of mobile devices like the GeChic will.Reply


