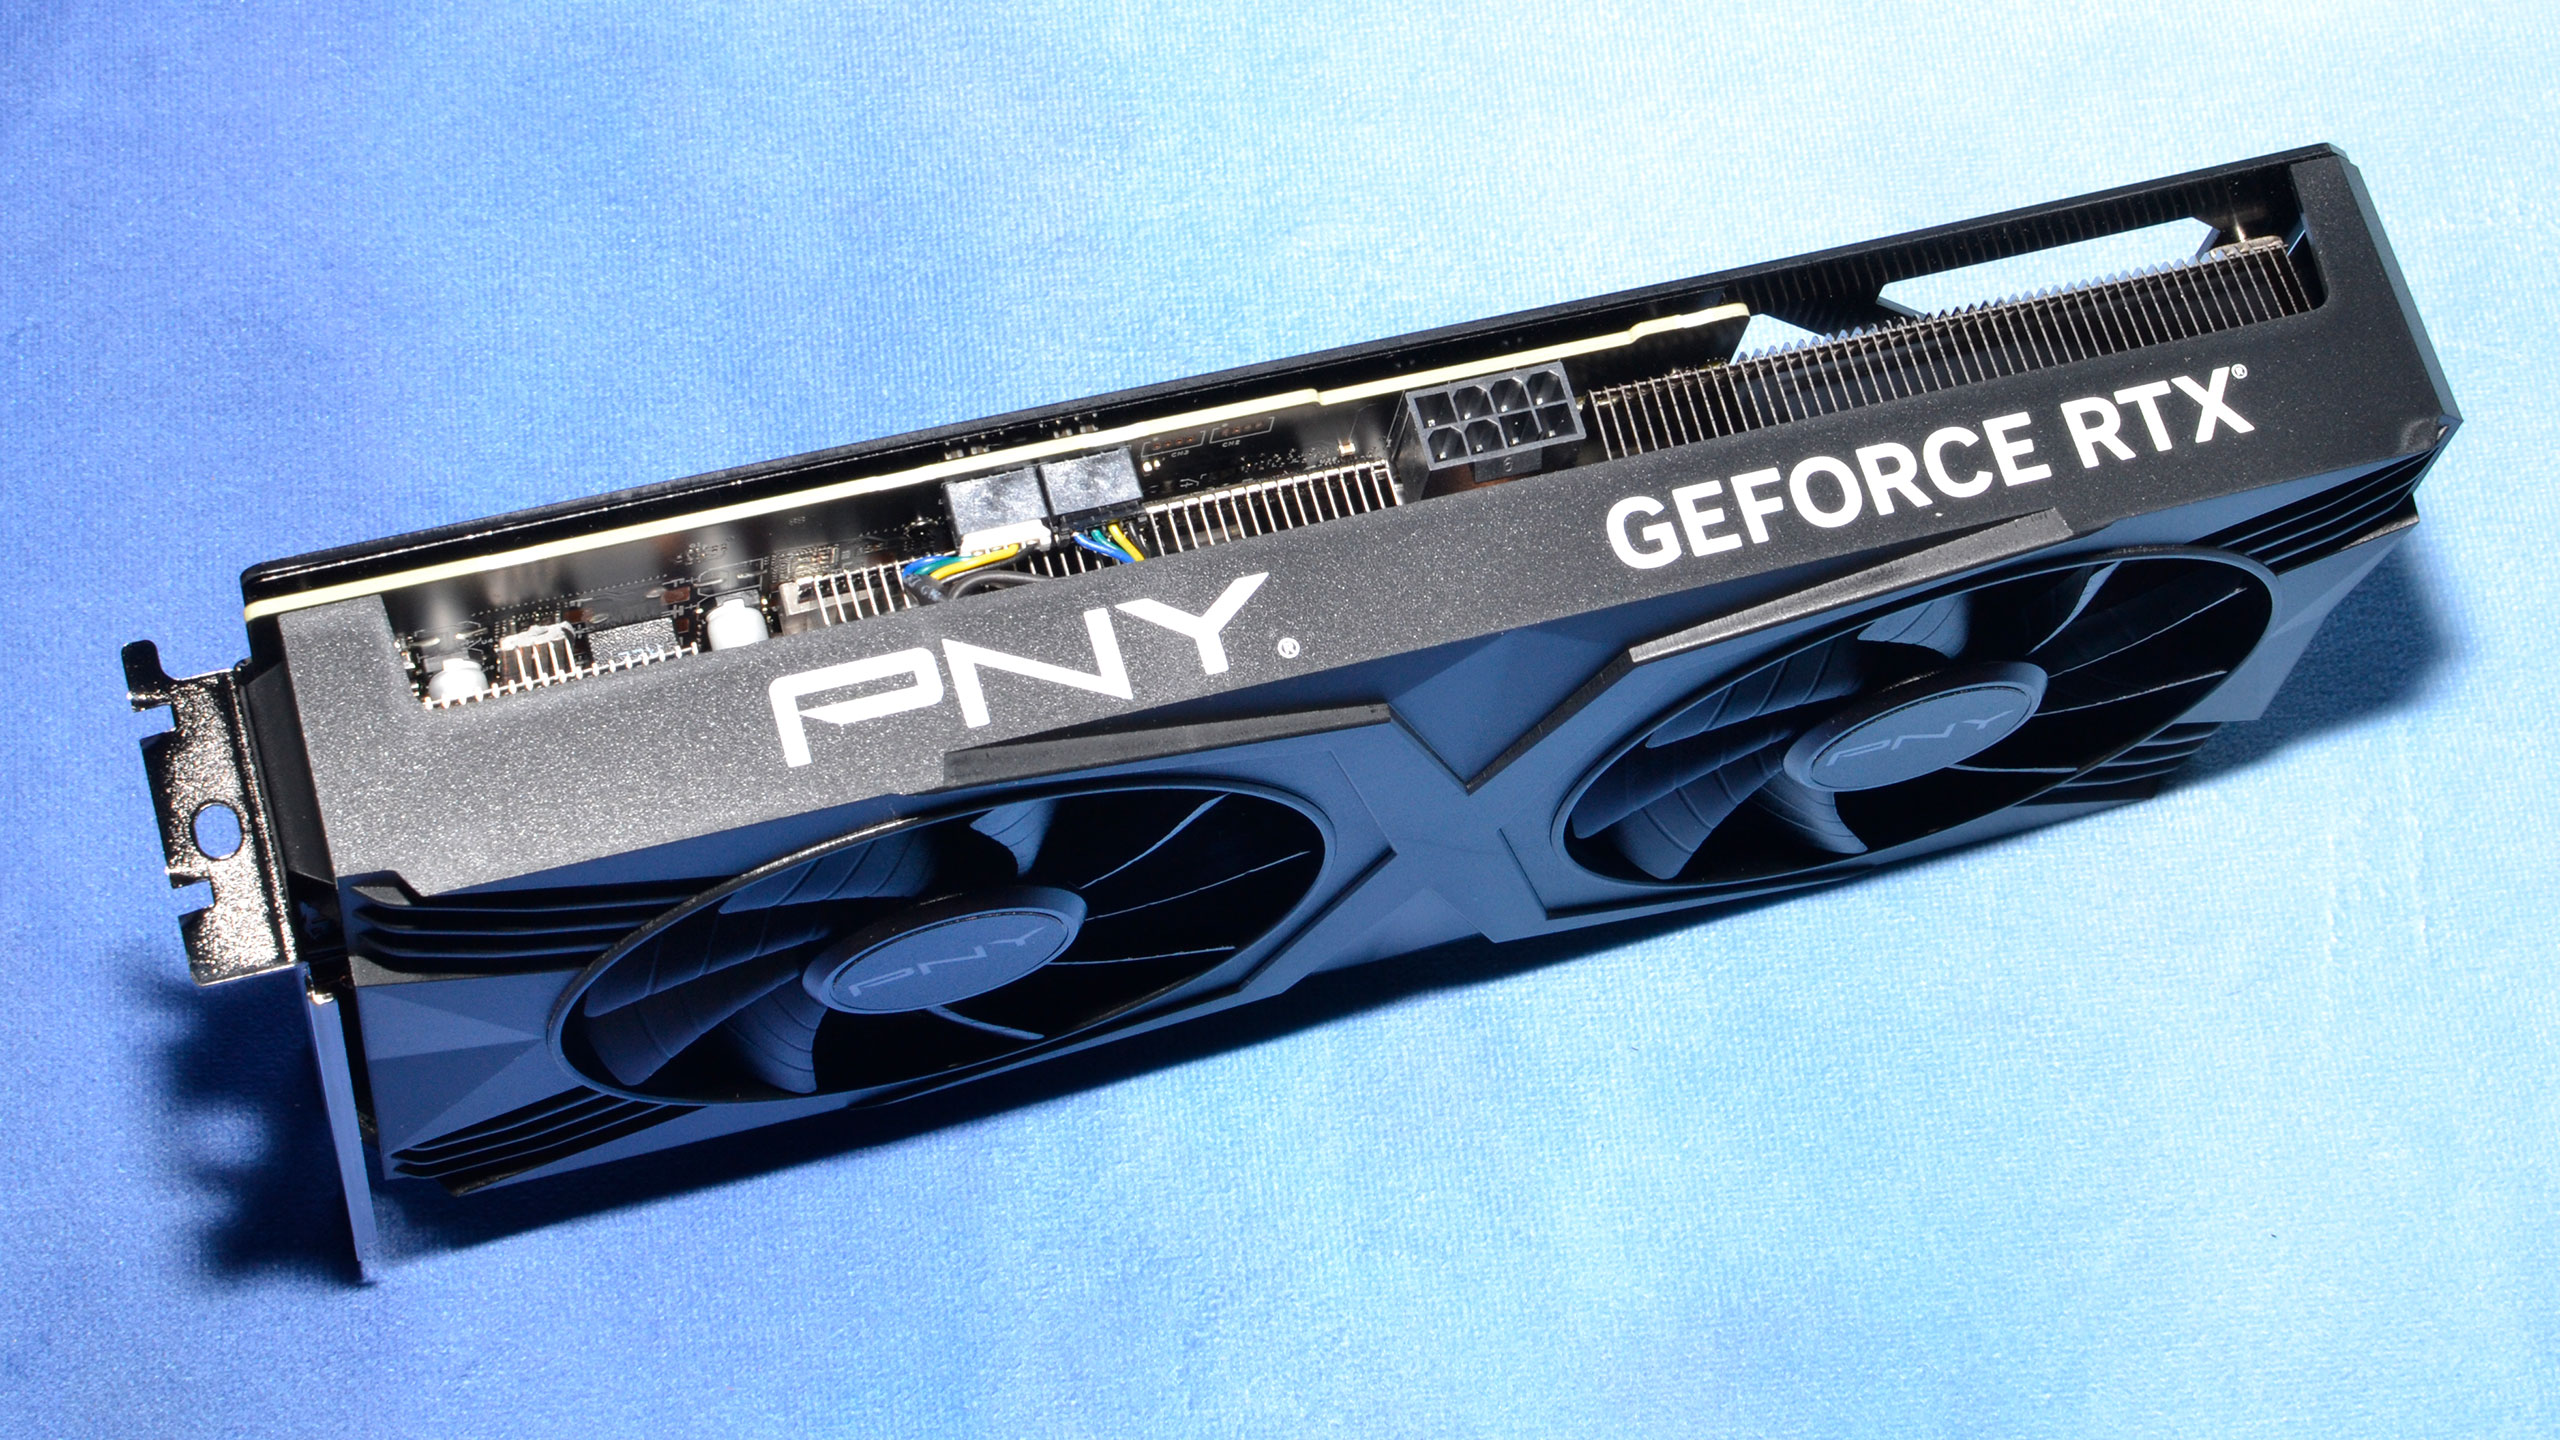
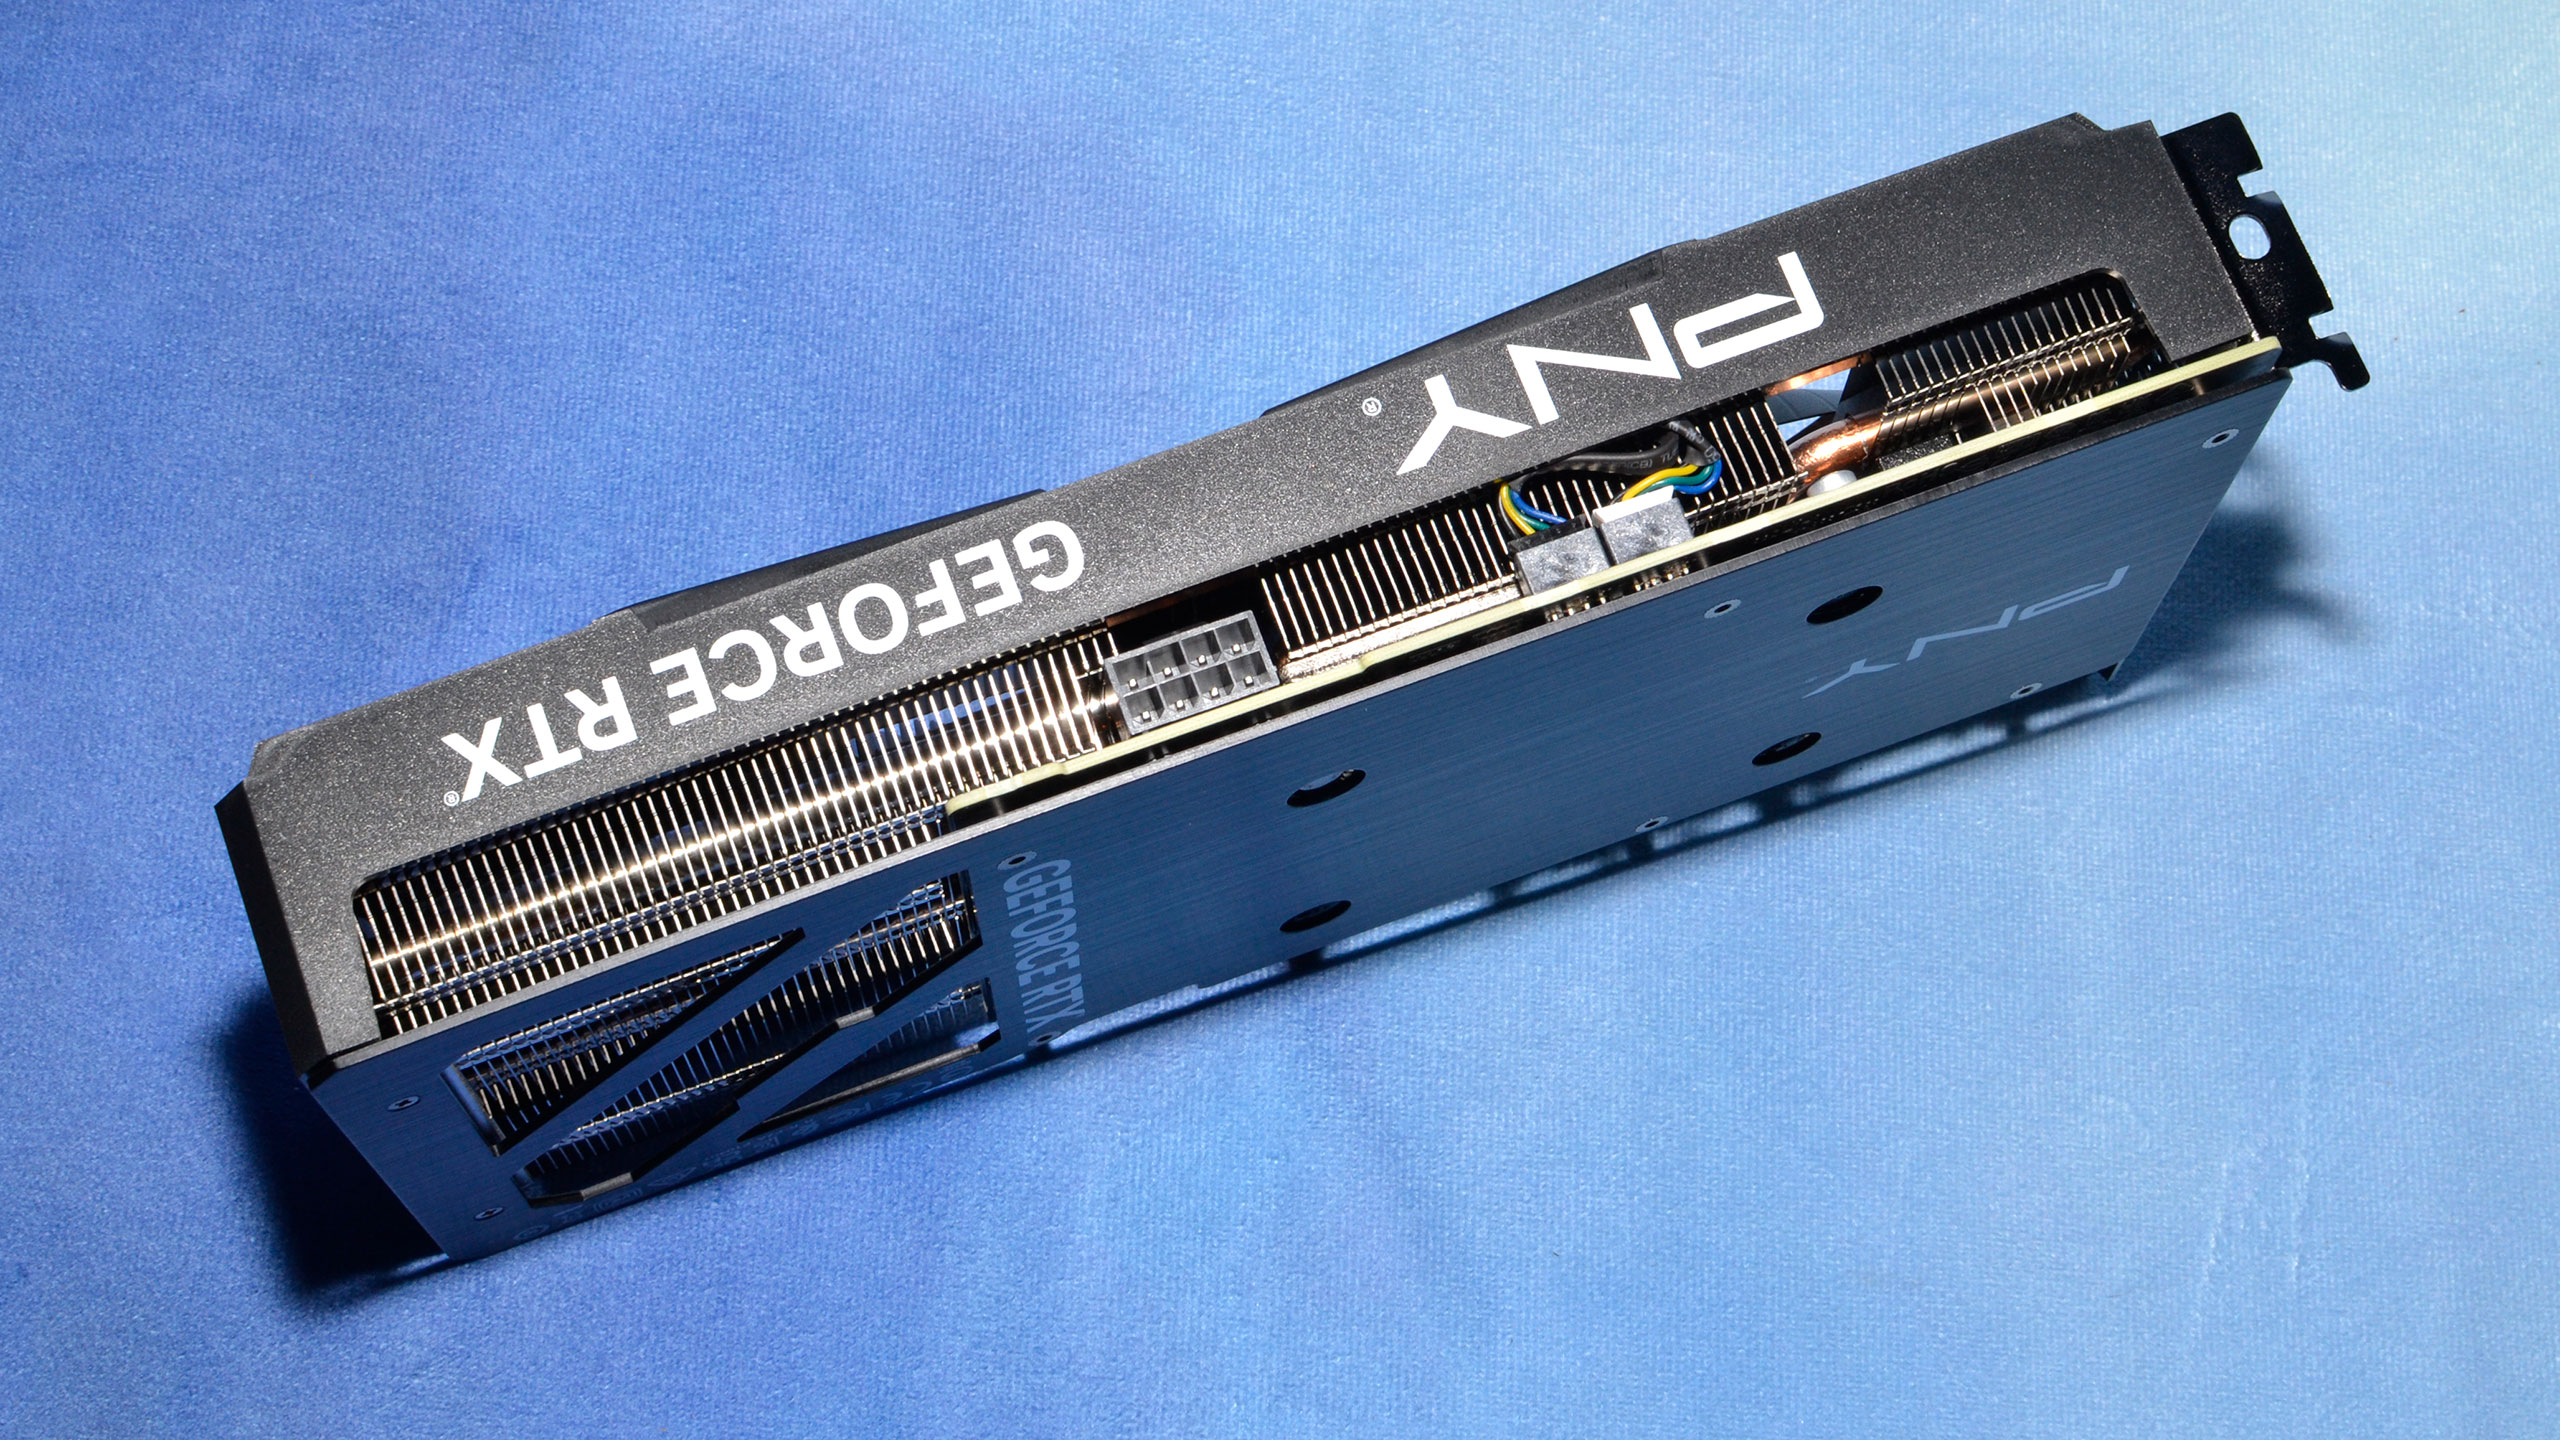
Why you can trust Tom's Hardware
Our power, clocks, and temperature testing now utilizes the same test suite as our gaming benchmarks, as the PCAT v2 hardware and FrameView software lets us collect this data alongside frametimes. We're also using our updated Core i9-13900K platform, so we're less likely to have CPU or platform limitations playing a role.
We have 1080p, 1440p, and 4K charts for power, GPU clocks, and temperatures below. Then we do a test using Metro Exodus Enhanced at whatever "demanding for the GPU being tested" means, and after letting the game run for 15 minutes or more, we check noise levels. We'll present additional tables and information about efficiency (FPS/W) and value (FPS/$) at the bottom of the page.
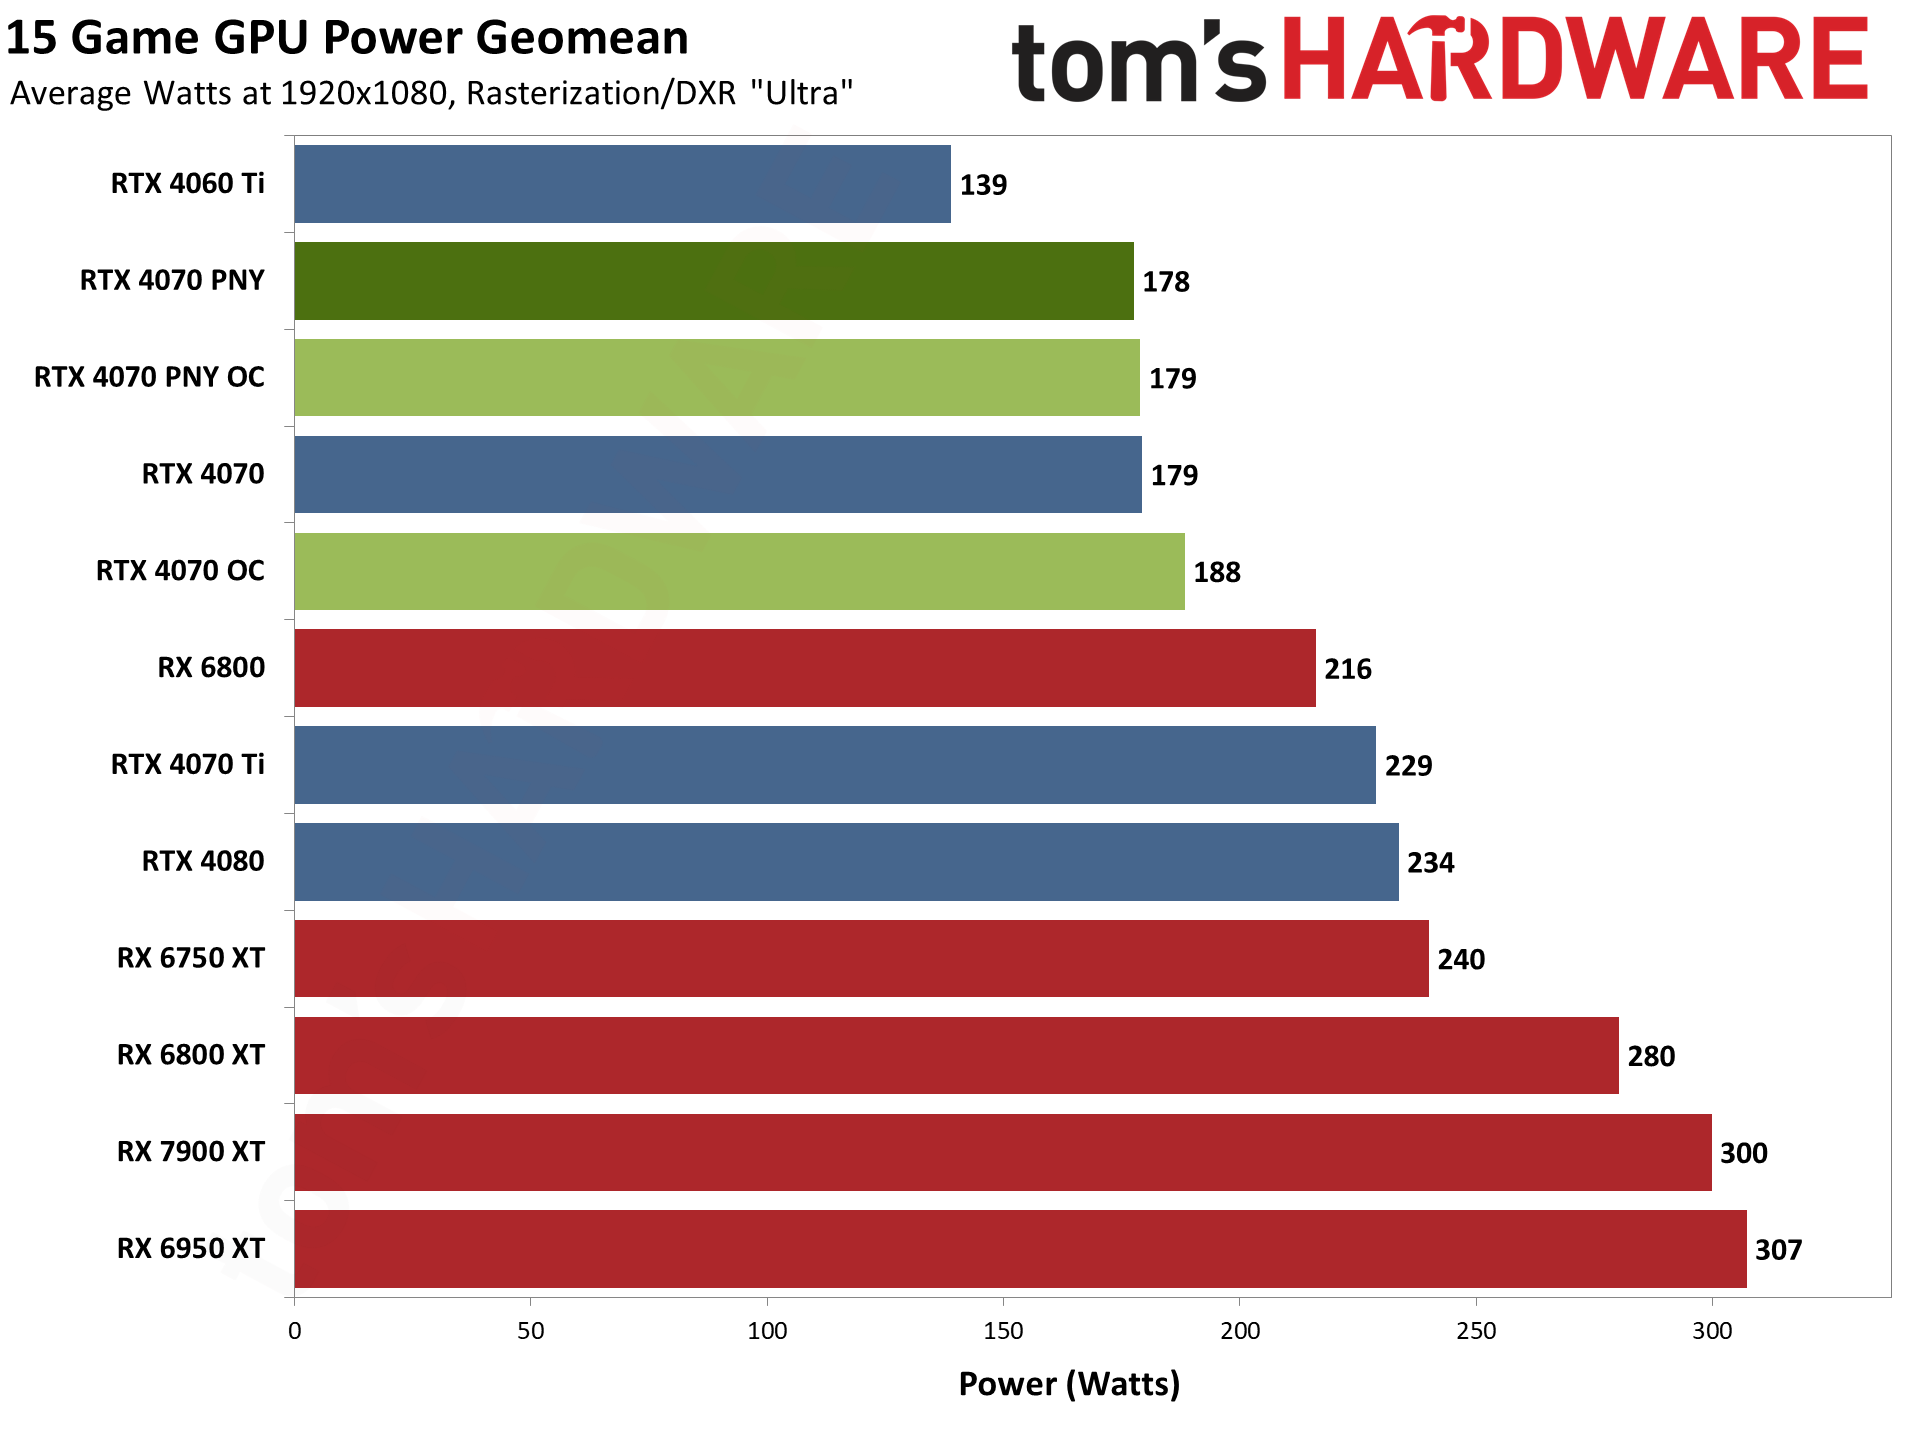
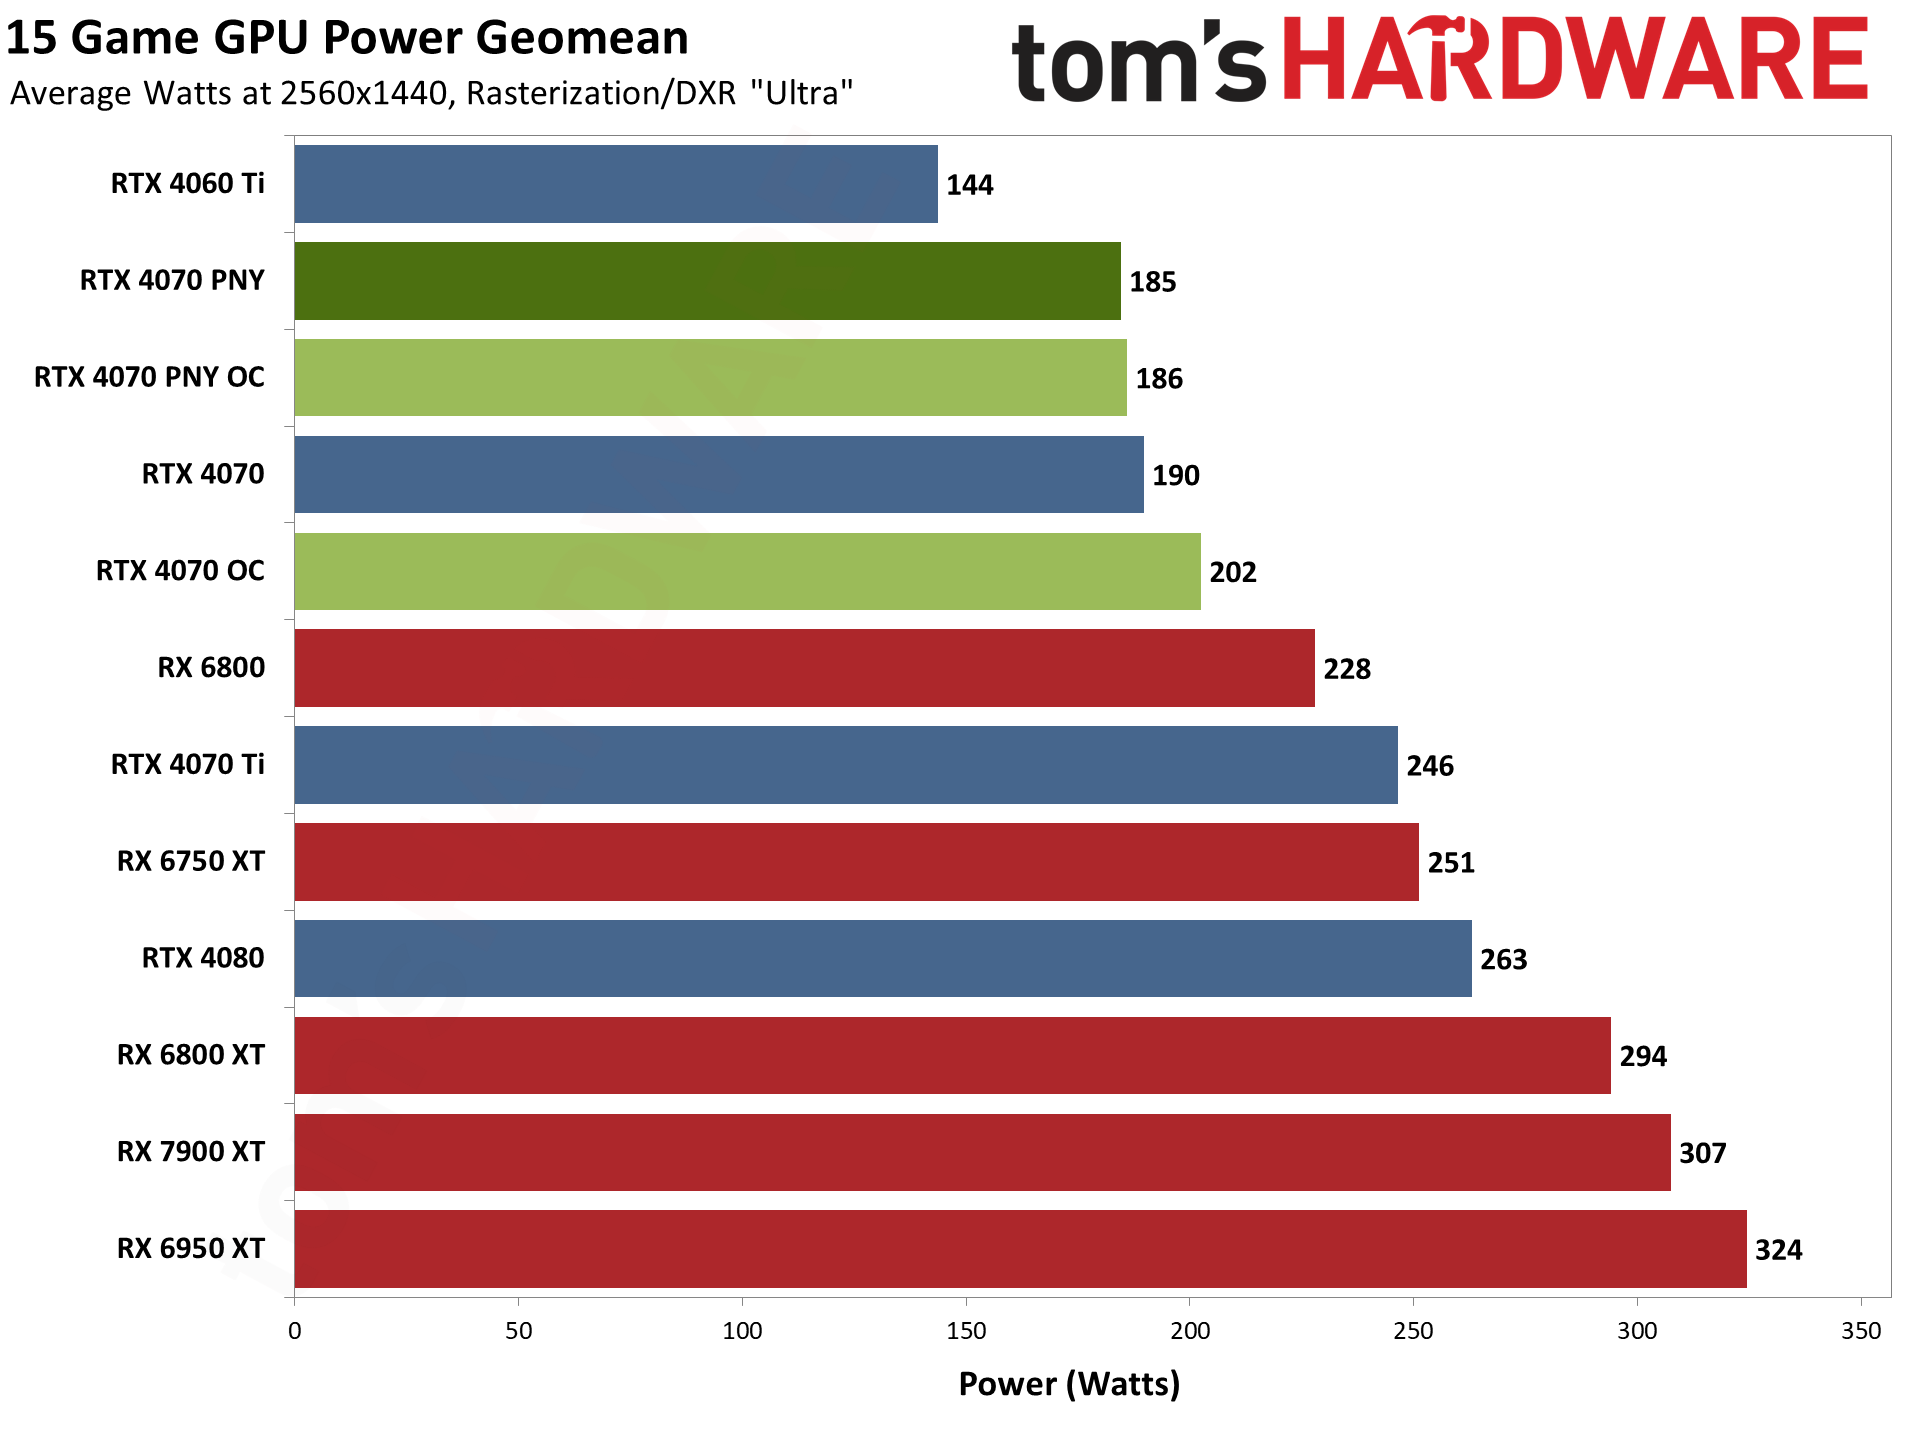
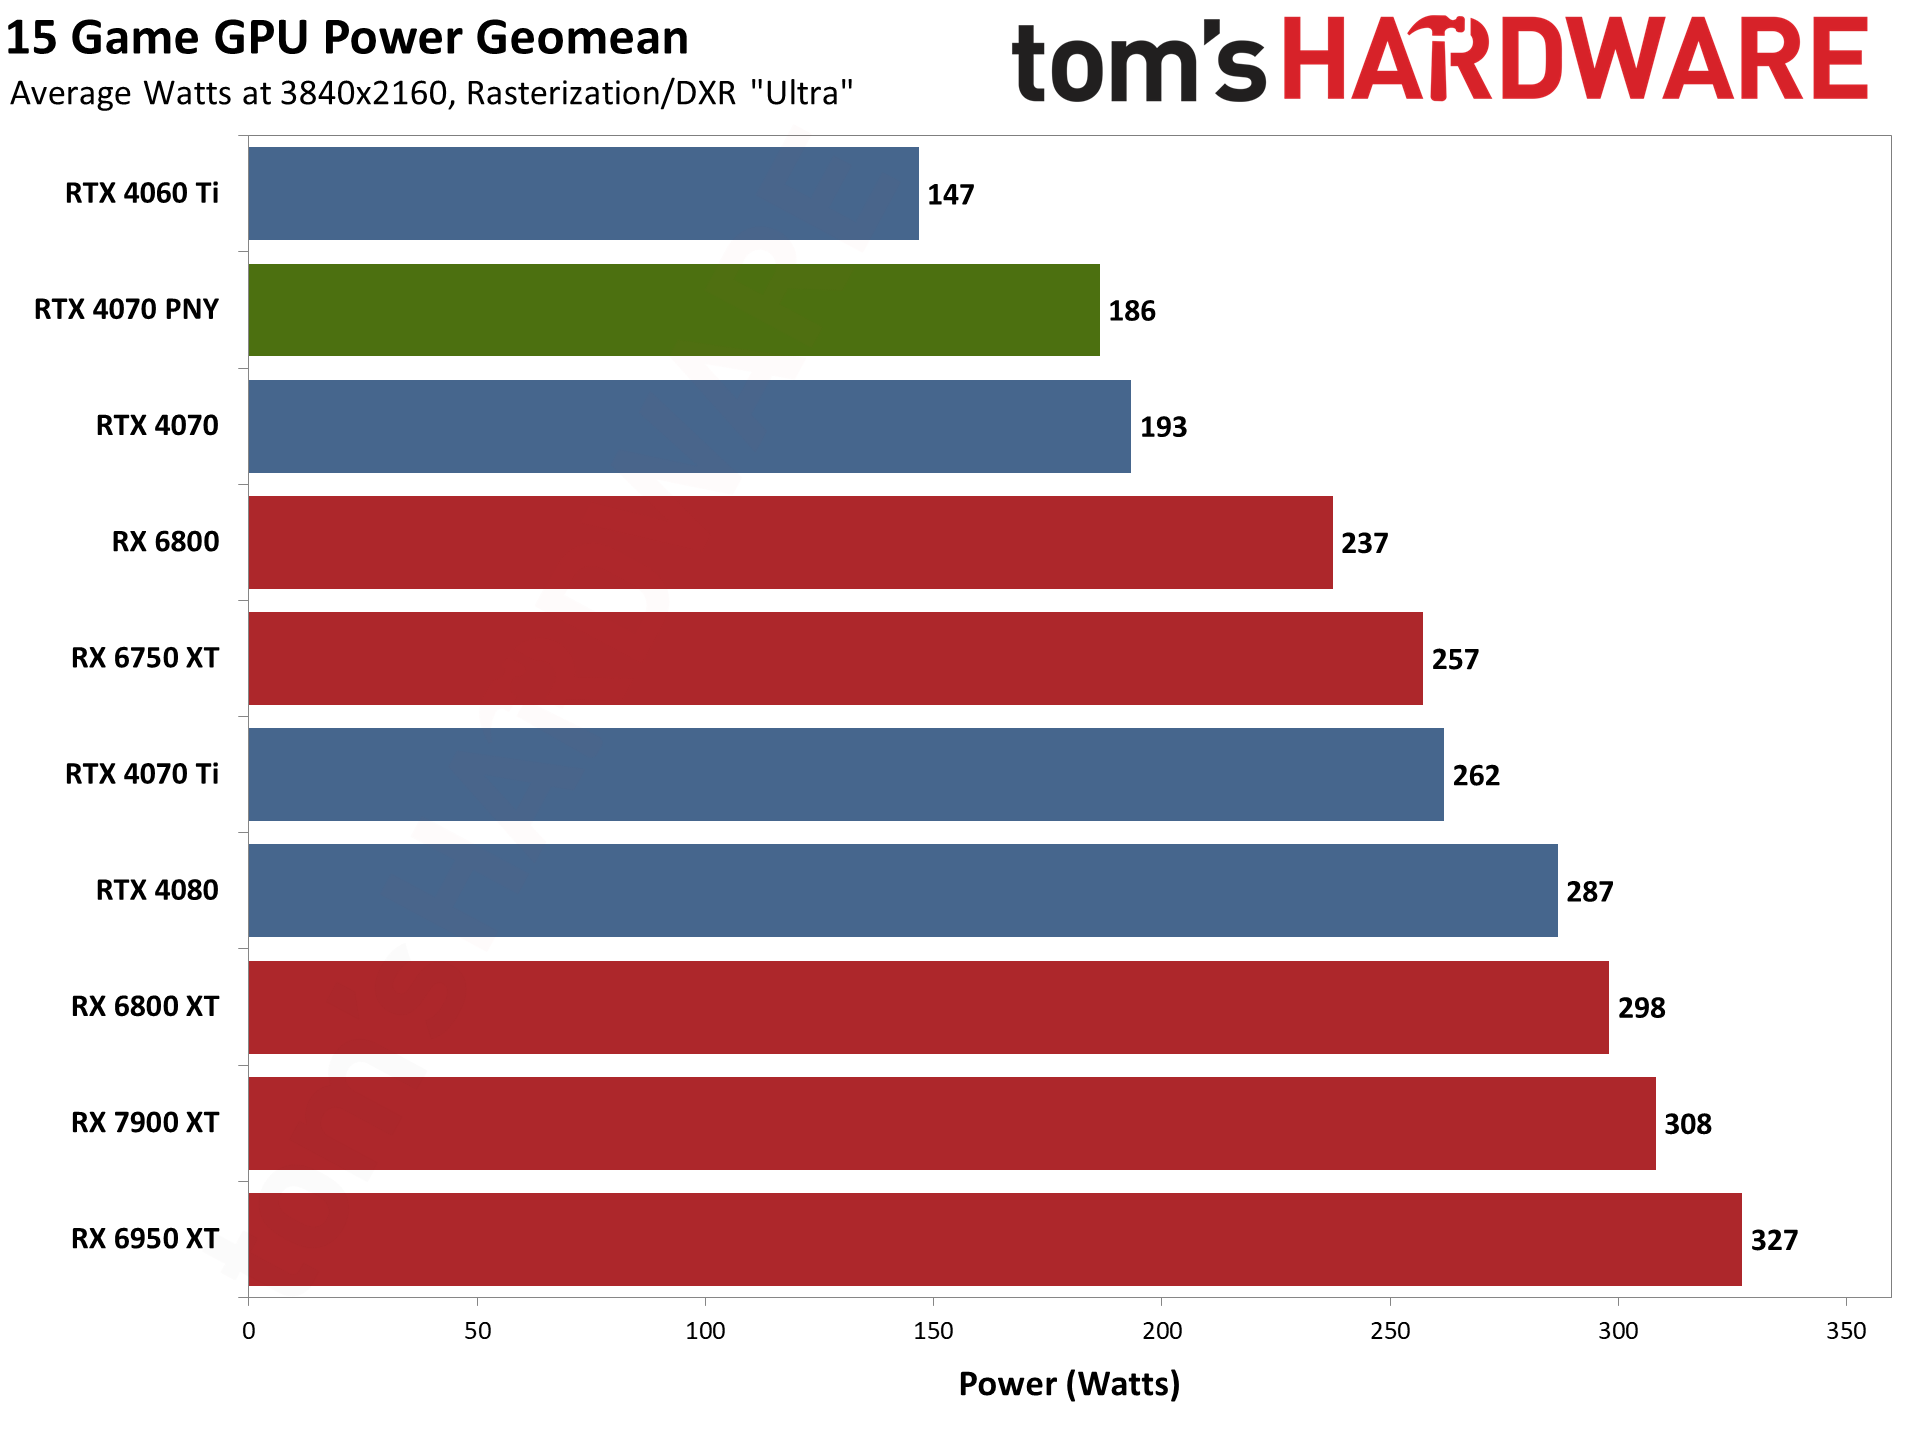
Nvidia's Ada Lovelace architecture proves very efficient overall, and PNY locks down power use more than Nvidia's reference card, so even when overclocked power use doesn't break 200W. The maximum average power use we saw was actually just 192W when overclocked, versus 198W running stock (though we didn't test the overclocked card at 4K ultra or 1080p medium).
The PNY RTX 4070 uses less power than AMD's RX 6800 while delivering performance closer to that of the RX 6950 XT. Even if we drop the ray tracing results, it would still be equal to the RX 6800 XT in rasterized performance while using over 100W less power. Like we said, it's an efficient GPU.
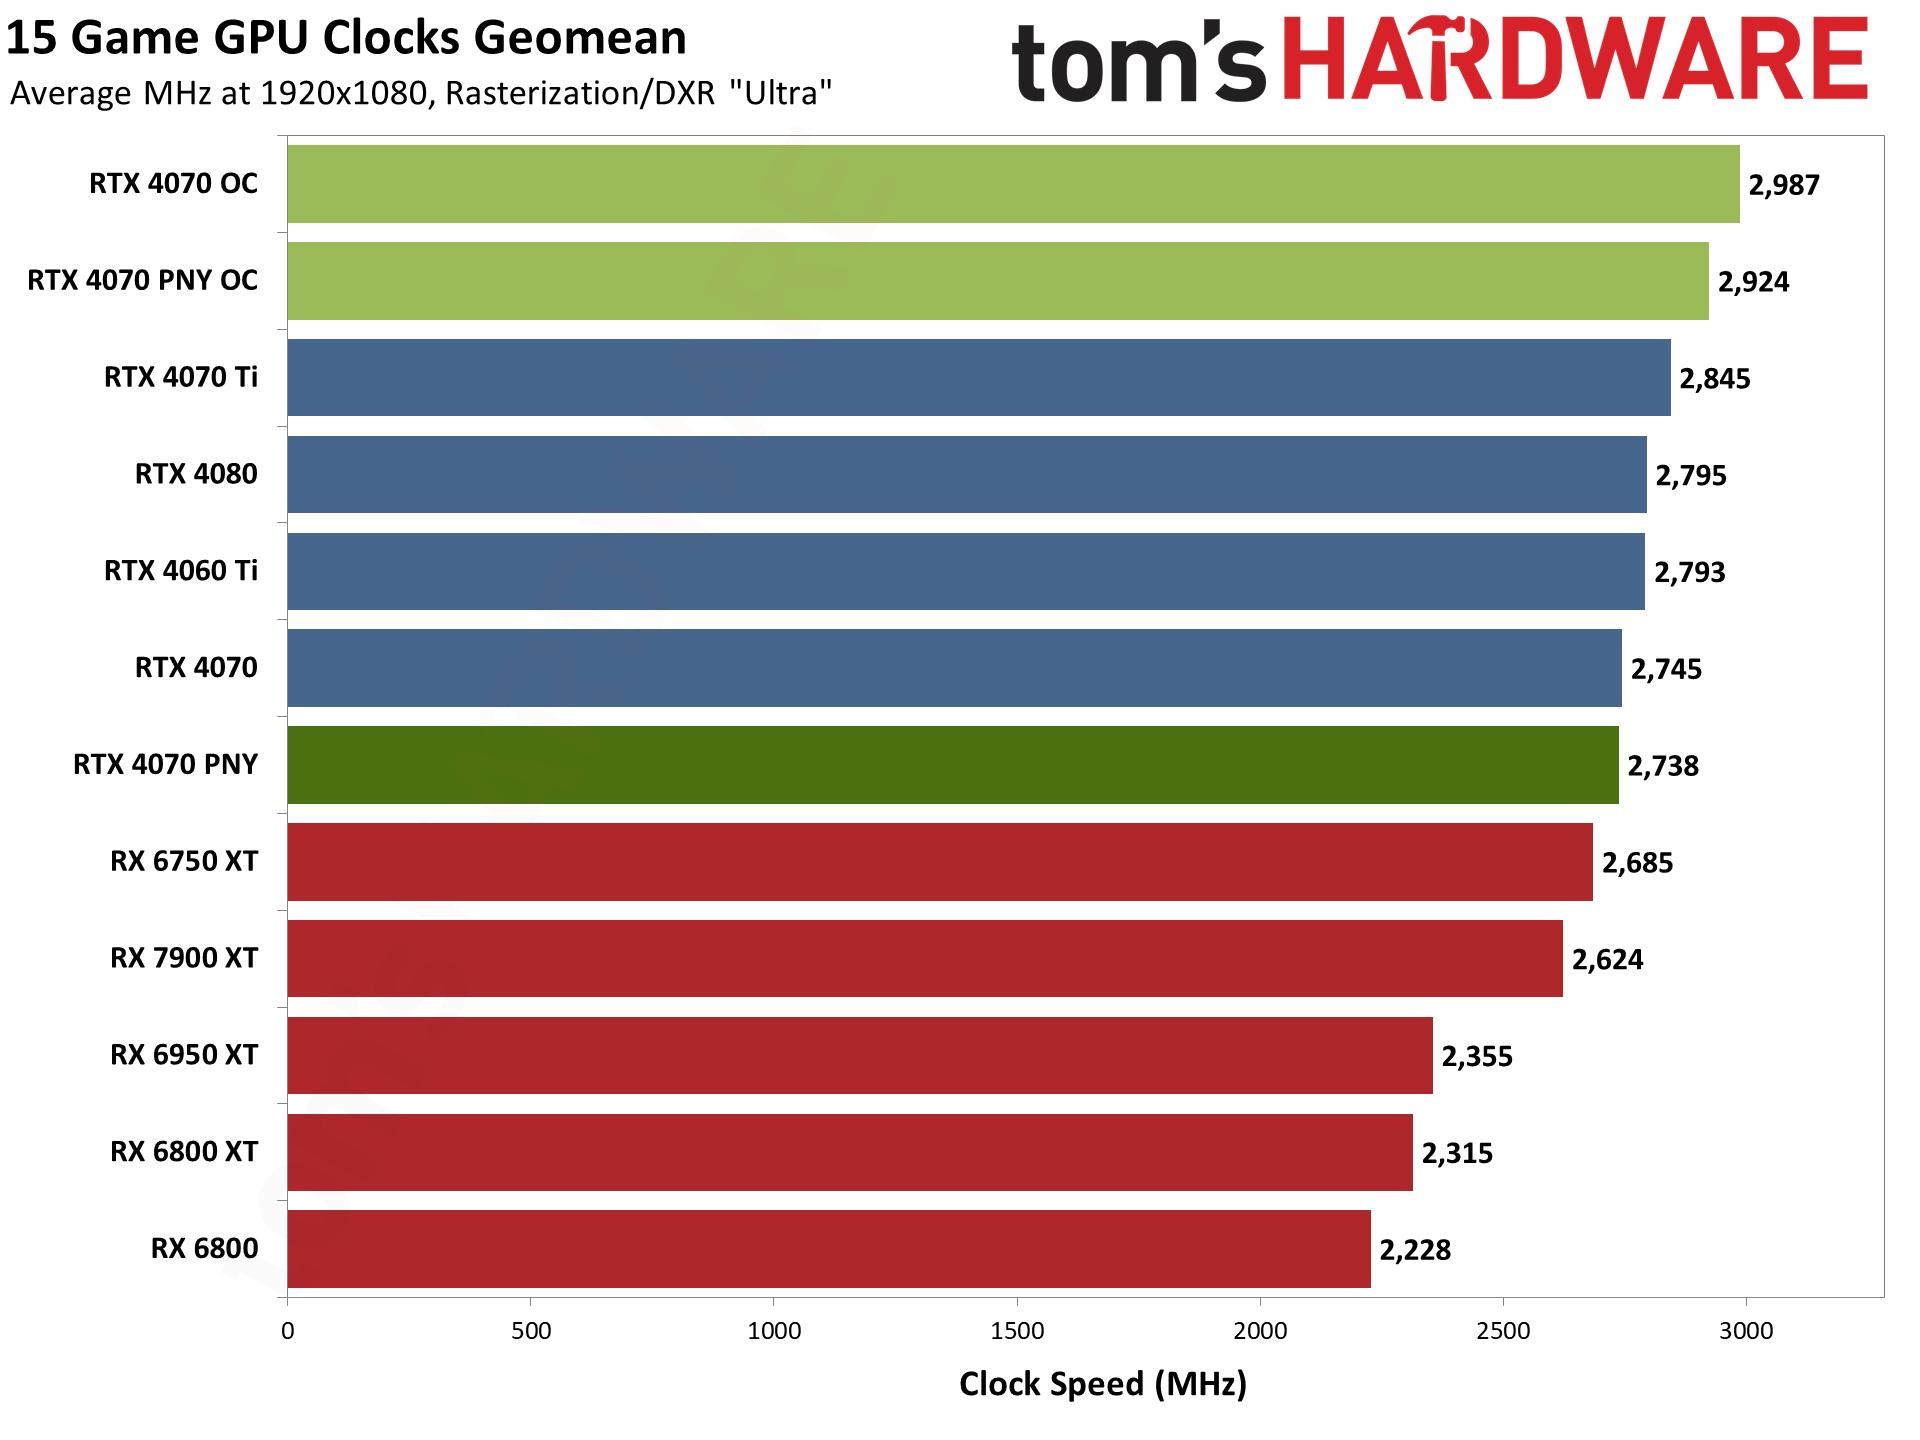
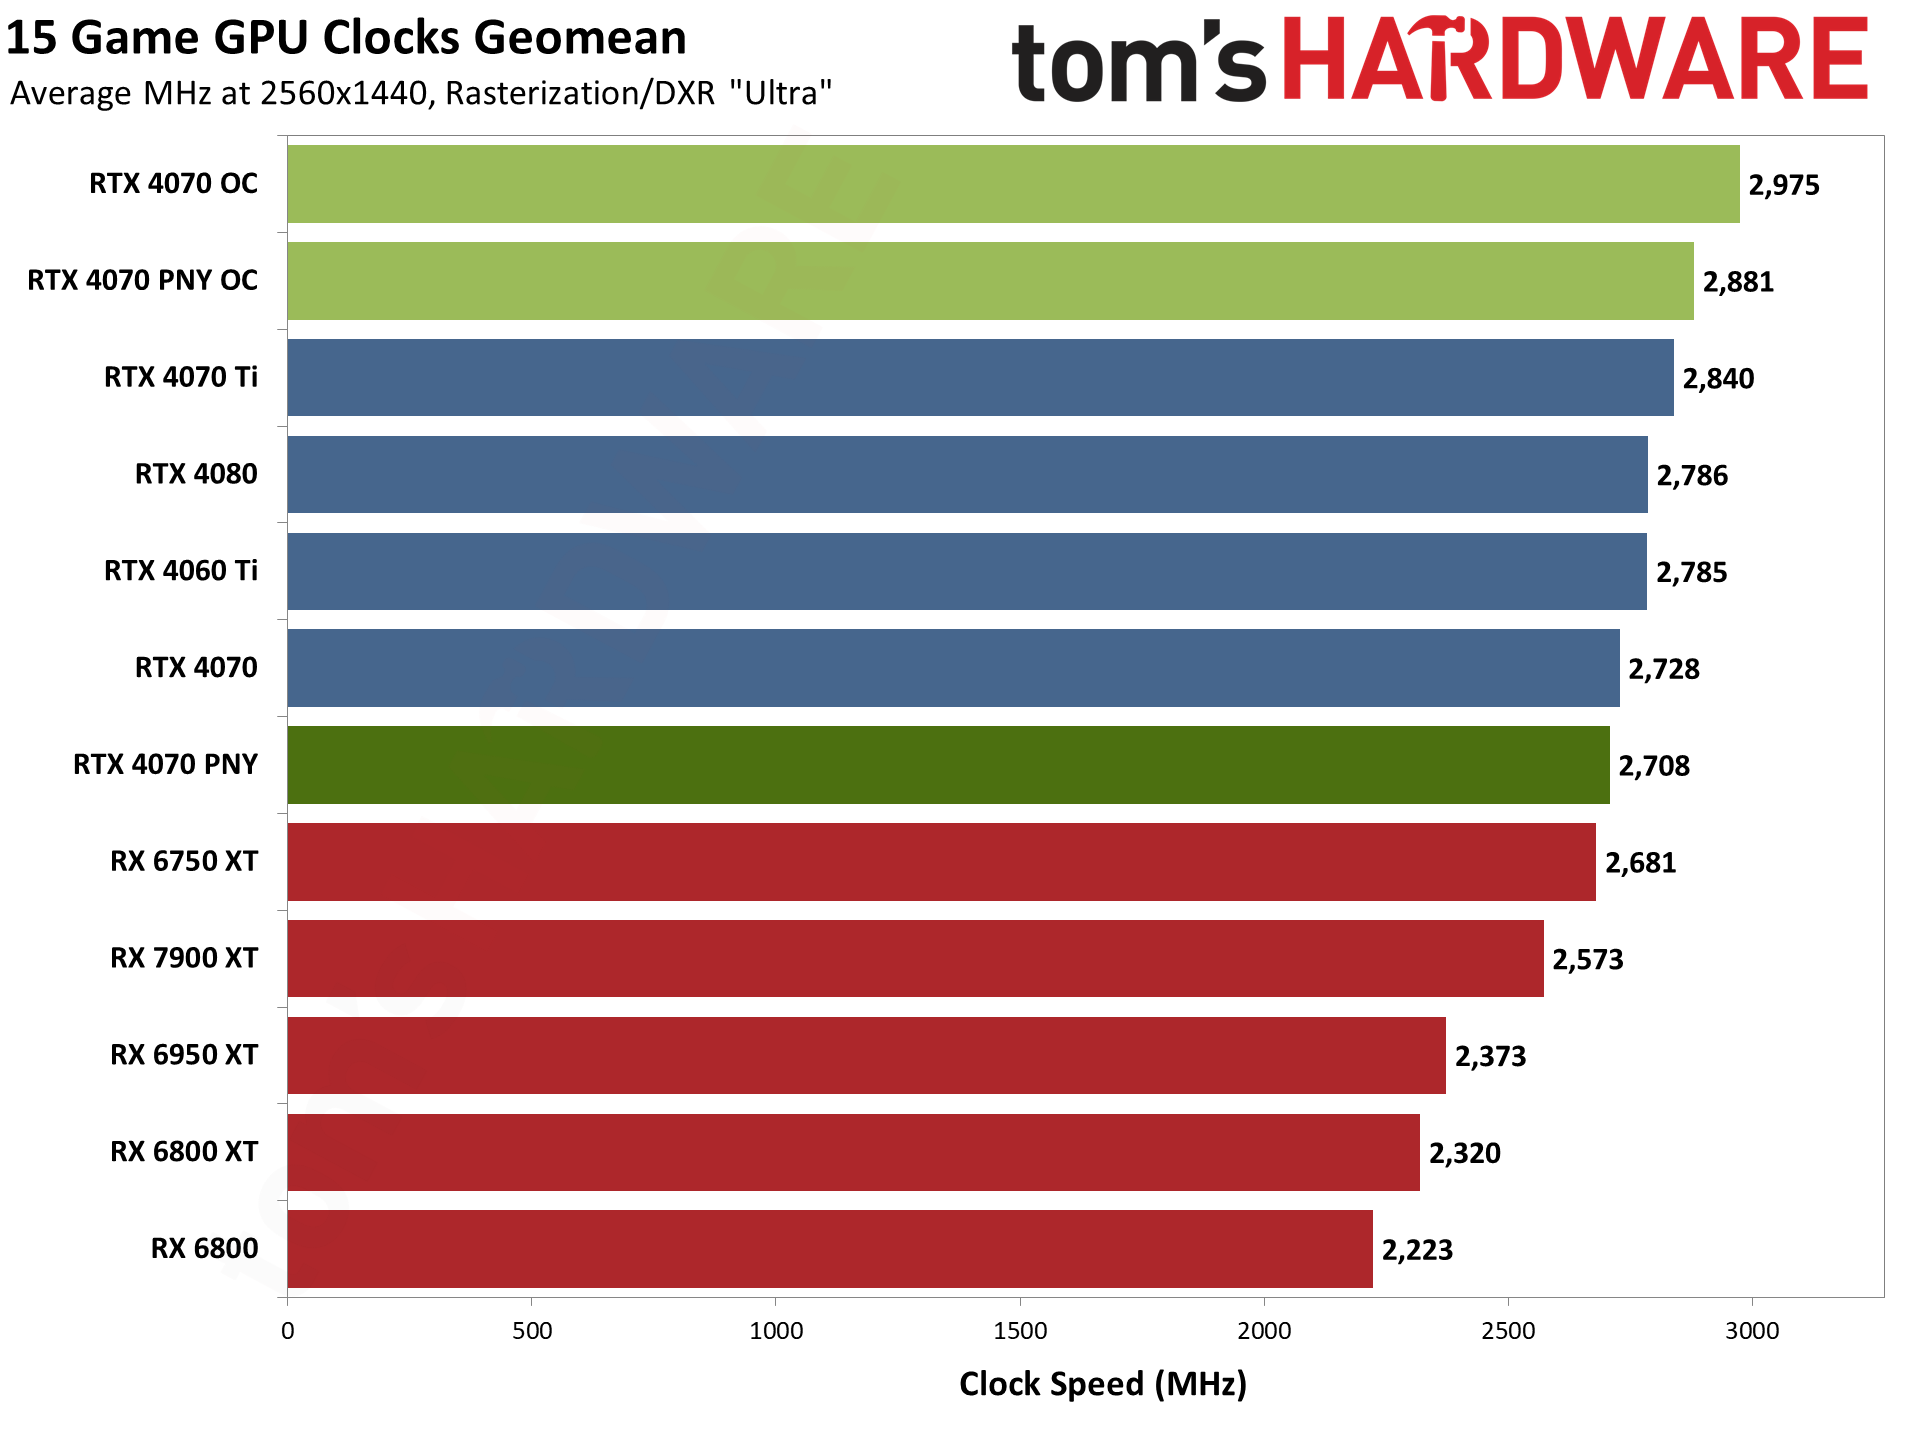
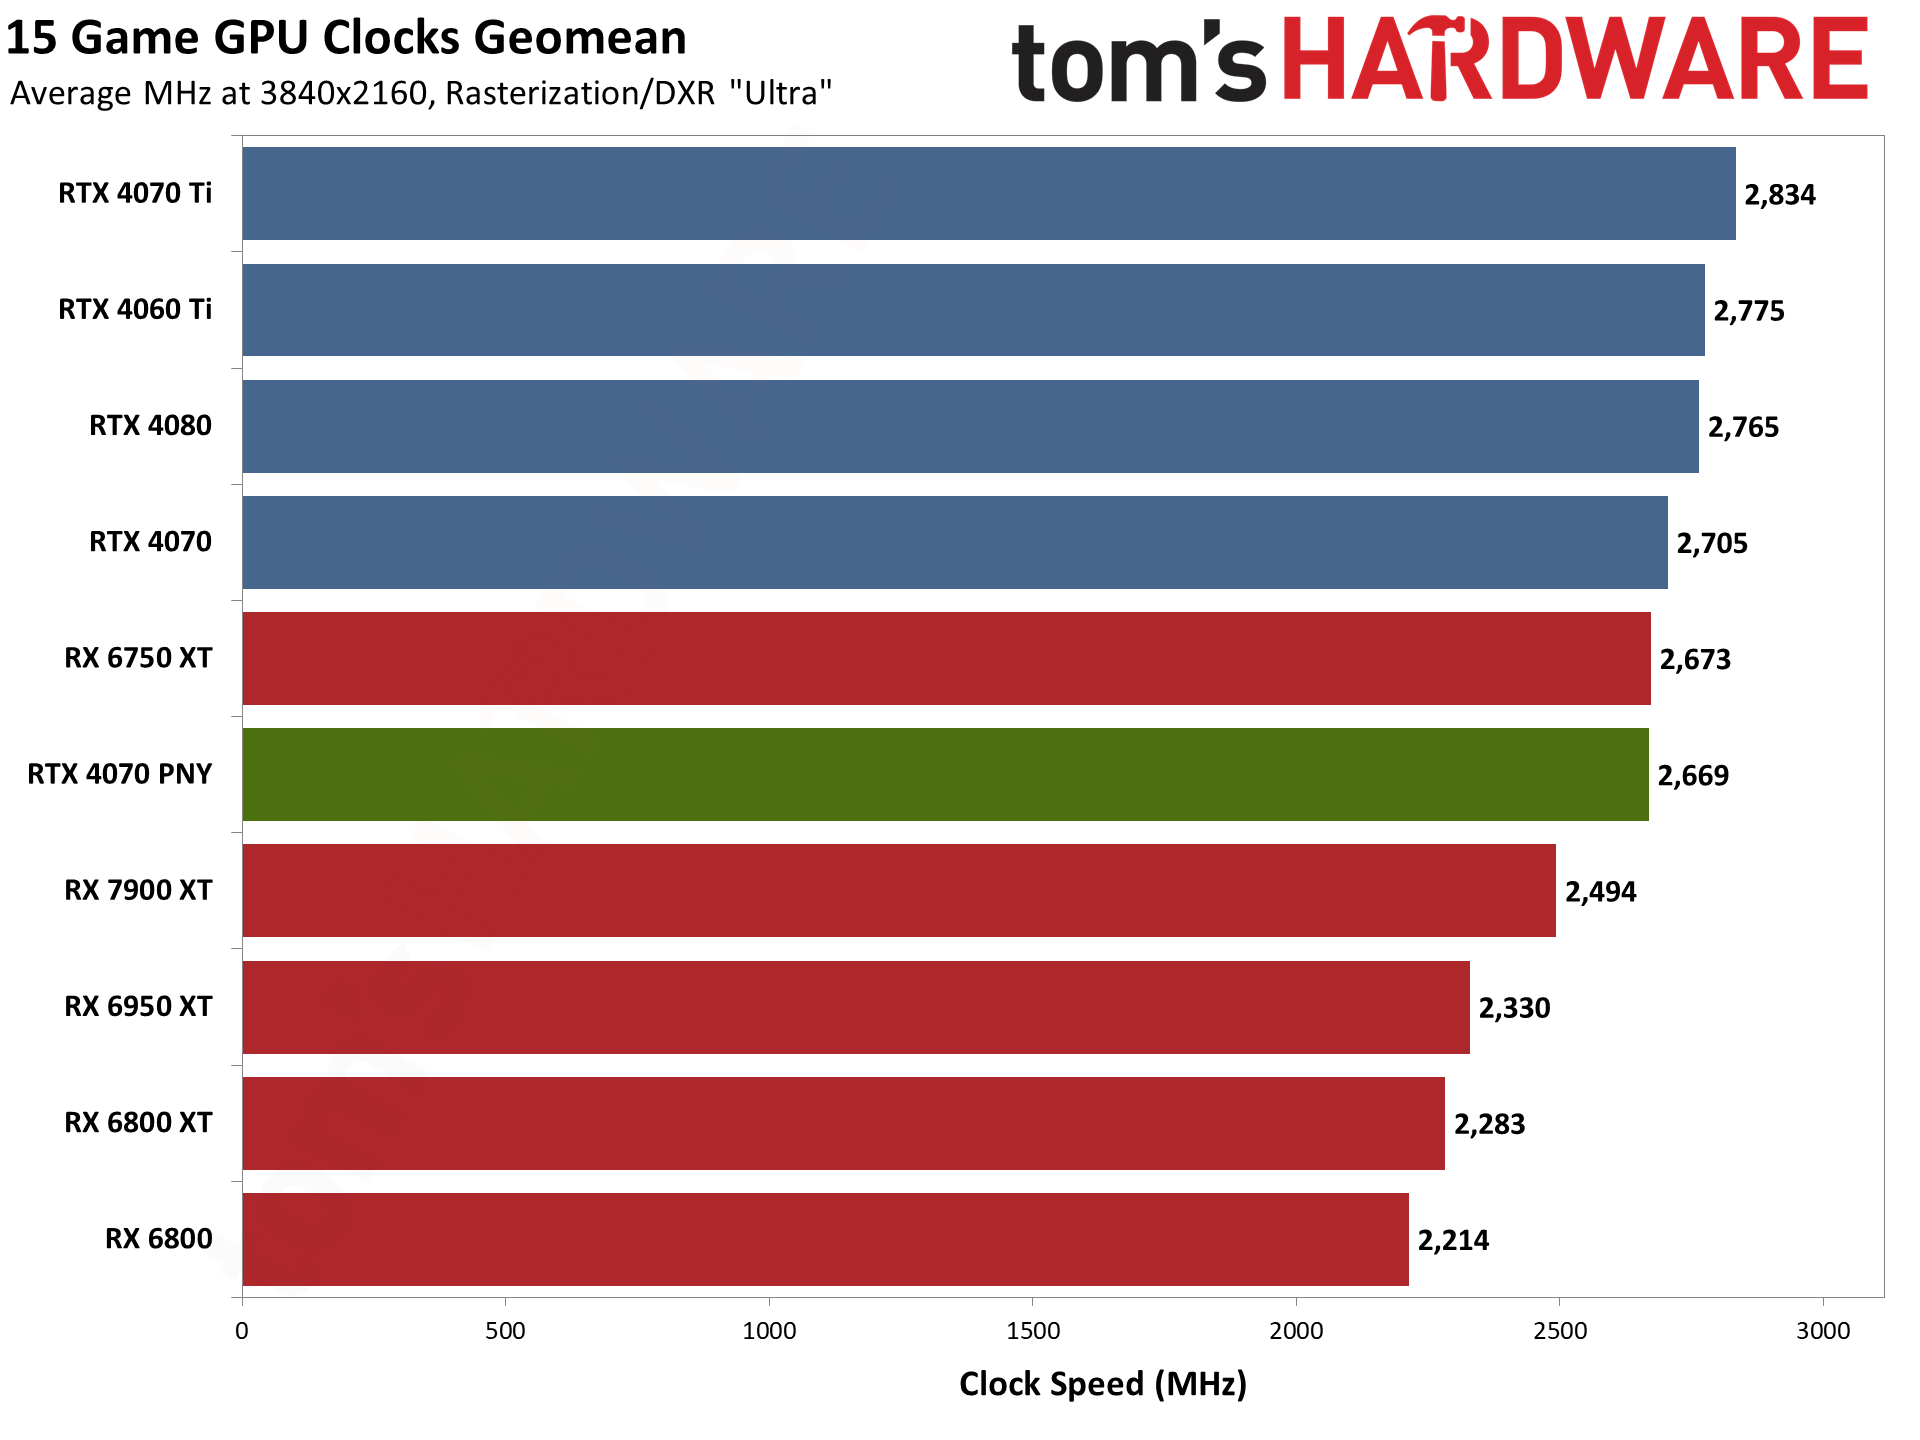
GPU clock speeds on their own don't mean too much, but it's interesting how much clocks have shot up with the latest Nvidia RTX 40-series. Taking a page from AMD's RDNA 2 book, Nvidia focused on improving clocks and is now routinely hitting 2.6–2.8 GHz, where the previous generation RTX 30-series usually topped out at around 1.9 GHz (without serious manual overclocking).
Here's where we also start to see some of the low-level limitations of the PNY RTX 4070. It's nearly as fast as the Founders Edition, but clocks are typically slightly lower, and the gap widens at more demanding settings. Overclocking also hits power limits on the PNY card, so that it runs about 100 MHz slower than the FE card at 1440p.
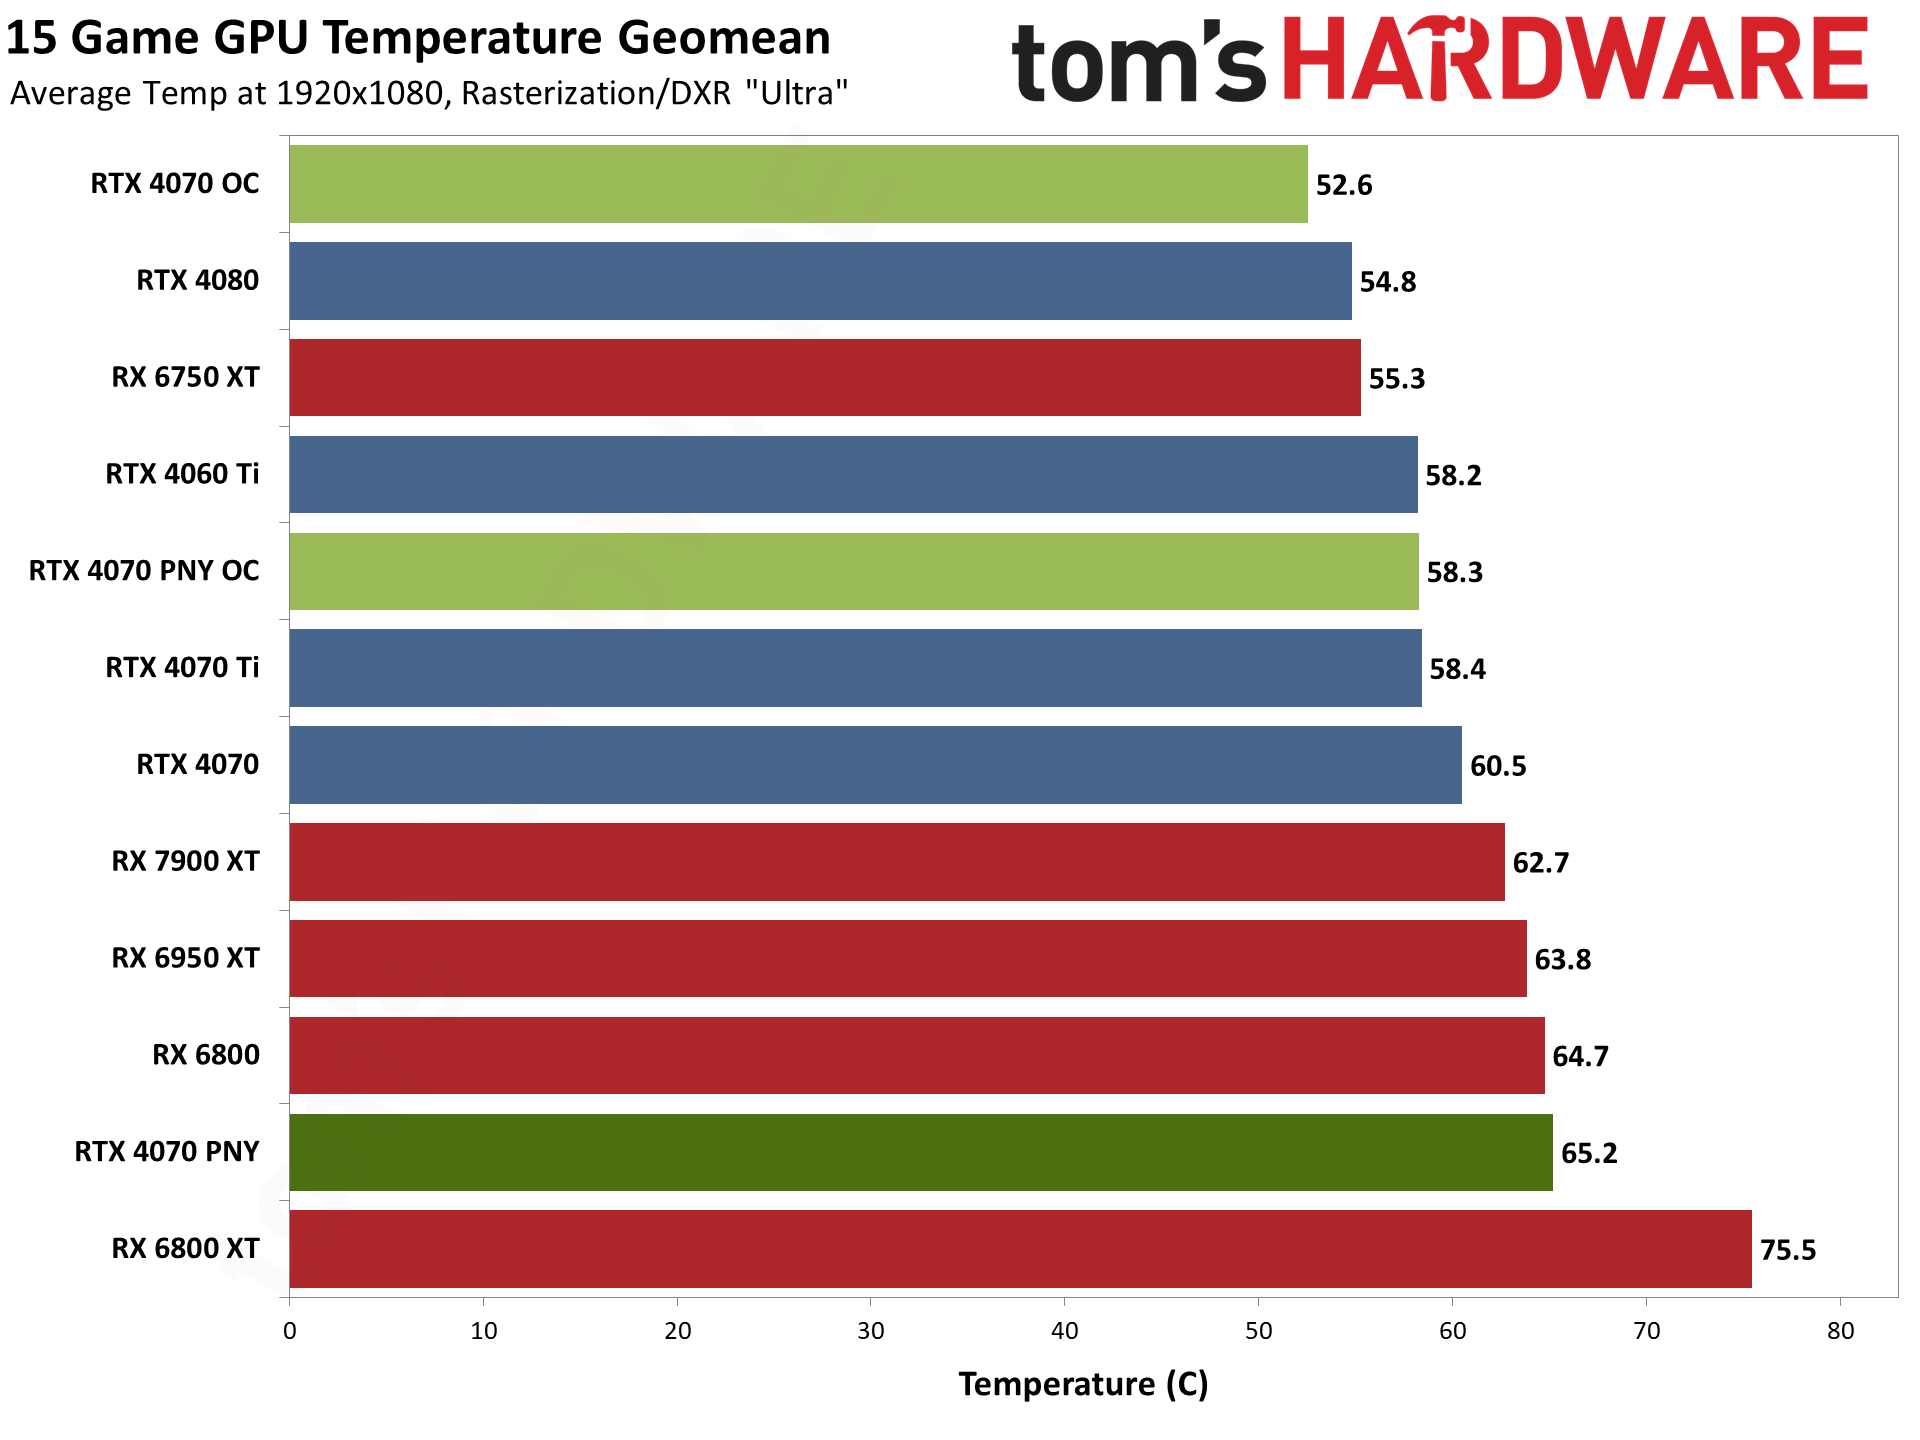
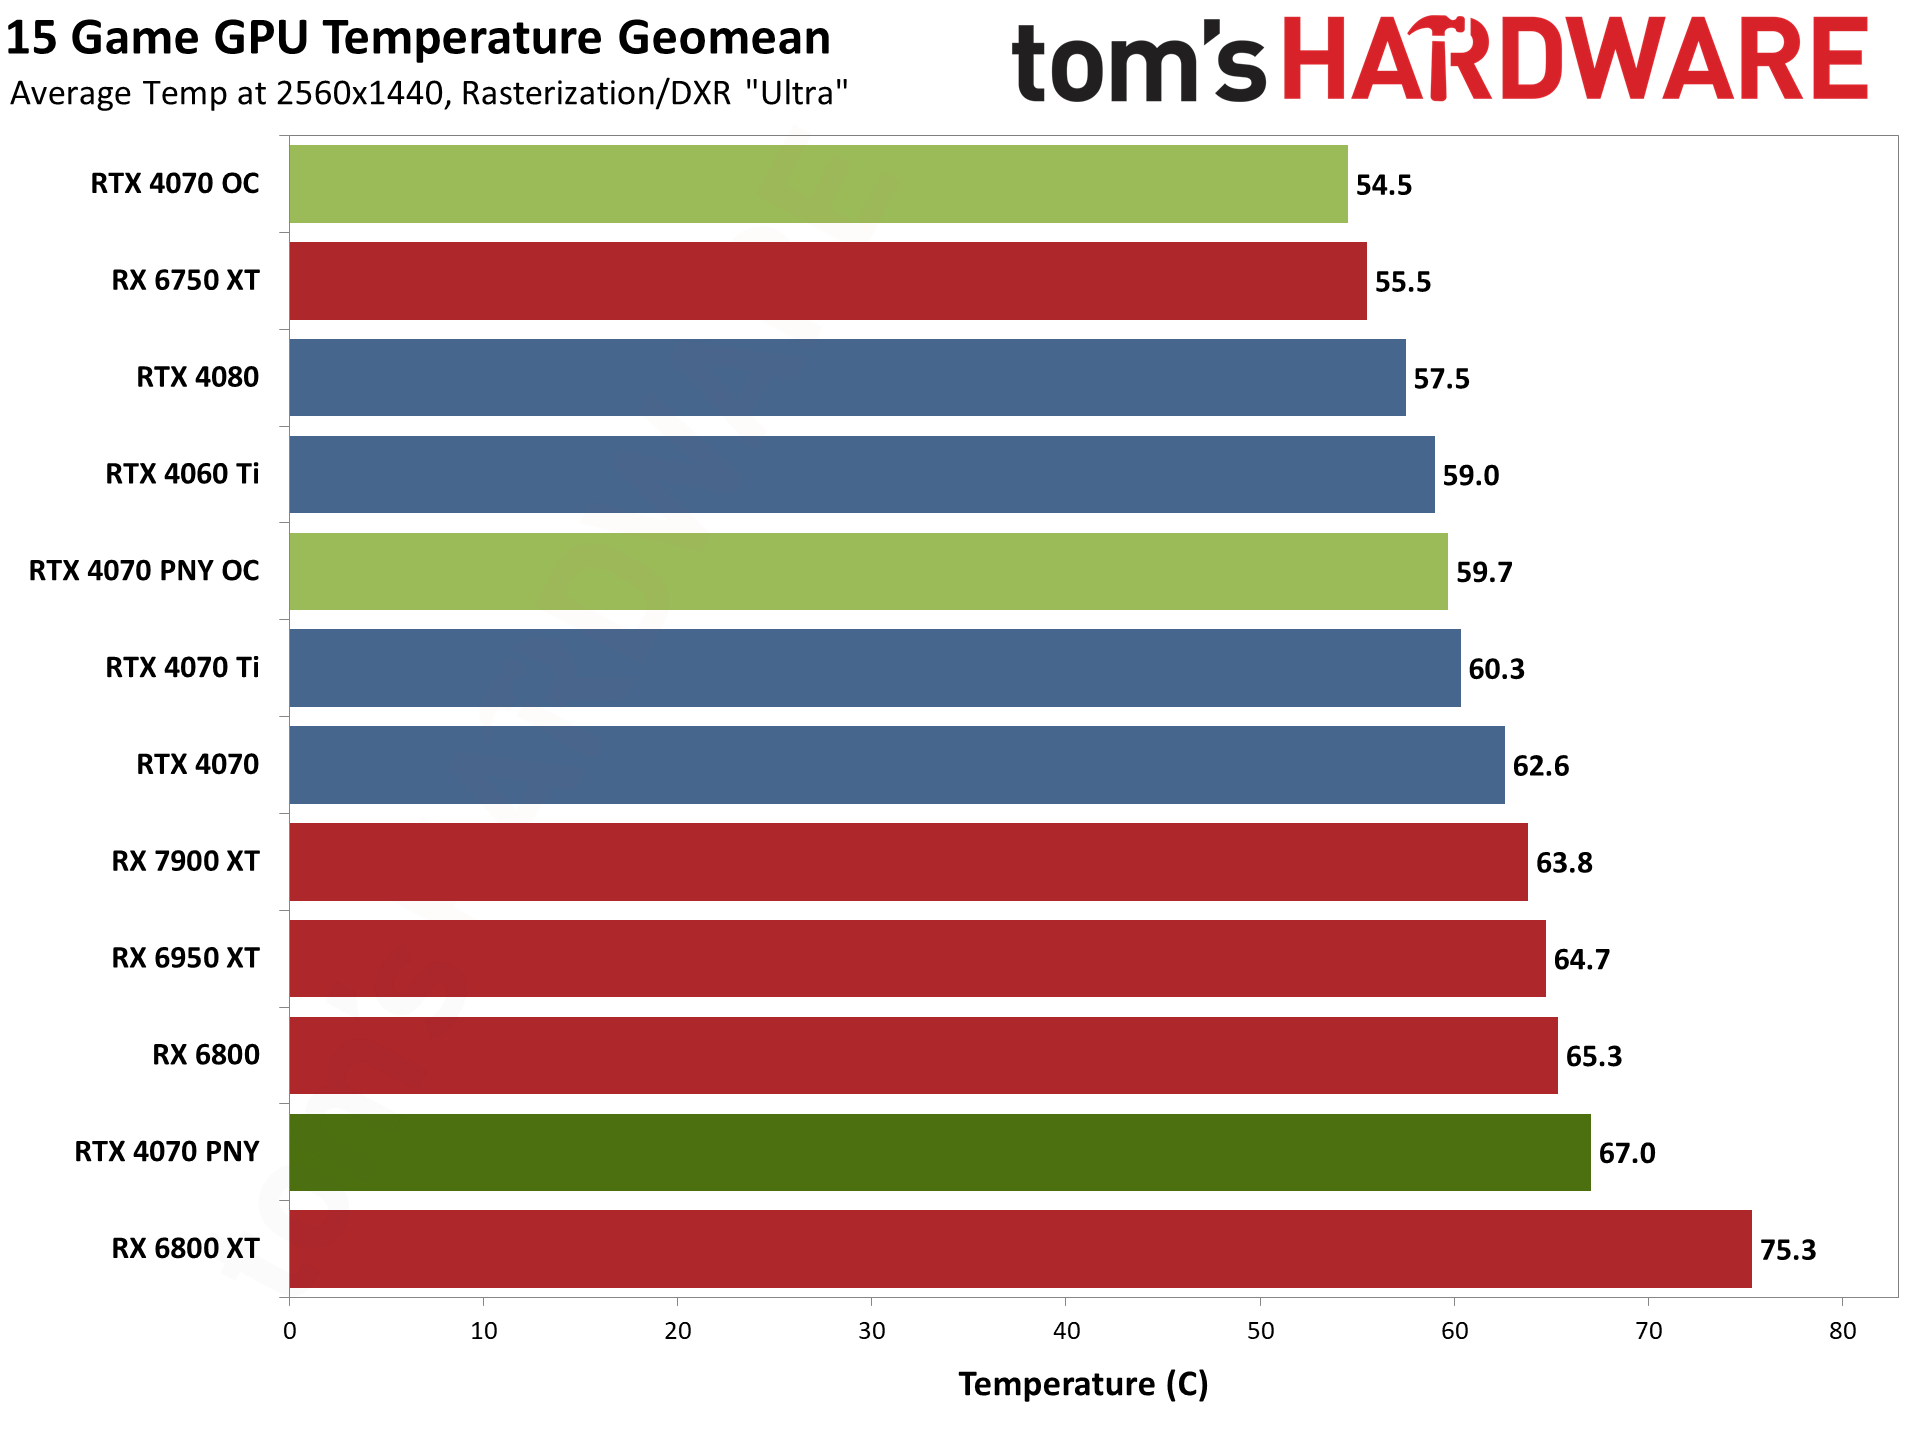
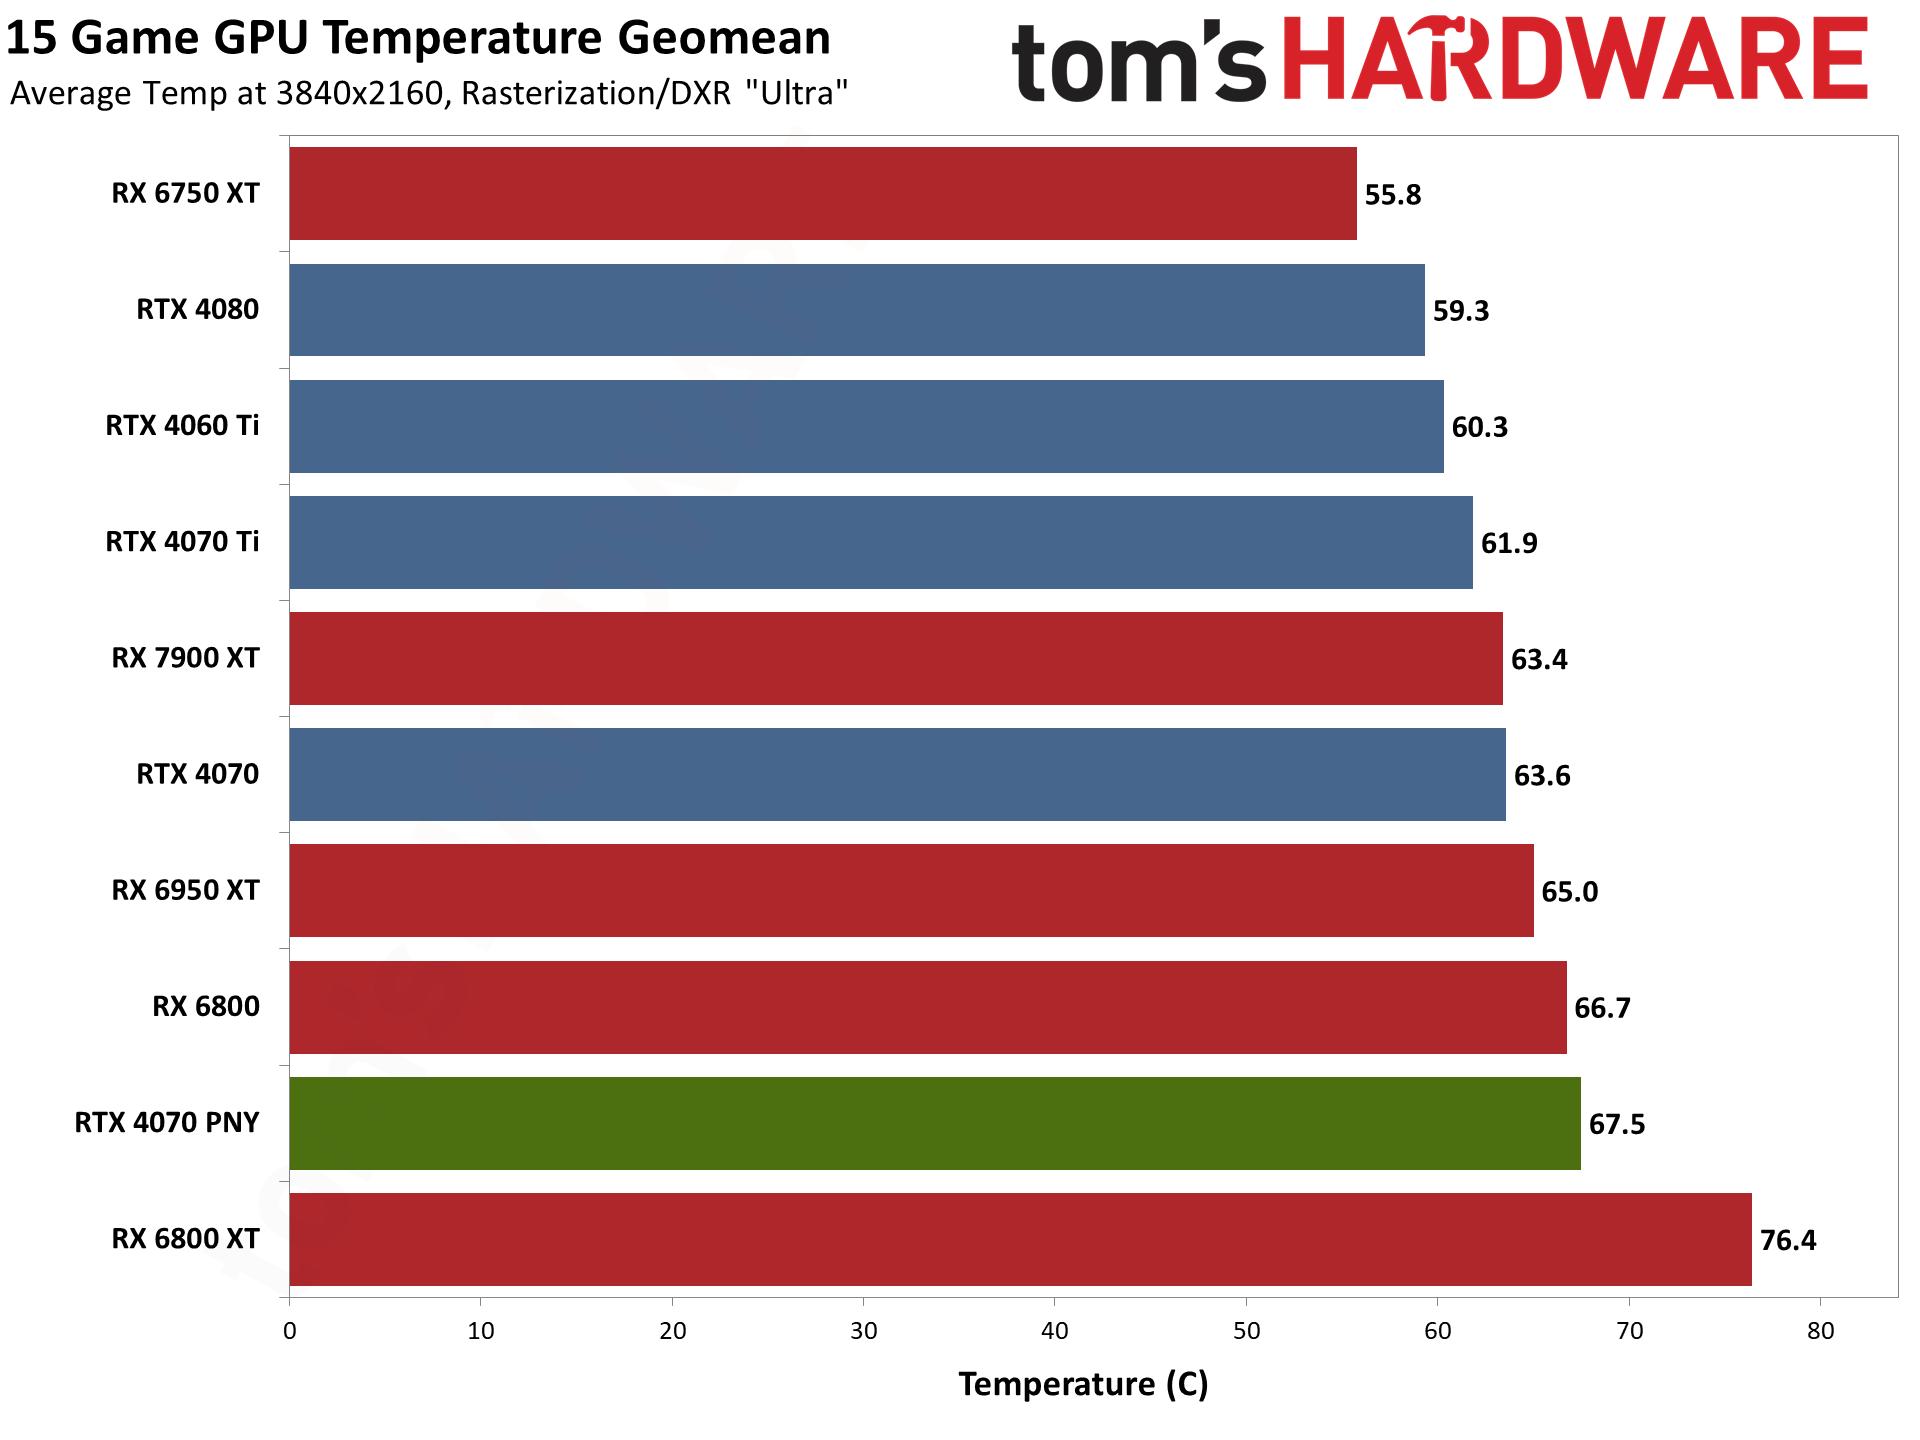
Temperatures are the other part of the equation, and it's possible to tune cards for higher clocks by cranking up fan speeds and noise levels. The PNY RTX 4070 doesn't run hot, but it does run warmer than the reference card by about 4C–5C. Let's look at noise levels to see what's going on...
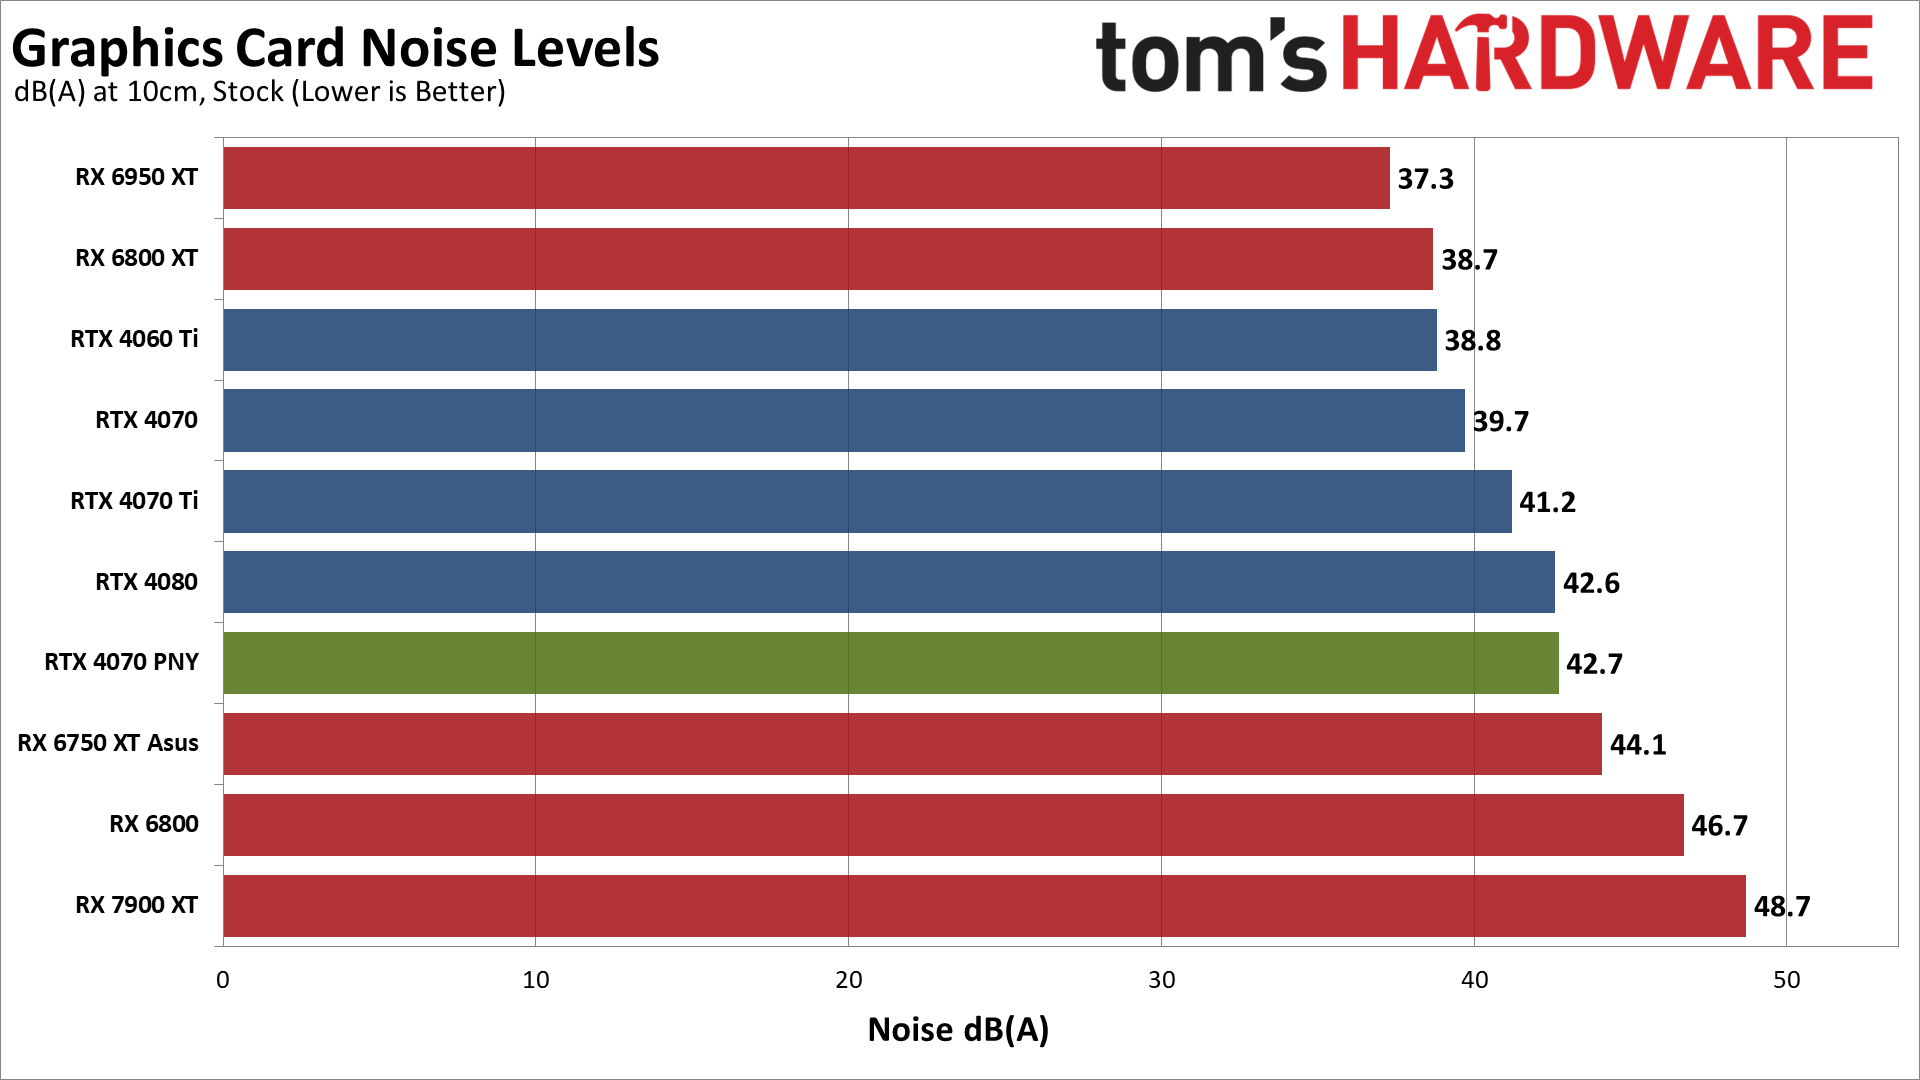
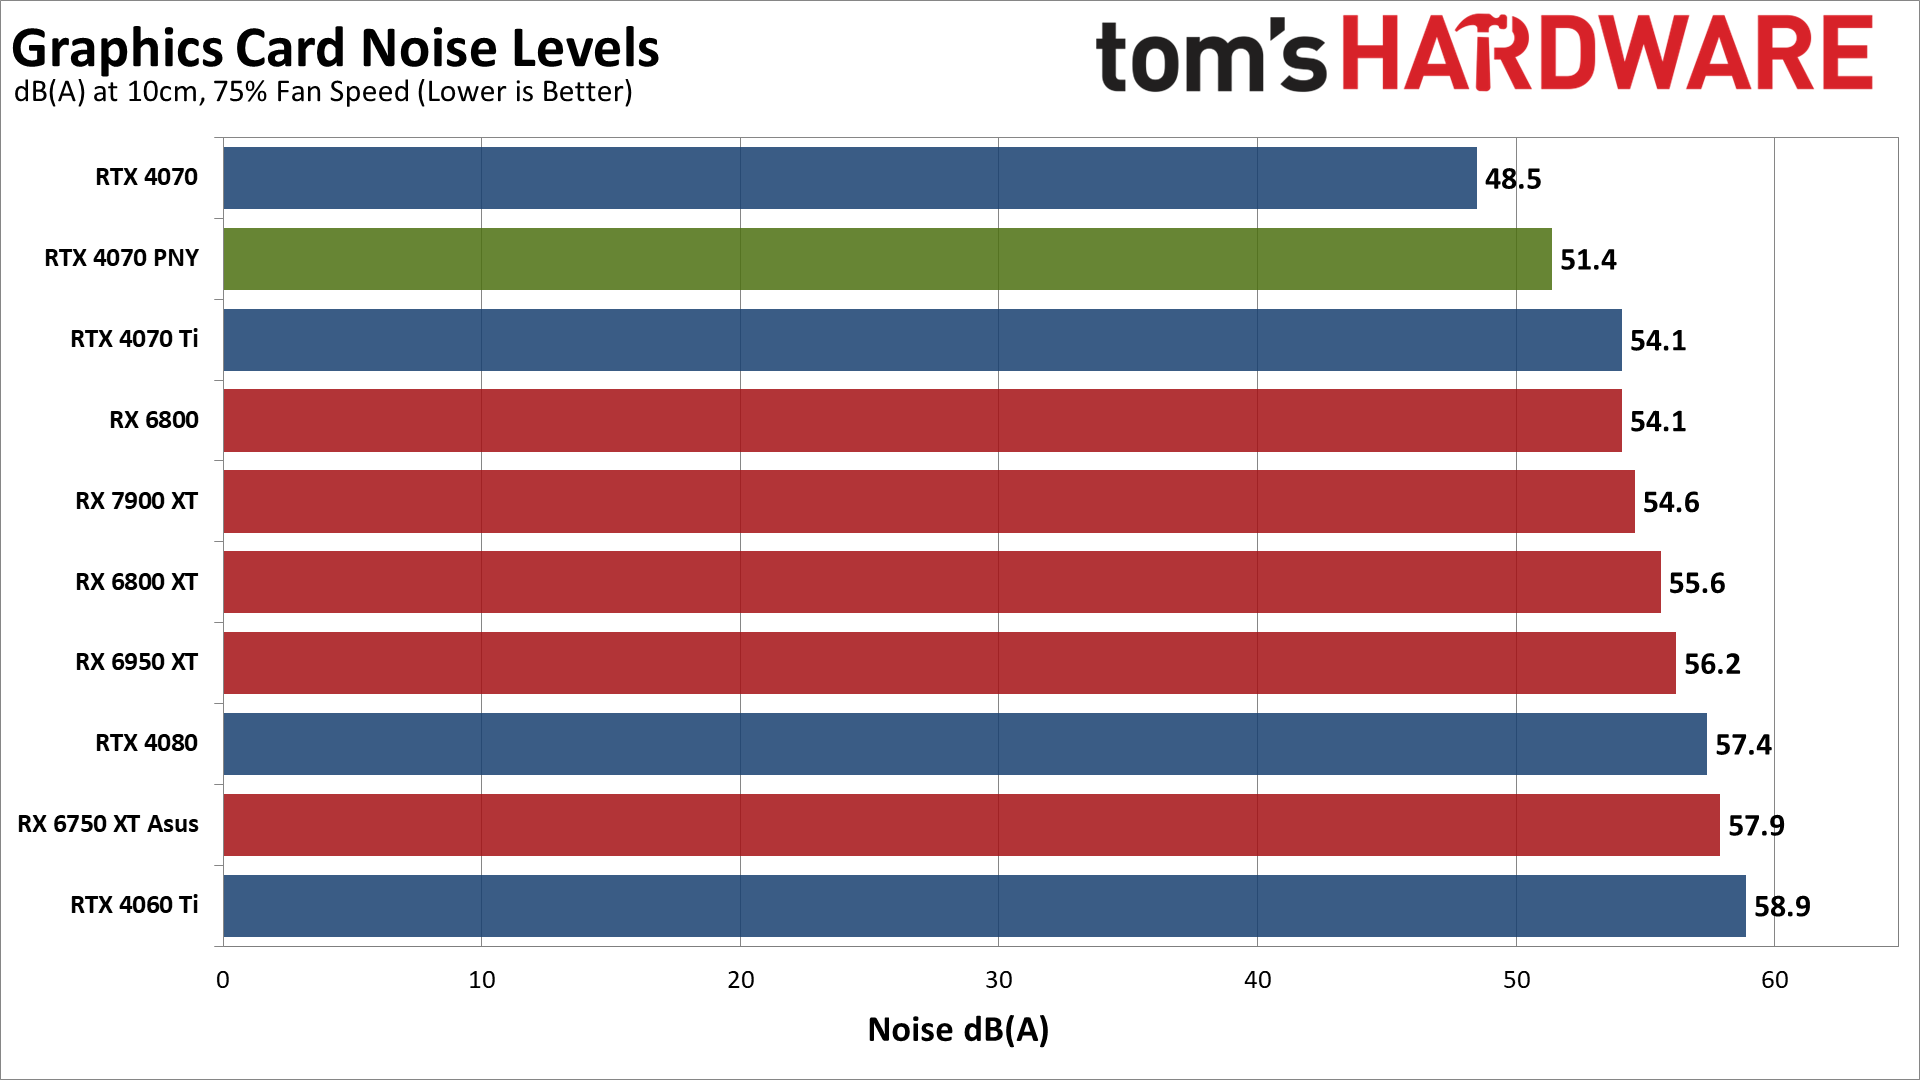
We check noise levels using an SPL (sound pressure level) meter placed 10cm from the card, with the mic aimed right at the center of one of the fans (the right fan on the PNY card). This helps minimize the impact of other noise sources like the fans on the CPU cooler. The noise floor of our test environment and equipment is less than 32 dB(A).
After running Metro Exodus for over 15 minutes, the PNY RTX 4070 settled in at a fan speed of 57% and a noise level of 42.7 dB(A). That's okay in terms of noise, but it's still 3 dB(A) higher than the Founders Edition. It's also interesting that both the FE and PNY cards are at relatively high fan speed percentages, meaning there's not as much room for additional cooling.
We also tested with a static fan speed of 75%, which caused the PNY RTX 4070 to generate 51.4 dB(A) of noise. So the stock noise levels are pretty average, with larger cards typically making less noise. Conversely, at 75% fan speed this is one of the quieter results... though the RTX 4070 FE still does better.
GPU Value and Efficiency
| Graphics Card | FPS/$ | FPS/W | 1080p FPS | 1440p FPS | 4K FPS | Online Price | Power |
|---|---|---|---|---|---|---|---|
| Radeon RX 6750 XT | 0.143 | 0.188 | 68.0 | 47.2 | 24.3 | $330 | 251W |
| GeForce RTX 4060 Ti | 0.137 | 0.382 | 80.1 | 54.9 | 27.9 | $400 | 144W |
| GeForce RTX 4070 | 0.122 | 0.385 | 101.5 | 73.0 | 39.2 | $600 | 190W |
| GeForce RTX 4070 PNY | 0.121 | 0.394 | 101.3 | 72.8 | 39.1 | $600 | 185W |
| Radeon RX 6950 XT | 0.118 | 0.230 | 100.4 | 74.5 | 40.2 | $630 | 324W |
| Radeon RX 6800 | 0.115 | 0.247 | 78.6 | 56.3 | 30.1 | $490 | 228W |
| GeForce RTX 4070 Ti | 0.115 | 0.367 | 121.7 | 90.5 | 50.0 | $790 | 246W |
| Radeon RX 7900 XT | 0.111 | 0.281 | 113.2 | 86.2 | 47.8 | $780 | 307W |
| GeForce RTX 4080 | 0.098 | 0.412 | 139.0 | 108.3 | 62.7 | $1,108 | 263W |
| Radeon RX 6800 XT | 0.074 | 0.222 | 90.1 | 65.4 | 35.1 | $880 | 294W |
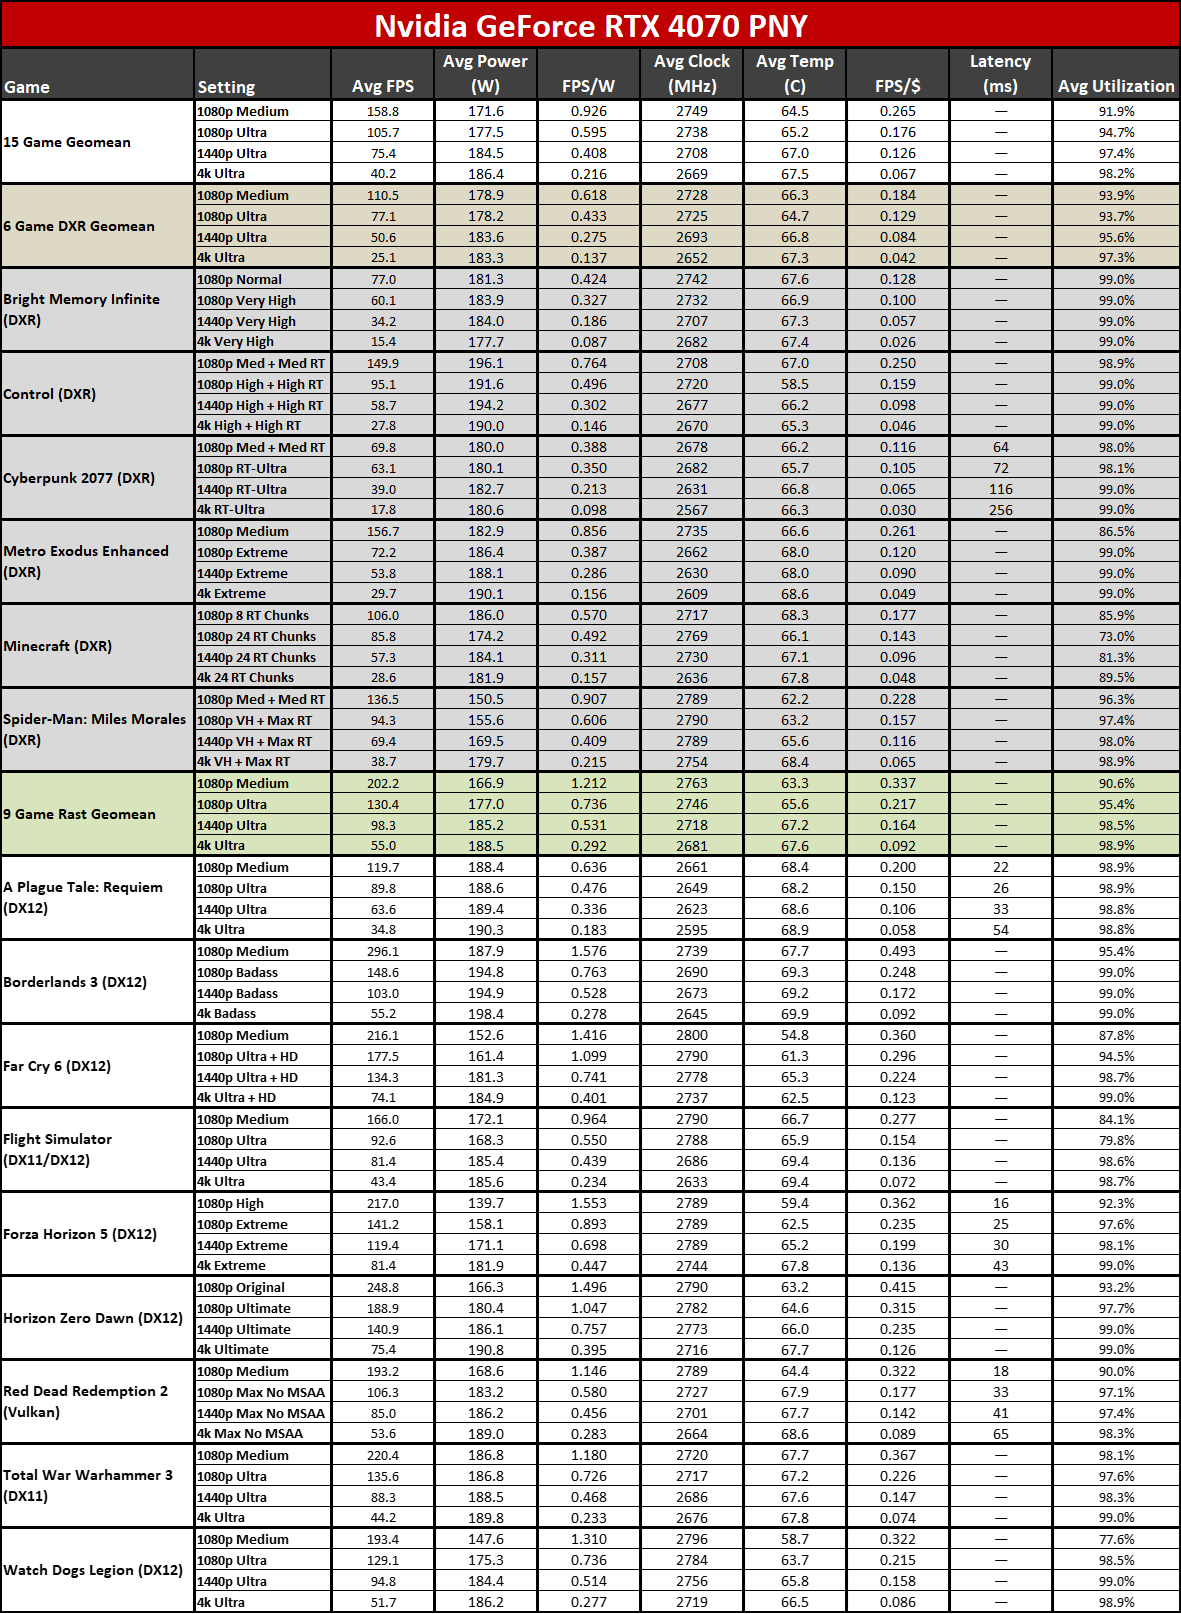
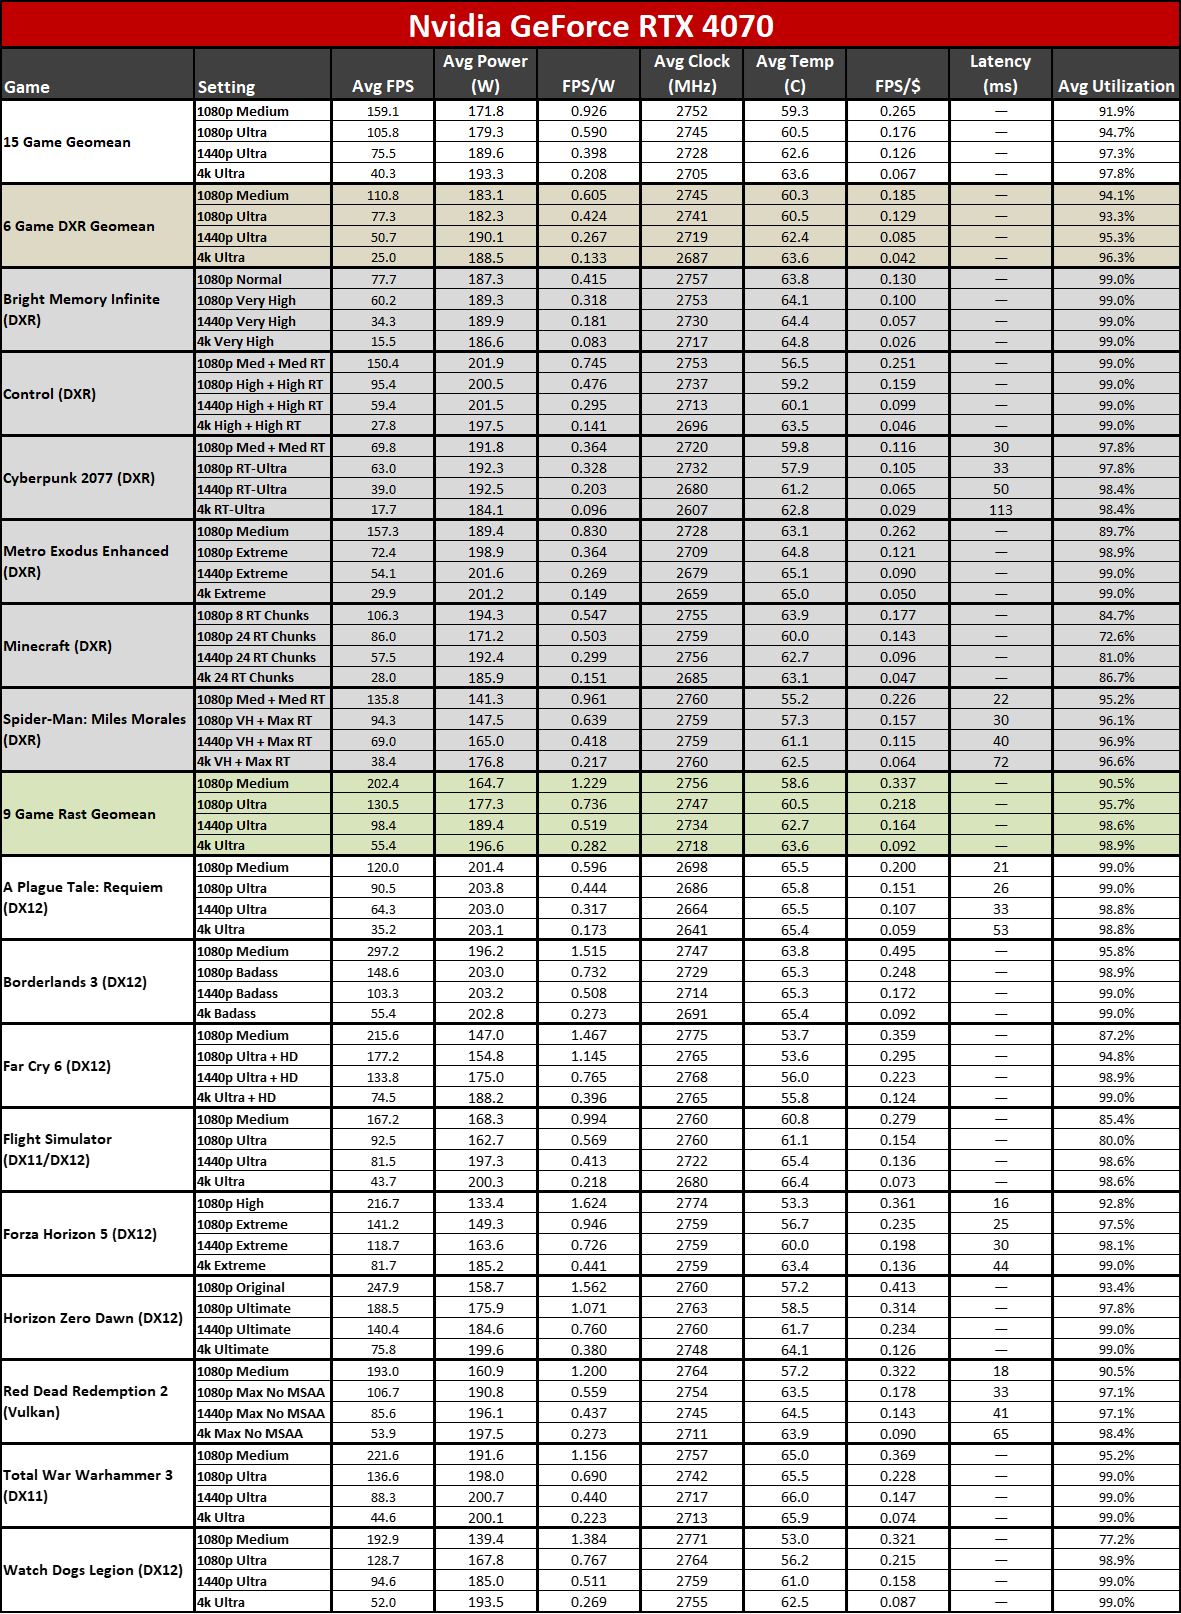
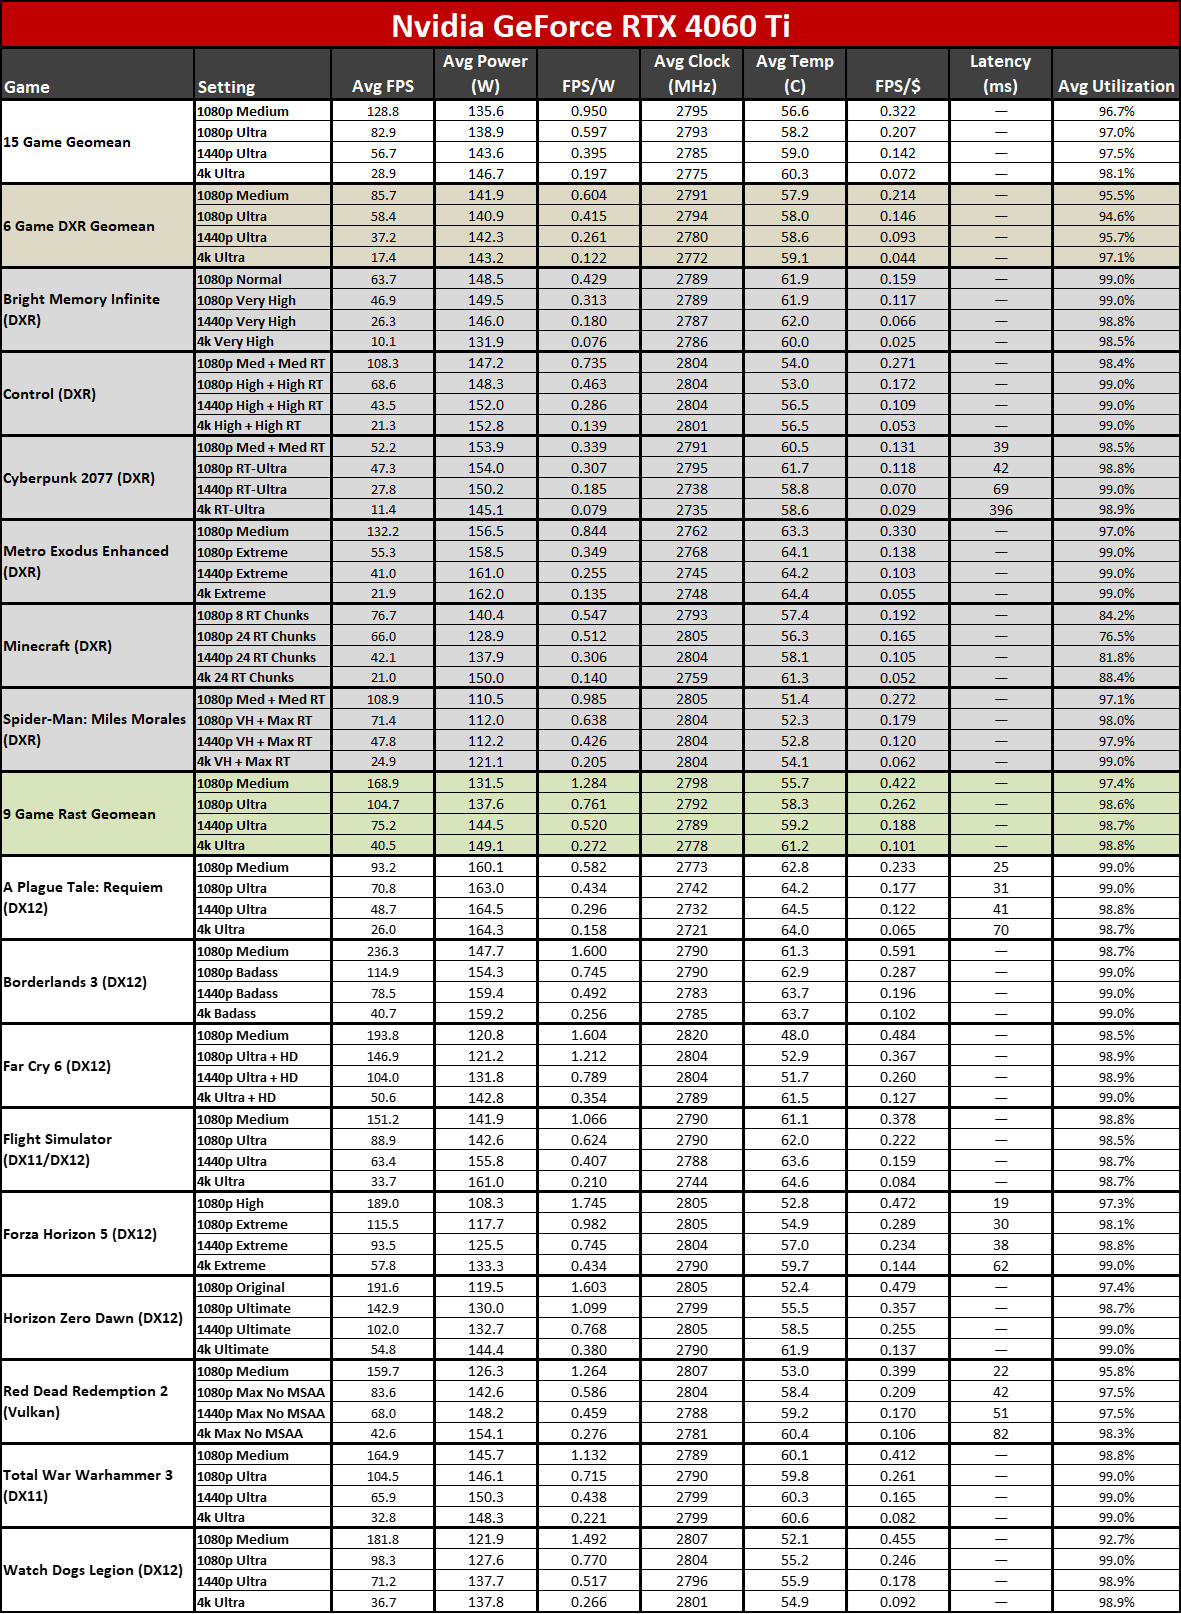
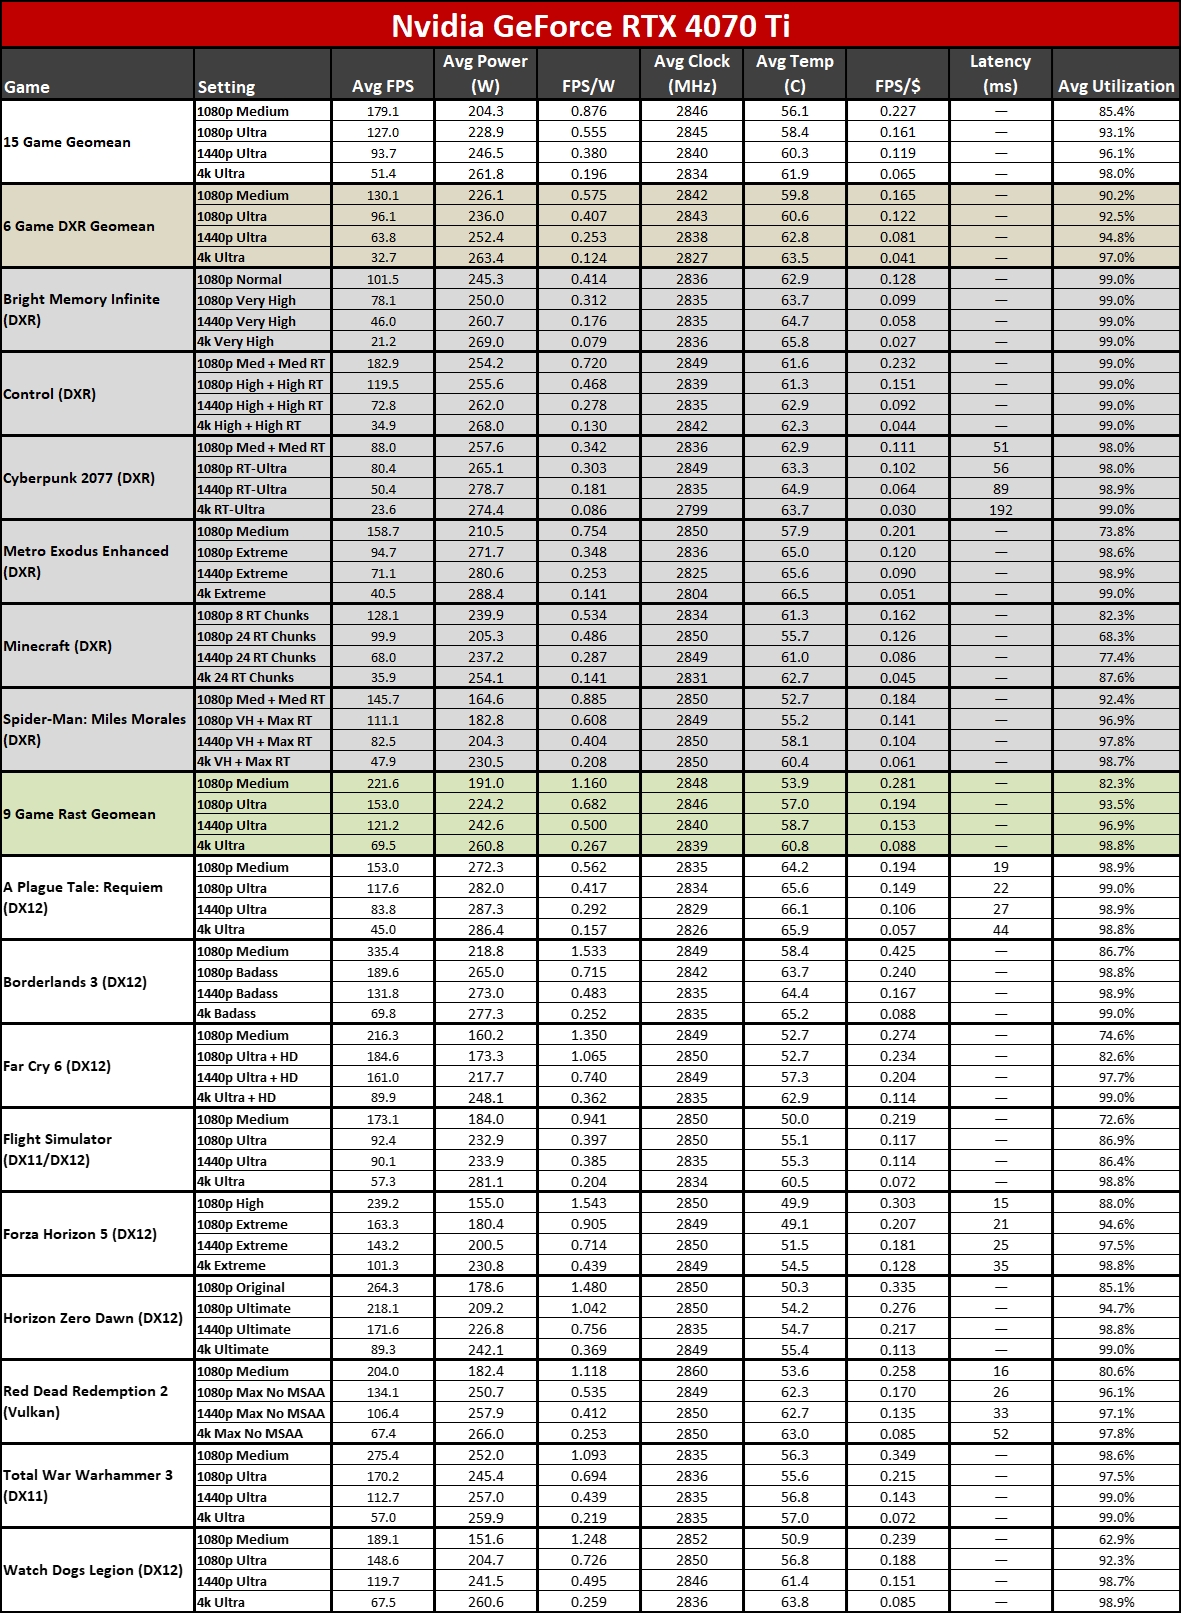
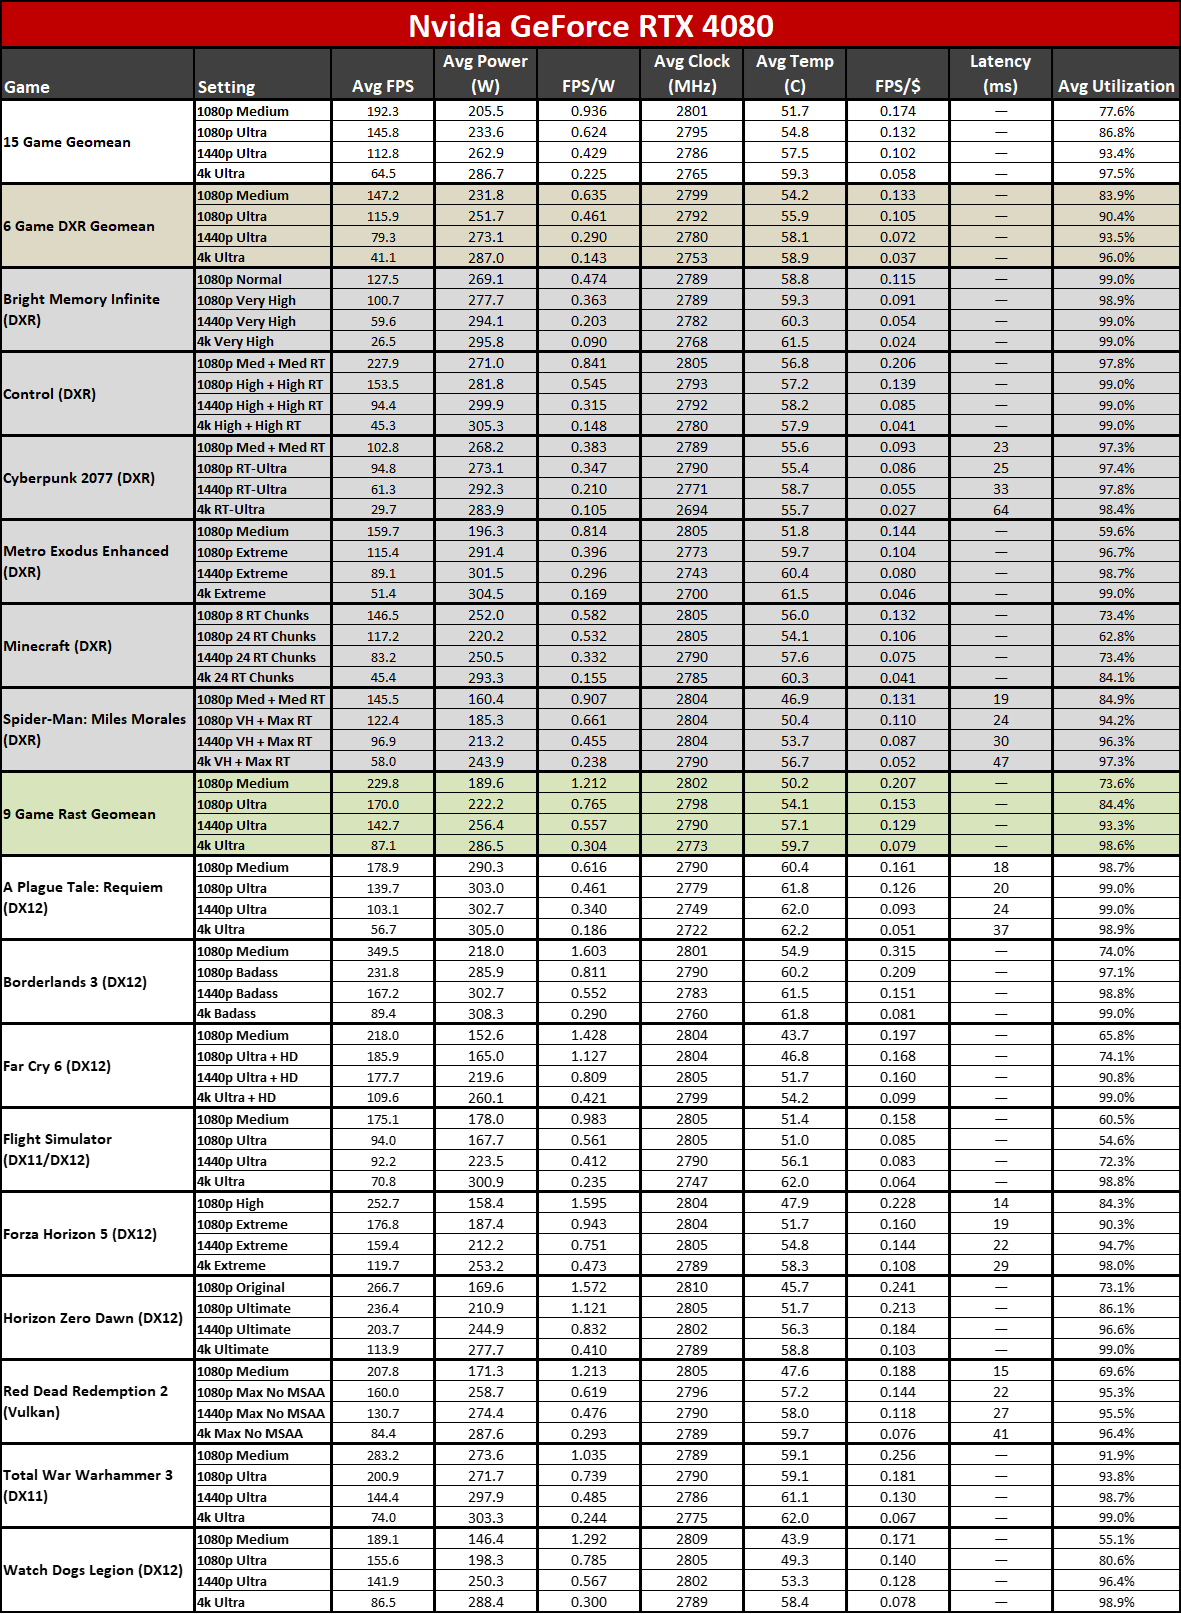
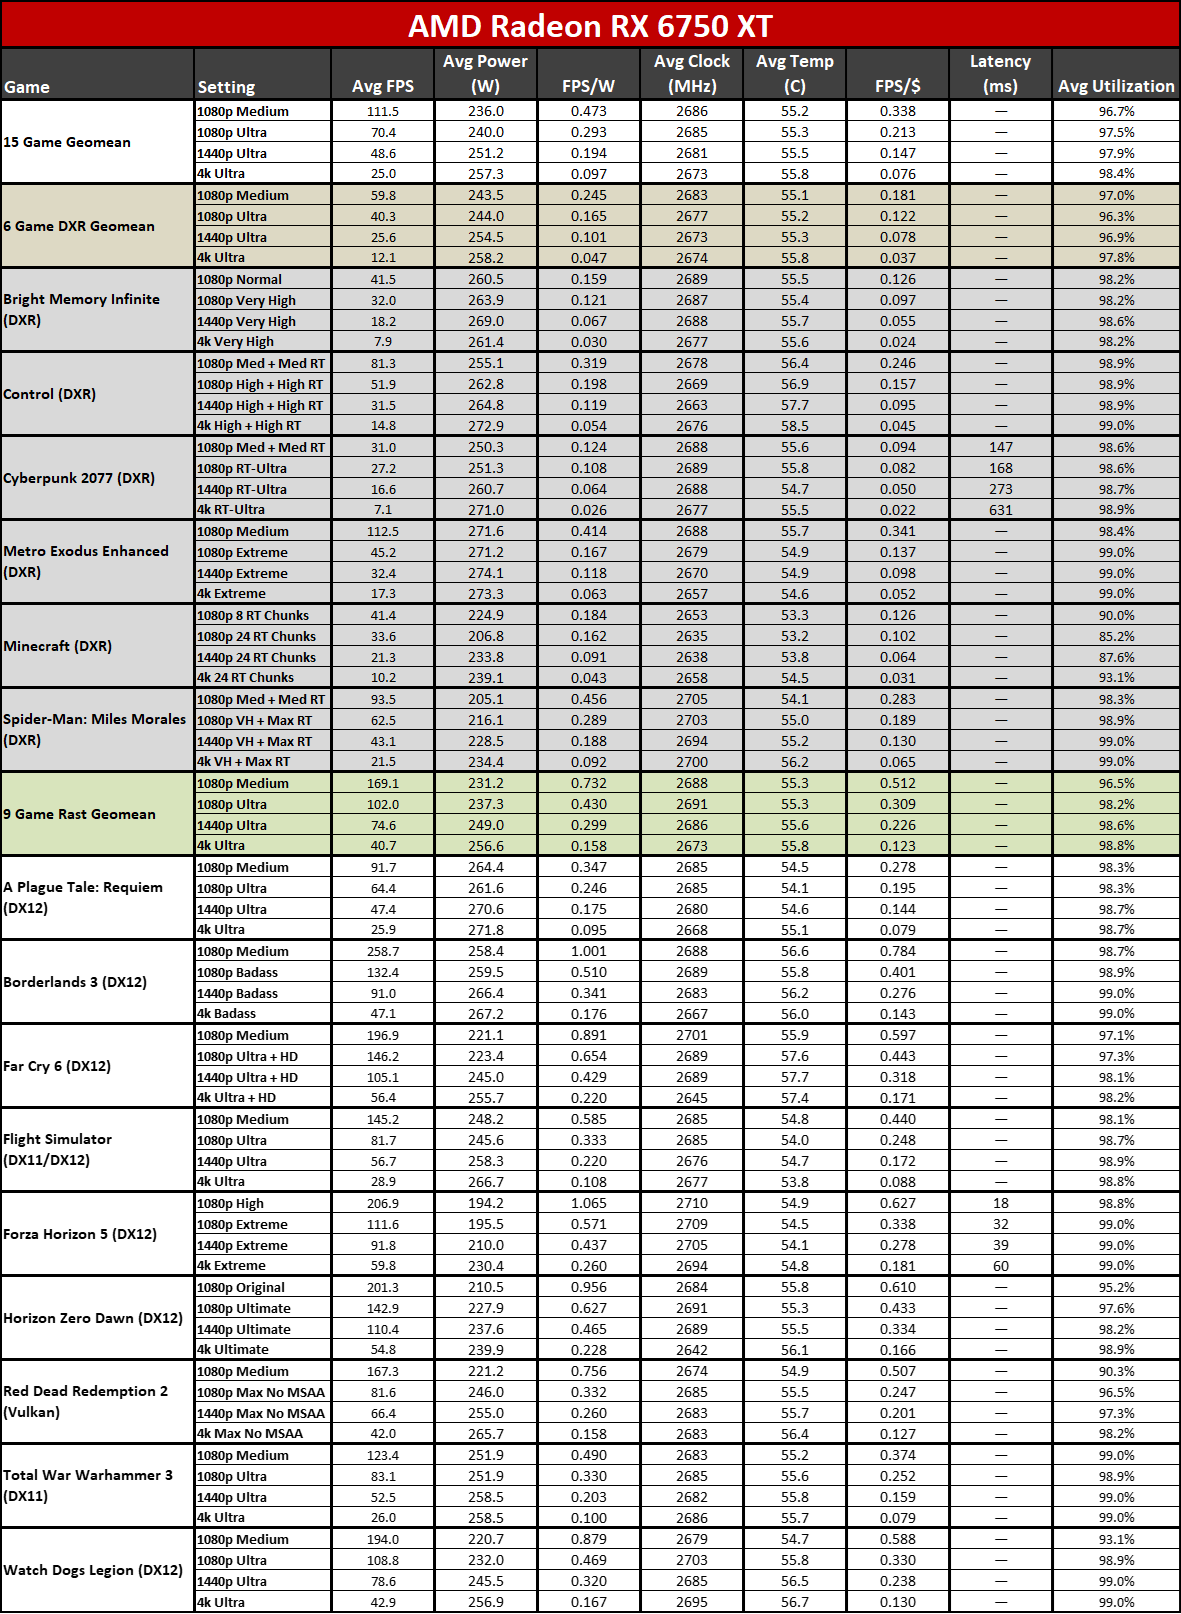
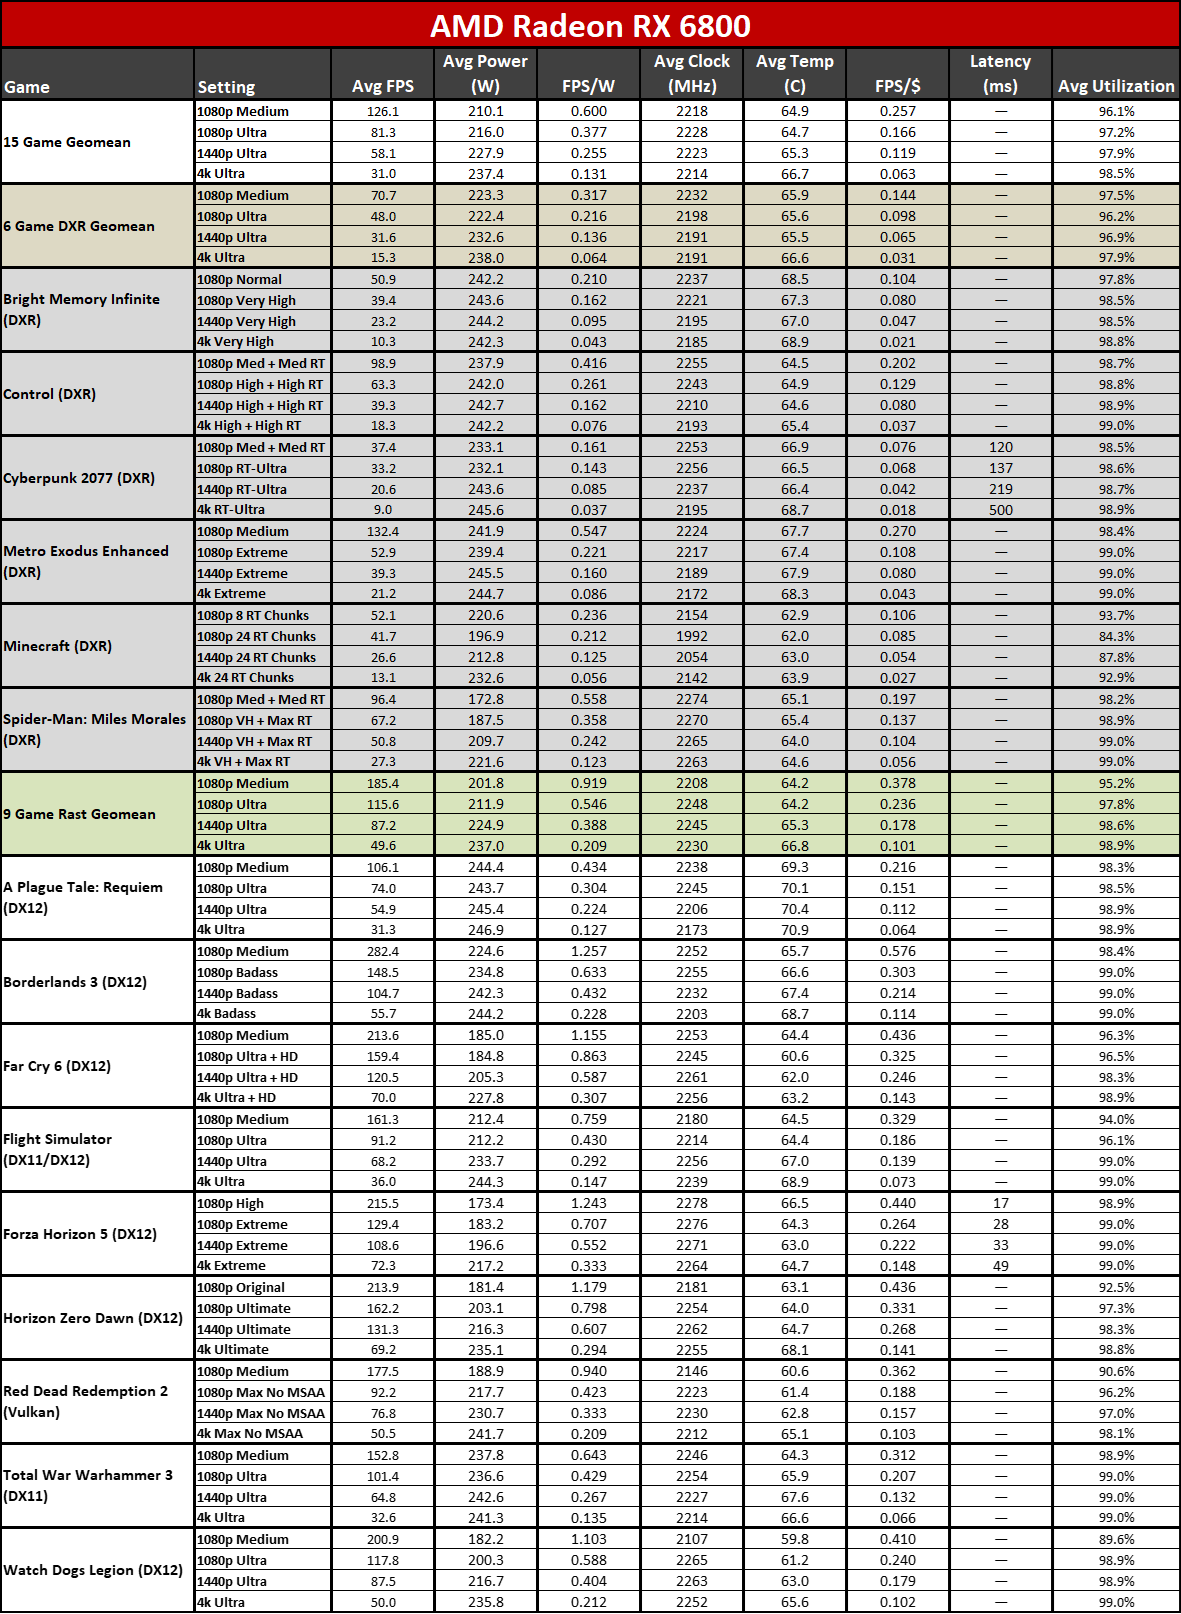
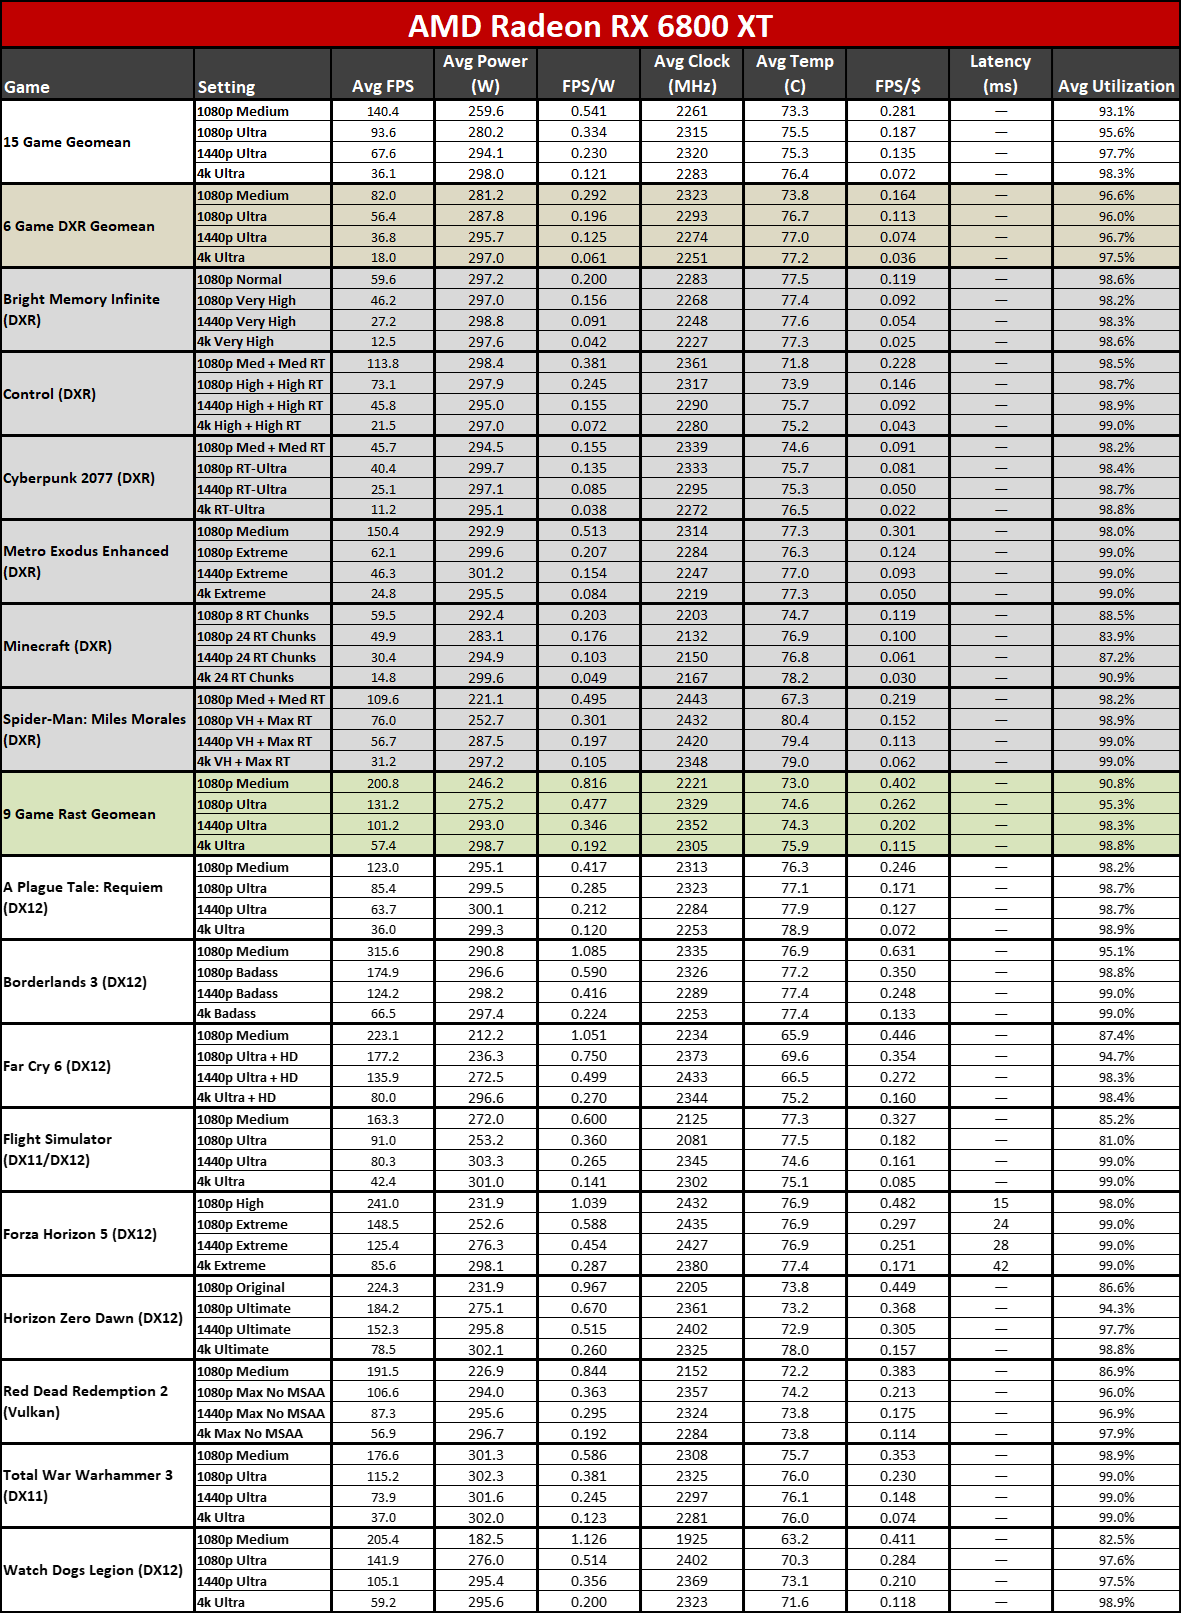
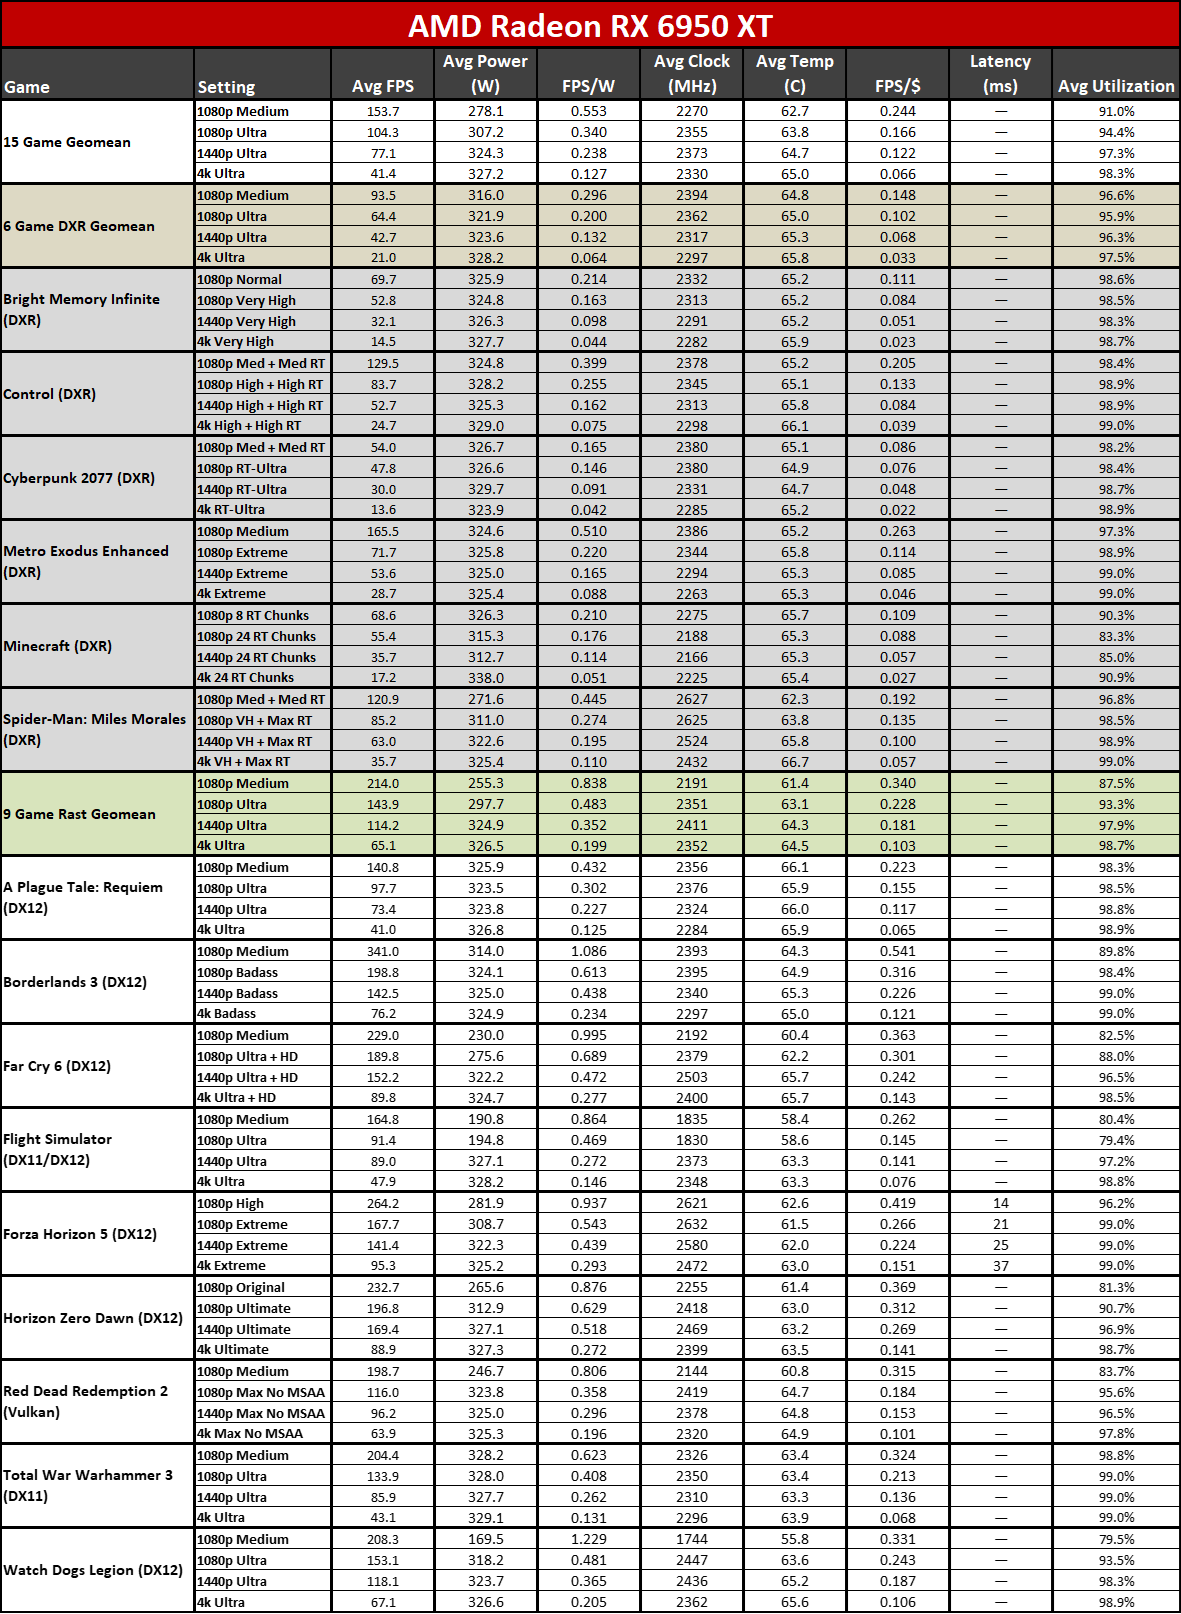
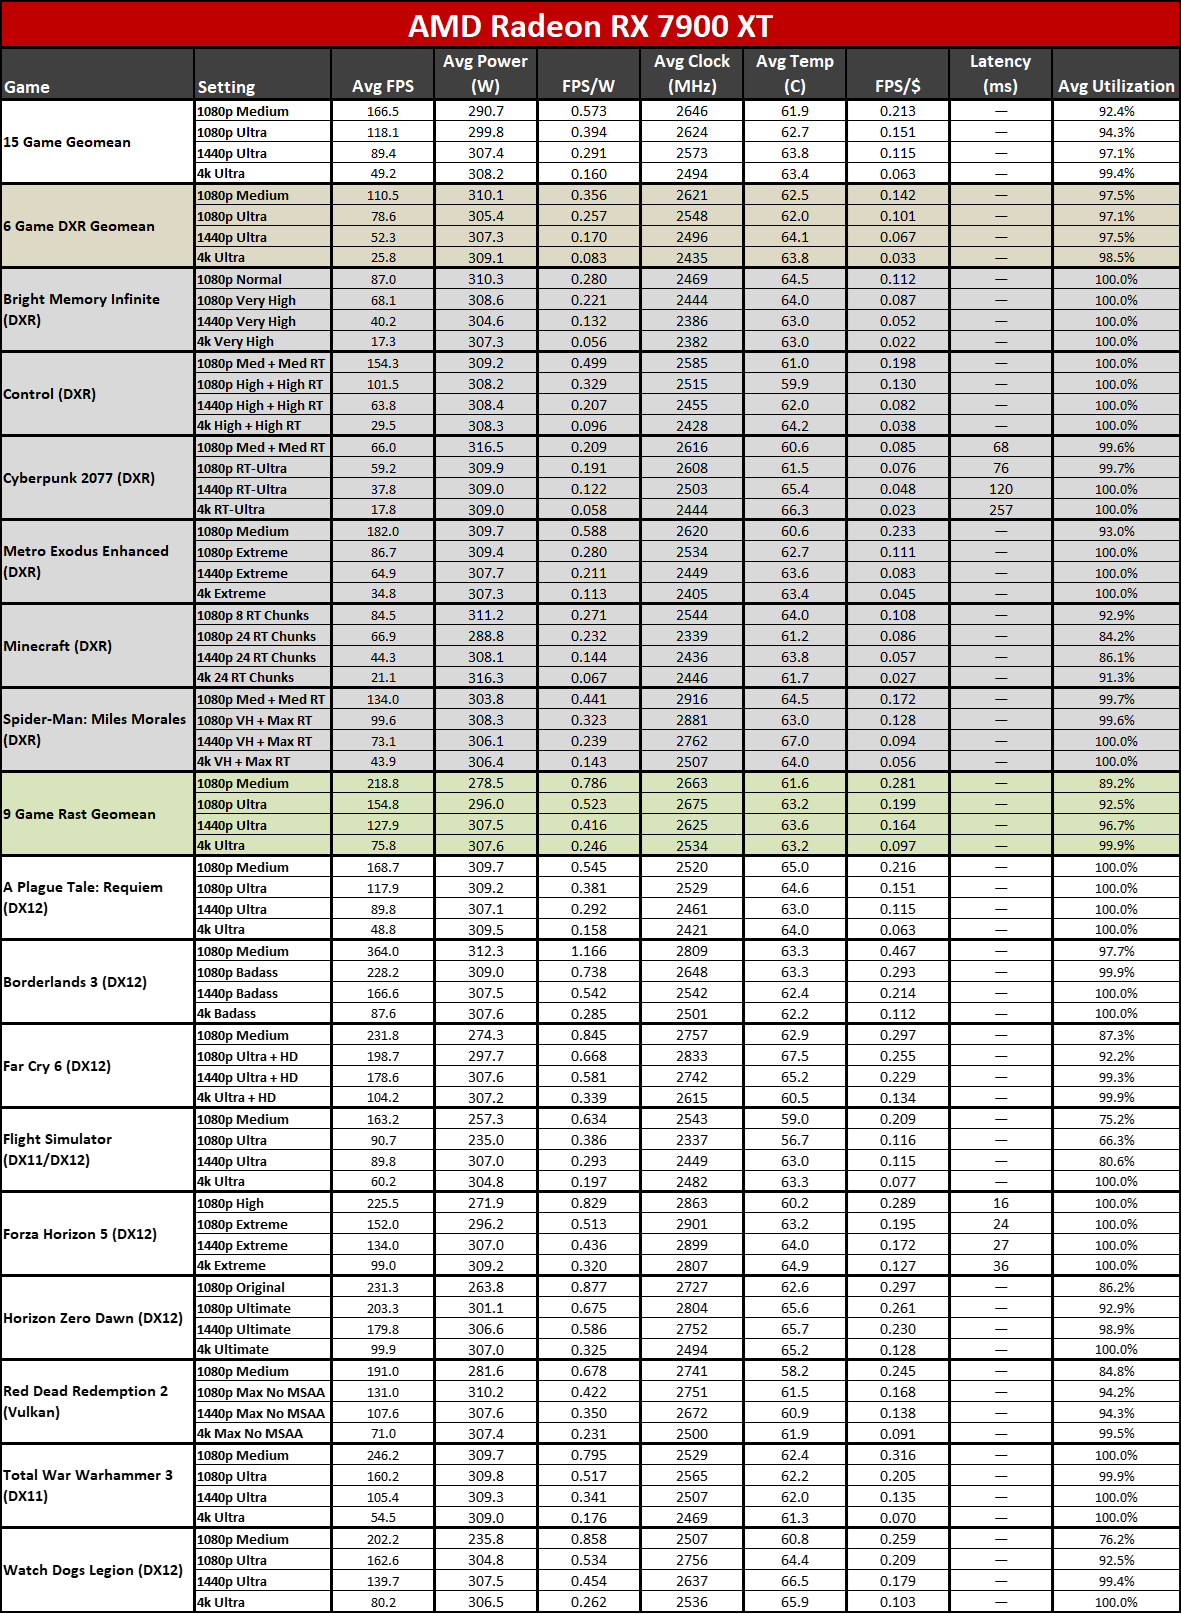
This final gallery of images shows the full performance test suite, along with the above power, clocks, and temperature information. Latency is also provided, at least in some of the games (depending on the GPU and drivers used).
We've calculated efficiency in FPS/W for the various games, plus value in FPS/$ using the best current online prices we could find (usually at Newegg or Amazon, though B&H and Best Buy were also checked). We've summarized those results in the above table (based on 1440p performance and power), sorted by overall value.
It shouldn't be too surprising that the RX 6750 XT is the best overall value out of the GPUs we've tested, followed by the RTX 4060 Ti and RX 6800 XT. Lower prices will go a long way toward making a GPU a better value, and those are the least expensive cards we've included in this review. The Nvidia and PNY RTX 4070 cards are tied for fourth, followed closely by the RX 6950 XT. Note also that the spread in FPS/$ for a lot of the cards is very narrow, with the RX 7900 XT to RTX 4070 all in the 0.111–0.122 range.
Meanwhile, the RTX 4080 ranks as the most efficient GPU we've tested to date, at least for 1440p ultra, with the PNY RTX 4070 coming in second — just edging out the RTX 4070 FE. All of the Nvidia RTX 40-series GPUs have better efficiency than any of the AMD GPUs, with a pretty sizeable drop going from the RTX 4070 Ti (0.367 FPS/W) to the RX 7900 XT (0.281 FPS/W).
- MORE: Best Graphics Cards
- MORE: GPU Benchmarks and Hierarchy
- MORE: All Graphics Content
Get Tom's Hardware's best news and in-depth reviews, straight to your inbox.
Current page: PNY RTX 4070: Power, Clocks, Temps, and Noise
Prev Page PNY RTX 4070: 4K Gaming Performance Next Page PNY RTX 4070: Pure Reference
Jarred Walton is a senior editor at Tom's Hardware focusing on everything GPU. He has been working as a tech journalist since 2004, writing for AnandTech, Maximum PC, and PC Gamer. From the first S3 Virge '3D decelerators' to today's GPUs, Jarred keeps up with all the latest graphics trends and is the one to ask about game performance.
-
Yet another disappointing card, in a series filled with overpriced mediocrities - 4090 being the only exception.Reply
-
atomicWAR Great write up. I expected worse performance from the rumors floating around the web that single 8 pin cards were less performant. Yes its average clocks were a hair less at 2738 vs 2745 but that can be down to the silicon lottery at that point. Still not thrilled with the price with the alloted vram but all in all I am pleasantly surprised the card performs as well as it does.Reply
Yes and no...price and vram yes but as stated performance is decent compared to the 12vhpwr cards. But your not wrong the 4090 is the only real exception this gen. 60 percent performance for a 6% mark up. Seems fair to me...the rest of the stack not so much.valthuer said:Yet another disappointing card, in a series filled with overpriced mediocrities - 4090 being the only exception. -
Reply
Unfortunately, decent performance means little to nothing, when it comes down to just 12 GBs of RAM.atomicWAR said:Yes and no...price and vram yes but as stated performance is decent compared to the 12vhpwr cards.
That's just not a decent amount for today's standards.
Trust me, i've owned a 4070 Ti for approximately 5 months and had the opportunity to run some extensive tests. Bottom line, i expected more.
At 4K max settings, it gets kicked out of games like Far Cry 6 (released on 2021) and Resident Evil 4 (remake), due to insufficient memory.
If that's the kind of performance we get from a Ti, i don't expect a 4070 to be any better.
Also a factor: is it gonna be any good for the games that will be released in these next few months? I don't think so. -
atomicWAR Reply
Agreed. Vram needs a boost.valthuer said:Unfortunately, decent performance means little to nothing, when it comes down to just 12 GBs of RAM.
That's just not a decent amount for today's standards.
Trust me, i've owned a 4070 Ti for approximately 5 months and had the opportunity to run some extensive tests. Bottom line, i expected more.
At 4K max settings, it gets kicked out of games like Far Cry 6 (released on 2021) and Resident Evil 4 (remake), due to insufficient memory.
If that's the kind of performance we get from a Ti, i don't expect a 4070 to be any better.
Also a factor: is it gonna be any good for the games that will be released in these next few months? I don't think so. -
mrv_co I gave up on waiting for a 7700 XT and picked one of these up since it fit nicely in my SFF case without any modification or additional expenditures. It’s a solid step up over my 5700 XT for 1440p gaming. No complaints so far.Reply -
Ricky Zeng Reply
I'm in a very similar position. I got a 6600XT after traded-in my RX580 during the peak of pandemic / mining craze. Now waiting for a 7700/7800 as upgrade but the PNY 4070 dual fan version is really tempting, as it's one of very few that fits my A4 SFF case yet delivers good performance gains.mrv_co said:I gave up on waiting for a 7700 XT and picked one of these up since it fit nicely in my SFF case without any modification or additional expenditures. It’s a solid step up over my 5700 XT for 1440p gaming. No complaints so far.
I reckon tech product (CPU/GPU, or any kind of prime movers) advancement comes in from two aspects: raw power, and efficiency. If we got improvement from both that's real lucky and not happening all the time. But I'm content as long as we got improvement from at least either one. Similar performance as 6800XT with way less power draw and smaller form factor? Count me in. -
Karo96 Reply
But it's not a 4K card.valthuer said:Unfortunately, decent performance means little to nothing, when it comes down to just 12 GBs of RAM.
That's just not a decent amount for today's standards.
Trust me, i've owned a 4070 Ti for approximately 5 months and had the opportunity to run some extensive tests. Bottom line, i expected more.
At 4K max settings, it gets kicked out of games like Far Cry 6 (released on 2021) and Resident Evil 4 (remake), due to insufficient memory.
If that's the kind of performance we get from a Ti, i don't expect a 4070 to be any better.
Also a factor: is it gonna be any good for the games that will be released in these next few months? I don't think so.
We can agree on that it should offer more Vram for future proofing. And the price is a little to steep. But a card that draws less than 200 Watts on a 1440p system is very welcome. -
Winterson Reply
It is also the most powerful graphics card that is a dual slot one. All the more powerful graphics card eat up 3 slots with their width. My alternative to the RTX 470 was to buy a new computer that had space for a 2.2 or wider video card.Admin said:The PNY RTX 4070 delivers similar performance to Nvidia's reference design, but with higher temperatures and noise levels. The only real draw is its use of a single 8-pin power connector.
PNY RTX 4070 Review: Single 8-Pin, No 16-Pin 12VHPWR : Read more
$3,300 for a new computer or $600 for the RTX 4070 was not a difficult choice to make. The new computer would also force my use of Windows 11 and I will buy an Apple computer before giving up my privacy to Microsoft and its minions.
