High-End Graphics Card Roundup
Summary Of Overall Performance
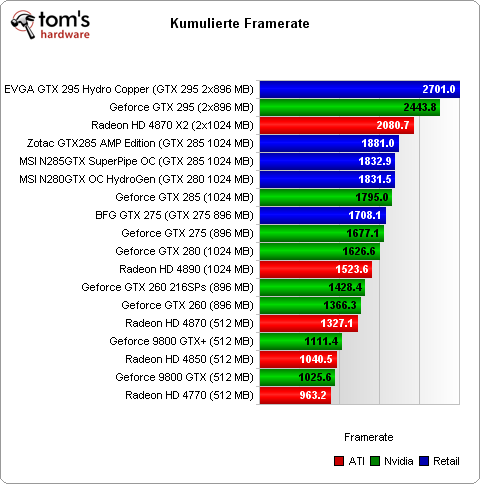
In this overview, we simply total all the results from our benchmarks, while the first value simply represents the sum of all our measurements. This doesn't account for any differences in scale involved and provides a rough-and-ready means for comparison, without weighting any values (which we know you've asked for in the past). All of these values are measured in frames per second, while we omitted the 3DMark06 results.
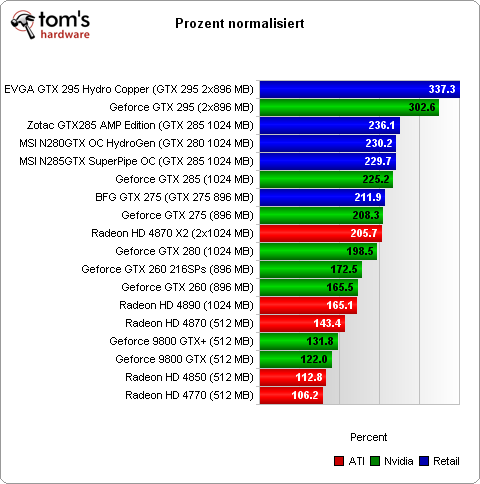
In this second overview, we adjust for differences in scale or "level of difficulty" so that all values may be compared to each other more directly. These adjustments, or weights, create a different sum that has been mathematically adjusted to represent a fair basis for comparison. As a result, this sum provides a more realistic basis for overall comparisons between or among different sets of values. This prevents any single benchmark from overly skewing results because of unusually high frame rates or more resolutions supported. All benchmarks count equally, so using percentage values provides a realistic basis for comparing performance differences among test candidates.
Note: An output value of 100% is calculated from the lowest test values obtained from all test candidates we measured. Because the weakest card isn't always the slowest on every benchmark, this can occasionally produce numbers higher than 100% in our results. It's simply a result of our scaling technique.
Get Tom's Hardware's best news and in-depth reviews, straight to your inbox.
Current page: Summary Of Overall Performance
Prev Page Benchmark Results: 3DMark06 1280x1024 Default Next Page Power Consumption, Noise Levels, And Temperature Readings-
And those HAWX benchmarks look ridiculous. ATi should wipe floor with nvidia with that. Of course you didn't put dx10.1 support on. Bastard...Reply
-
cangelini quarzOnly one ATi card? What happened to all those OC'd 4890s?Reply
These are the same boards that were included in the recent charts update, and are largely contingent on what vendors submit for evaluation. We have a review upcoming comparing Sapphire's new 1 GHz Radeon HD 4890 versus the stock 4890. It'll be up in the next couple of weeks, though. -
ohim Am i the only one that find this article akward since looking at the tests done on Ati cards on The Last Remnant game makes me wonder what went wrong ... i mean it`s UT3 engine ... why so low performance ?Reply -
curnel_D Ugh, please tell me that The Last Remnant hasnt been added to the benchmark suite.Reply
And I'm not exactly sure why the writer decided to bench on Endwar instead of World In Conflict. Why is that exactly?
And despite Quarz2's apparent fanboism, I think HAWX would have been better benched under 10.1 for the ATI cards, and used the highest stable settings instead of dropping off to DX9. -
anamaniac The EVGA 295 is the stuff gods game with.Reply
I would love that card. I would have to replace my whole system to work it properly however.
I want $1500 now... i7 920 (why get better? They all seem to be godly overclockers) and EVGA 295.
How about a test suit of the EVGA GTX 295 in crossfire for a quad-gpu configuration? I know there's driver issues, but it would be fun to see what it could do regardless. Along with seeing how far Toms can OC the EVGA GTX 295.
Actually... Toms just needs to do a new system building recommendation roundup. I find them useful personally, and would have used it myself had my cash source had not lost his job... -
Weird test:Reply
1) Where are the overclocking results?
2) Bad choice for benchmarks: Too many old DX9 based graphic engines (FEAR 2, Fallout 3, Left4Dead with >100FPS) or Endwar which is limited to 30FPS. Where is Crysis?
3) 1900x1200 as highest resolution for high-end cards? -
EQPlayer Seems that the cumulative benchmark graphs are going to be a bit skewed if The Last Remnant results are included in there... it's fairly obvious something odd is going on looking at the numbers for that game.Reply -
armistitiu Worst article in a long time. Why compare how old games perform on NVIDIA's high end graphic cards? Don't get me wrong i like them but where's all the Atomic stuff from Saphire, Asus and XFX had some good stuff from ATI too. So what.. you just took the reference cards from ATI and tested them? :| That is just wrong.Reply -
pulasky WOW what a piece of s********** is this """"""review"""""" Noobidia pay good in this days.Reply

