ATI Radeon HD 4850: Smarter by Design?
Power Consumption
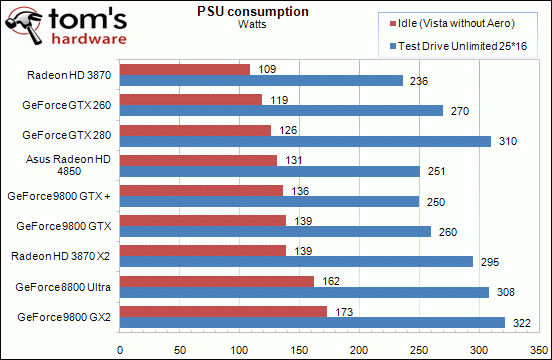
With 956 million transistors compared to 666 million for the RV670 (Radeon HD 3850/70) — both engraved at 55 nm — let’s see the variations in power consumption at the power supply (which includes, just as a reminder, the power consumption of the entire computer and the 20% lost by the power supply).

Consumption at idle has increased significantly, which is not a pleasant surprise – a total increase of 22 W (approximately 18 W attributable to the graphics card) for the same usage level (more or less nil), which is pretty disappointing, especially since it puts the 4850 back behind the GeForce GTX 200 for consumption at idle, which is a highly appreciated strong point of existing AMD cards. At idle, the frequencies of the 4850 drop from 625 MHz (GPU) and 1000 MHz (memory) to 500 MHz and 750 MHz, which is a much less aggressive throttle-back than on the GT200.
On the other hand, under load, running Test Drive Unlimited, the increase compared to the 3870 was no more than 12 W for a performance that was 26% better in this specific case, which is very good (and that’s despite the slight overclocking of the Asus test board, remember). Note also that the consumption peak we measured for the card (still running Fillrate Tester) was only 270 W.
But admittedly, again the 9800 GTX + did as well, and that cancels out AMD’s advantage. Note that the G92’s change to a 55 µm process does result in a slight reduction in power consumption, both at idle and under load (up to 8 W), which is predictable given the very slight increase in frequency. We should also underline the fact that in this specific test case (Test Drive Unlimited at 2560x1600), the 9800 GTX +’s performance/watts ratio was 11% better than the HD 4850’s.
Get Tom's Hardware's best news and in-depth reviews, straight to your inbox.
-
Neog2 Wow $200 in Best Buy for a HD 4850,Reply
$450 in Best Buy for a GTX 260.
And the 4850 is pretty close to the 280.
Ouu the 4870 is going to give Nvidia a run for there money
for the first time in a while. -
Prodromaki Oced Asus and 4850 instead of 4870 + too many games based on engines favoring nVidia...Reply
P.S. +1000 -> 2222 -
For Mass Effect the Engine limits the Maximum framerate to 62FPS. You can change this in the BIOENGINE.INI file (in the Documents\BioWare\Mass Effect\Config\ folder on Vista) by changing the value:Reply
MaxSmoothedFrameRate=62 in the Engine.GameEngine section -
puterpoweruser I can't believe it took nVidia coming out with a new card again to have tom's make a review finally of the 4850.Reply
"it was unavailable due to the sloppy handling of this launch"
Seriously? AMD can't control if their retail partners screwed the pooch on the release date, because they were so anxious to get people this great product. They made sure the product was readily available well before the launch date.
They should be praised for not having a paper launch, not told that it was a sloppy launch, very poor form saying that.
Hell i went to best buy and bought 2 4850's on sunday, when the cards weren't even supposed to be available yet, the guy told me "they have been in stock for over a month in the back, they aren't supposed to be available yet but i can get two for you." Were the AMD police supposed to come and smack best buy on it's hand and keep me from giving them profits?
Sorry if i'm ranting, just put the blame where it belongs. -
Malovane No offense, Fedy Abi-Chahla and Florian Charpentier, and thanks for the hard work, but I think the article should be revised a bit. First off, this should be a review of graphics cards.. not a burned out overclocked Asus motherboard. If you attribute your 4850 test crashing due to your motherboard.. why throw in results of 0 across the board for the 4850? You just corrupted your data and made the final fps averages meaningless, which is the thing people were generally interested in. Secondly, why in the world are you including tests that don't fit the definition of "playable" on any card in your test lineup (Crysis 2560x1600). It just throws off averages, as people aren't going to run this game at 7fps! If there's no card in the lineup that gets close to 30fps in a certain test, just move on! Save it for the quad crossfire or triple sli tests or something. You're giving high weights to resolutions that only a fraction of a percentage point of dedicated gamers can utilize (and those wouldn't bother with a single GPU). Lastly, please get those annoying gigantonormous screenies out of the review. It makes the review look like it was done by kindergarteners.Reply -
puterpoweruser I didn't finish reading the whole article yet but was the driver hotfix and the current 8.6 driver applied to the 4850?? It improved performance and stability greatly as i saw, it make the actual clock speed the card is set it run nicely and gives it great overhead to overclock through the CCCReply -
draxssab Who wants the Radeon 4800 full revew? (including the 4870, that do better than the GTX 280 in some games!)Reply
http://www.hardware.fr/articles/725-8/dossier-amd-radeon-hd-4870-4850.html
In french, but the graphs talk by themselves. Ho, and if you want a short translation = impressive and incredibly more efficient than Nvidia (if you compare the size of the GPU, yes it's A LOT more efficient) -
spaztic7 These reviews are getting better! Although I have seen many benchmarks and tests of the 4850 before this, I still love seeing how the 48x0 line is doing against the green machine! Anandtech.com has a kill 4870 review!Reply