SanDisk Extreme II SSD Review: Striking At The Heavy-Hitters
SanDisk is looking for a rise to prominence in the SSD segment with a new Marvell 88SS9187-based drive. The Extreme II packs 19 nm Toggle-mode NAND (from SanDisk, naturally), specialized firmware, and intriguing performance potential. How does it compare?
Results: Tom's Storage Bench
Storage Bench v1.0 (Background Info)
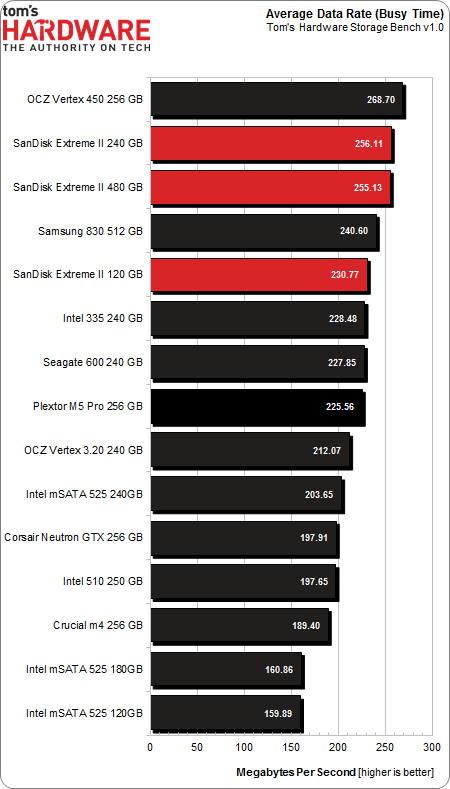
Our Storage Bench incorporates all of the I/O from a trace recorded over two weeks. The process of replaying this sequence to capture performance gives us a bunch of numbers that aren't really intuitive at first glance. Most idle time gets expunged, leaving only the time that each benchmarked drive was actually busy working on host commands. So, by taking the ratio of that busy time and the the amount of data exchanged during the trace, we arrive at an average data rate (in MB/s) metric we can use to compare drives.
It's not quite a perfect system. The original trace captures the TRIM command in transit, but since the trace is played on a drive without a file system, TRIM wouldn't work even if it were sent during the trace replay (which, sadly, it isn't). Still, trace testing is a great way to capture periods of actual storage activity, a great companion to synthetic testing like Iometer.
Incompressible Data and Storage Bench v1.0
Also worth noting is the fact that our trace testing pushes incompressible data through the system's buffers to the drive getting benchmarked. So, when the trace replay plays back write activity, it's writing largely incompressible data. If we run our storage bench on a SandForce-based SSD, we can monitor the SMART attributes for a bit more insight.
| Mushkin Chronos Deluxe 120 GBSMART Attributes | RAW Value Increase |
|---|---|
| #242 Host Reads (in GB) | 84 GB |
| #241 Host Writes (in GB) | 142 GB |
| #233 Compressed NAND Writes (in GB) | 149 GB |
Host reads are greatly outstripped by host writes to be sure. That's all baked into the trace. But with SandForce's inline deduplication/compression, you'd expect that the amount of information written to flash would be less than the host writes (unless the data is mostly incompressible, of course). For every 1 GB the host asked to be written, Mushkin's drive is forced to write 1.05 GB.
If our trace replay was just writing easy-to-compress zeros out of the buffer, we'd see writes to NAND as a fraction of host writes. This puts the tested drives on a more equal footing, regardless of the controller's ability to compress data on the fly.
Get Tom's Hardware's best news and in-depth reviews, straight to your inbox.
Average Data Rate
The Storage Bench trace generates more than 140 GB worth of writes during testing. Obviously, this tends to penalize drives smaller than 180 GB and reward those with more than 256 GB of capacity. Further, the average data rate is based on total busy time. Divide the amount of data read and written by the busy time, and you have a MB/s metric. Busy time is merely time in which the drive was performing an operation.
Most of the time, host I/O activity is a constant, low-level background drone, punctuated by spikes of more demanding I/O at higher queue depths. The average data rate is heavily weighted in favor of light I/O activity, with only a small portion reflecting higher demand.
SanDisk's Marvell-powered drives show up at the top of our chart, though they fall short of first place.
The 120 GB version lands in fifth place, but that's a super-impressive showing for a modestly-sized SSD. It holds 70 MB/s over the 120 GB Intel SSD 525.
Service Times and Standard Deviation
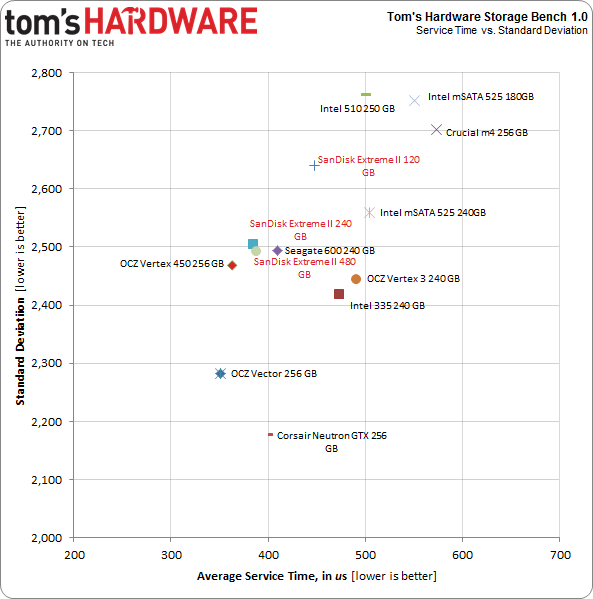
There is a wealth of information we can collect with Tom's Storage Bench above and beyond the average data rate. Mean (average) service times show what responsiveness is like on an average I/O during the trace. It would be difficult to plot the 10 million I/Os that make up our test, so looking at the average time to service an I/O makes more sense. We can also plot the standard deviation against mean service time. That way, drives with quicker and more consistent service plot toward the origin (lower numbers are better here).
More important, these service time metrics are heavily weighted in favor of intense drive activity, where higher queue depths are observed. Busy time is simply the time a tested disk was performing any host-initiated activity. Consider a period of one second during which five I/O operations are simultaneously executed. If each operation took one second, five seconds of service time would accrue during that period, while only one second of busy time is incurred.
Service time is arguably a more important metric, since periods of rapid activity are more difficult for slower SSDs to accommodate.
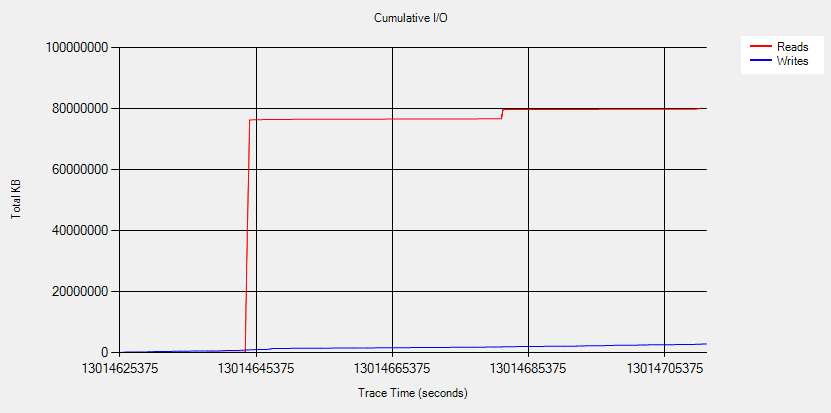
The above screen shot shows the cumulative I/O of our trace. Writes are consistent, picking up at a slow rate during this time slice. Reads spike quickly over a short period of time. That initial spike, in red, is a demanding period during which large amounts of data are transferred rapidly.
The SanDisk SSDs are quite the fastest, but they're not far behind. OCZ's Vertex 450 and Vector serve up I/O more quickly, as the two larger Extreme IIs show up in third and fourth place. The 120 GB variant is nestled between Seagate's 600 and the SSD 335s.
Current page: Results: Tom's Storage Bench
Prev Page Results: Random Performance Next Page Results: PCMark Vantage And PCMark 7-
Someone Somewhere Where's the 840/840 Pro?Reply
Also, you appear to have put one of the labels back on the wrong way round. -
boulbox I have always been a fan of Sandisk SSDs, can't wait until to try this out in someone else's build as they usually sell their products that is very acceptable for budgets.Reply -
slomo4sho I am also curious about the selection of the comparative models. Having the Extreme (not II) in the charts for comparison between the two generations would have been a welcomed addition along with the inclusion of the 840 series.Reply -
flong777 I know a lot of people have already pointed this out but can't Tom's Hardware afford a damn 256 GB 840 Pro? I mean come on, it is the fastest SSD on the planet right now.Reply -
raidtarded Seriously, what is the point of this article? The fastest car in the world is as Yugo if you dont test against a Lamborghini.Reply -
teh_gerbil Why are there 2 of your most recent SSD reviews lack the Samsung 840/Pro? Are you being paid by the respective companies to avoid using them, as for both SSD's, as per other reviews I have read, the 840 Pro cr@ps all over both of them, but due to your lack of them, they're both top of your benchmarks! Very very bad benchmarking.Reply
http://www.tomshardware.com/reviews/vertex-450-256gb-review,3517.html -
merikafyeah Want an 840 Pro comparison and far more in-depth review?Reply
See here: http://www.anandtech.com/show/7006/sandisk-extreme-ii-review-480gb
It's Anand's new favorite SSD, and based on the results, I'm inclined to agree.
It's peak performance is right up there with the 840 Pro, but what's really extreme is the drive's consistency. It's performance when the drive is close to full is unmatched.
There are no high peaks accompanied by low valleys in performance when it comes to the Extreme II. It's pretty much smooth and fast sailing all the time, which in my book, places the Extreme II a step above the 840 Pro. The 840 Pro would have to be at least $30 cheaper than the Extreme II for me to even consider it over the Extreme II.
-
JPNpower Why is the 840 Pro the fastest SSD on the planet? It has its share of drawbacks, and is slower than the OCZ Vector, and the Plextor M5 Pro Xtreme on many benchmarks. Don't make broad statemets that aren't always true.Reply


