Sapphire Pulse Radeon RX 5700 XT Review: Cooler and Quieter Than AMD’s Reference Card
Why you can trust Tom's Hardware
Power Consumption
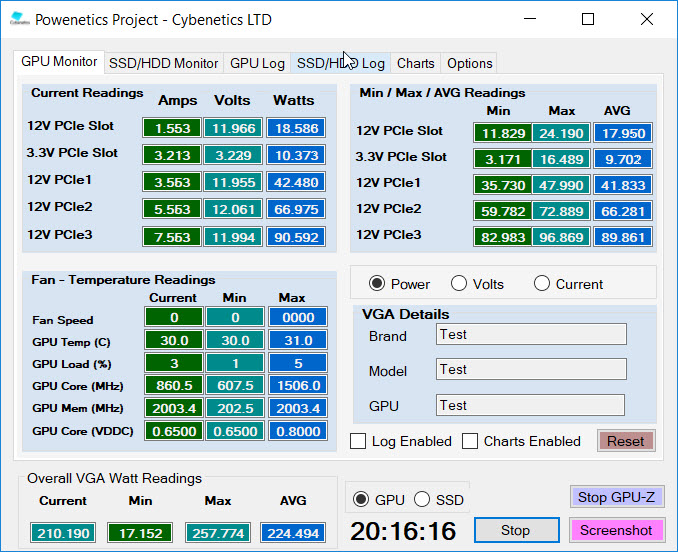
The US Tom’s Hardware graphics lab continues utilizing Cybenetics’ Powenetics hardware/software solution for accurately measuring power consumption.
Powenetics, In Depth
For a closer look at our U.S. lab’s power consumption measurement platform, check out Powenetics: A Better Way To Measure Power Draw for CPUs, GPUs & Storage.
In brief, Powenetics utilizes Tinkerforge Master Bricks, to which Voltage/Current bricklets are attached. The bricklets are installed between the load and power supply, and they monitor consumption through each of the modified PSU’s auxiliary power connectors and through the PCIe slot by way of a PCIe riser. Custom software logs the readings, allowing us to dial in a sampling rate, pull that data into Excel, and very accurately chart everything from average power across a benchmark run to instantaneous spikes.
The software is set up to log the power consumption of graphics cards, storage devices, and CPUs. However, we’re only using the bricklets relevant to graphics card testing. Sapphire's Pulse Radeon RX 5700 XT gets all of its power from the PCIe slot, one eight-pin auxiliary connector, and one six-pin connector.
Idle
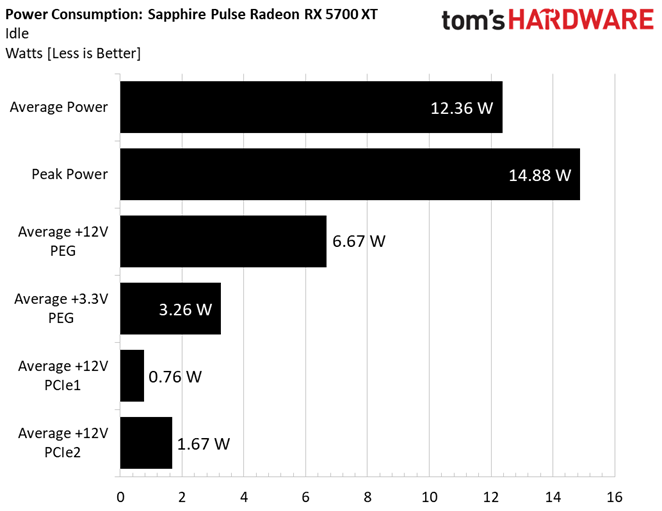
Sapphire’s idle power consumption is just a hair higher than the AMD reference Radeon RX 5700 XT. Readings from the PCIe slot’s +12V rail are slightly elevated. The same goes for the eight-pin power connector. Meanwhile, the PCIe slot’s +3.3V rail and the six-pin auxiliary connector’s averages drop.
Gaming
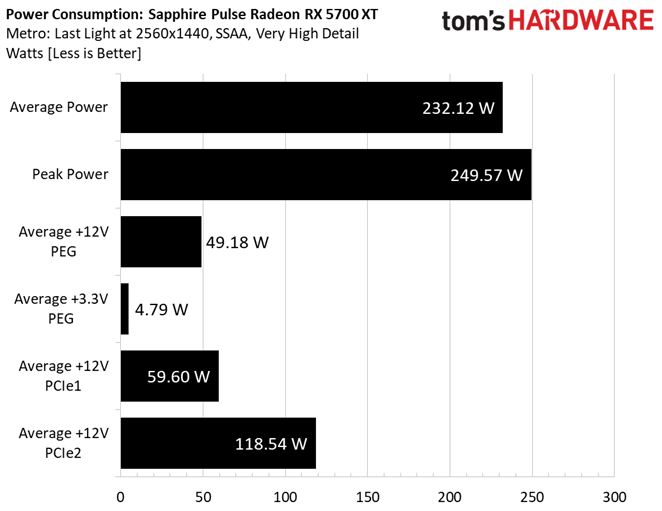
More aggressive clock rates compared to AMD’s reference Radeon RX 5700 XT result in slightly higher power consumption from Sapphire’s Pulse model. The difference isn’t huge, though—you’re looking at roughly 15W on average through our Metro benchmark sequence. The delta between our peak readings is even smaller.
Get Tom's Hardware's best news and in-depth reviews, straight to your inbox.
More than half of what we see as an increase comes from the PCIe slot’s +12V rail. The rest is evenly divided between the auxiliary power connectors.
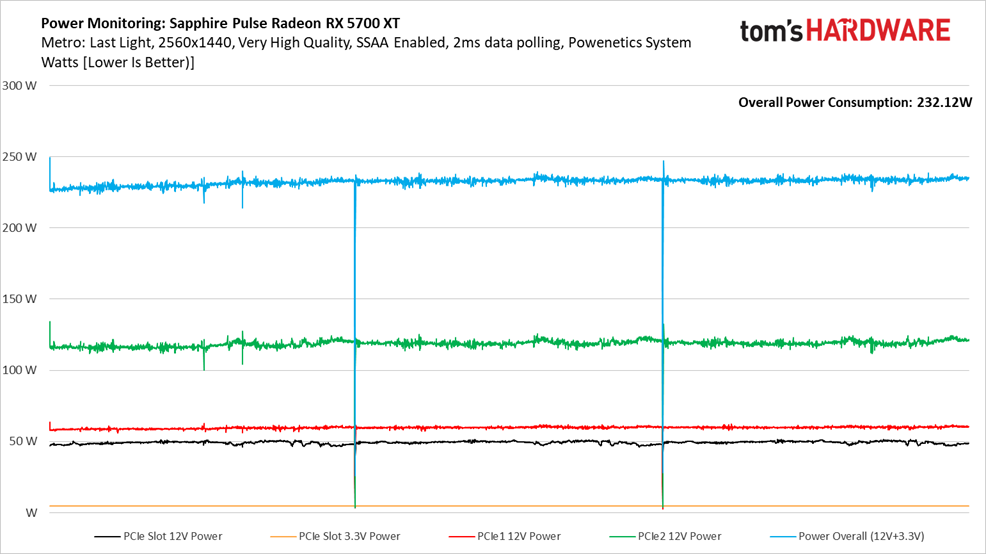
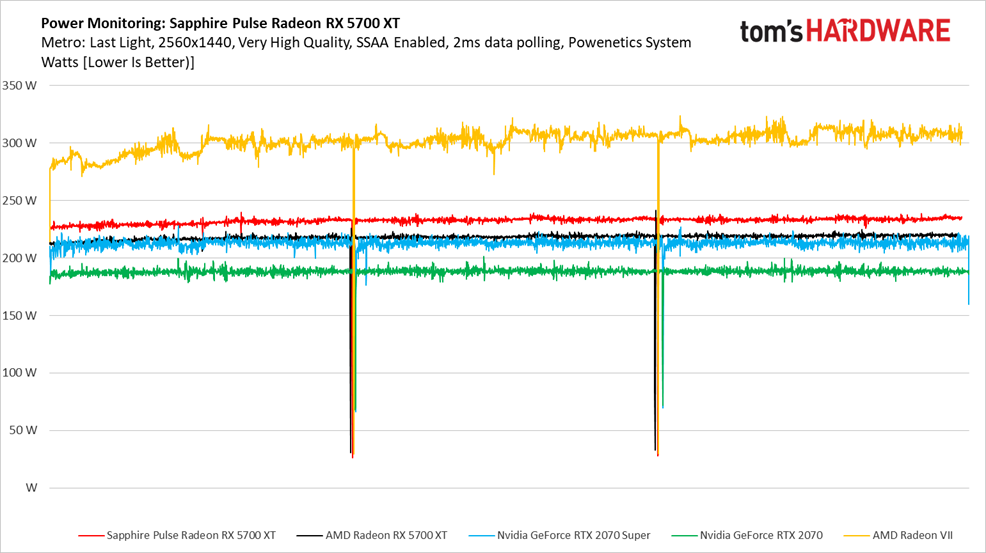
Illustrating power over time yields a handful of smooth lines across three runs of Metro, with a dip between each pass.
Sapphire’s Pulse Radeon RX 5700 XT is in red, while AMD’s reference Radeon RX 5700 XT is in black. Interestingly, the subtle difference between them is larger than comparing the AMD version to Nvidia’s GeForce RTX 2070 Super, a card that generally outperforms both Radeon RX 5700 XTs. Despite its utilization of GPUs manufactured at 12nm, Nvidia maintains an efficiency advantage over the 7nm Navi chips.
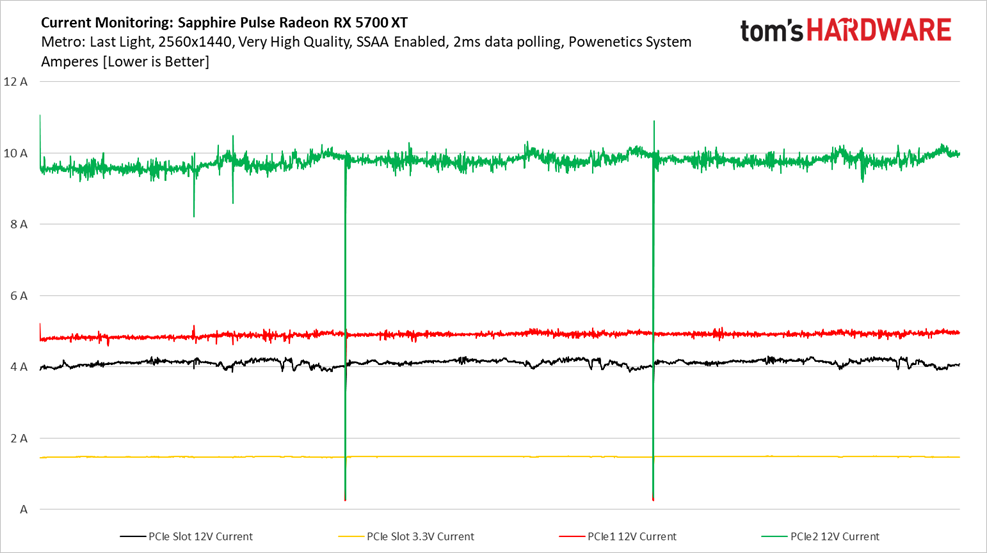
Sapphire wisely keeps current draw over the PCIe slot’s +12V rail to roughly 4A. That’s well below the PCI-SIG’s 5.5A ceiling.
FurMark
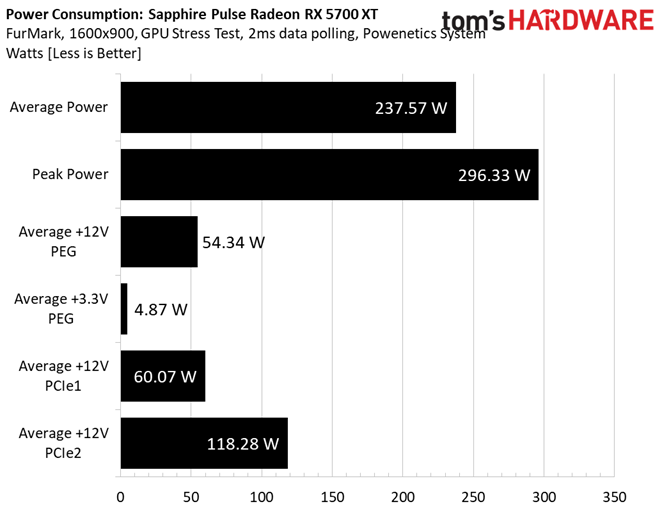
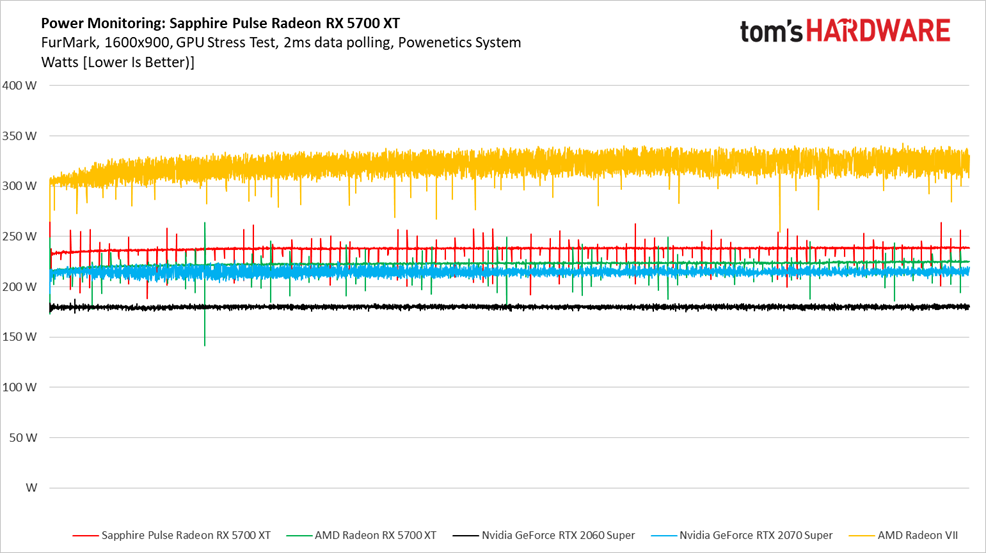
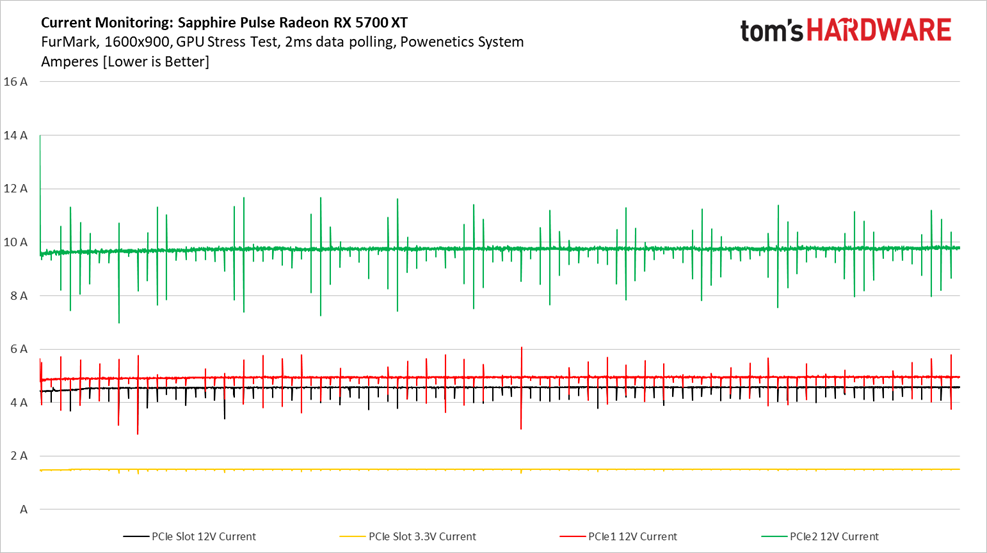
Average power consumption increases slightly under FurMark compared to a gaming workload. However, the difference between Sapphire’s Pulse Radeon RX 5700 XT and AMD’s reference card remains 15W. Again, most of that is attributable to a >10W jump over the PCIe slot’s +12V rail.
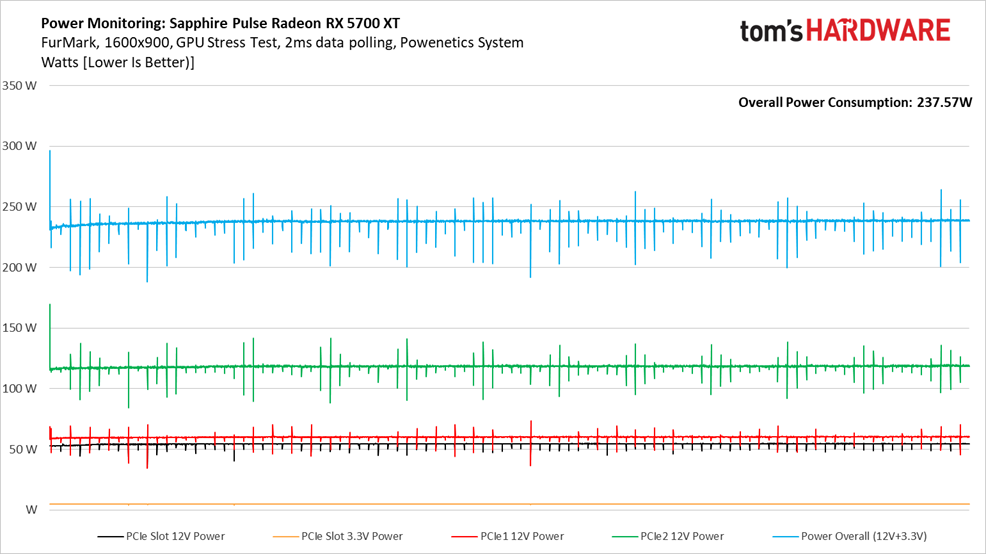
Given Sapphire’s purported use of AMD's reference Radeon RX 5700 XT design, we’re not surprised to see the same sort of line chart under FurMark that we published in our Radeon RX 5700 XT launch coverage. At that time, AMD issued the following statement to us:
“The behavior you are seeing under a purely synthetic power virus (FurMark) workload is within our specified product parameters.
There are many different sensors and related algorithms that work to keep the GPU working within its prescribed product limits; the behavior depicted and described suggests that specific workload segments in FurMark are periodically causing a rapid ramp in temperature. When the algorithms respond, there is an intentional, designed-in delay which results in the observed ‘spike’.
The absolute values displayed are still within spec, showing that the electrical and thermal protection mechanisms built in to the RX 5700 series are working per design.”
We’ll see on the next page that Sapphire’s Performance BIOS maintains a clock rate advantage over AMD’s reference card, suggesting that the power measurements we see in FurMark aren’t negatively affecting frequency.
The Sapphire and AMD cards exhibit the same spiky power behavior under FurMark. This view also shows us the Pulse Radeon RX 5700 XT’s 15W-higher consumption compared to AMD’s reference Radeon RX 5700 XT.
Current draw over the PCIe slot’s +12V rail is slightly higher under FurMark than it was in Metro. But notice that our readings never spike up, whereas they do over both auxiliary power connectors.
MORE: Best Graphics Cards
MORE: Desktop GPU Performance Hierarchy Table
MORE: All Graphics Content
Current page: Power Consumption
Prev Page Performance Results: 3840 x 2160 Next Page Fan Speeds, Clock Rates, and Temperatures-
hannibal What was expected. Cooler, quiter version. Interesting to see what other vendors do and what prise.Reply -
Gillerer When employing upscaling+sharpening in games, ideally you don't want to set lower resolution, but use an in-game resolution scale under 100% instead. That way the UI elements and texts will still be rendered at the native monitor resolution and be perfectly crisp - those are where you're likely to first notice any fuzziness.Reply -
2Be_or_Not2Be Hmm... the review keeps on saying this board is "quieter" than the reference version, yet there are no Noise Level tests that show you how quiet it is (or isn't).Reply -
Blytz Ok, so if the pricing for me is generally that the AIB boards at the same price to 5% cheaper than the 2060 supers, for a card that nips at the heels of the 2070 (and sometimes the 2070 super depending on the game) I'd assume this is a no brainer for meReply -
iam2thecrowe Not sure if I'm blind, but I cant see anywhere in the article weather or not you test your gfx cards in a case? or in open air? In my experience this type of cooler can be problematic in some cases, particularly smaller cases.Reply -
AeroWB Chris, thanks for the great review. The amount of information packed in the review is amazing. I really like the inclusion of the Frames per Second by Percentile graphs. Unfortunately the graphs are a little small and the colors are sometimes so close its very hard to see what is what.Reply
Also I want to dare you to change the order of the cards in the graphs based on the 99 percentile values. The 99 percentile scores are more important to determine the experience than the old average FPS measurement.
For power consumption I'd like a graph with the power consumption from Metro with the other cards in the review, now I have to go to multiple reviews to compare.
Futher the review is lacking noise measurements while there are fan RPM, clock rate and temperature measurements. As a user I am more interested in noise than those other 3, as noise I can compare top other cards the other 3 measurements are less interesting and sometimes even incomparable.
In the conclusions you mention that its a good card but though its 10% faster than a GTX2060 Super its higher power consumption and lack of ray tracing make it a hard choice. As a user I am looking at performance per dollar first and performance per watt second, and I think that holds for most user. Now while ray tracing is nice feature it cannot be used in the majority of games and especially in this segment enabling ray tracing is a tough trade off as you probably will see more stuttering (or you will need to lower other graphics settings, can that a be good trade ever?)
So my conclusion would be reversed. The RX5700XT is the default choice in this price and only if you need to limit power consumption (for example if your case has bad cooling) or if you'd really want to do ray tracing the GTX2060 becomes the better option. Also the Sapphire RX5700XT is 10% faster on average over the average FPS of the 13 games. If we look at 99 percentile its 12% faster, again not much but still a good bit. Also the drivers are less matured so you could a expect a little more improvement from that side too.
Its not such an easy the choice as the Ryzen 3000 is compared to the Core i5/7 at this moment where the former is better in almost all aspects, but I think the RX5700XT is the better choice for most gamers shopping around this price. -
King_V Given how, with Sapphire's previous cards, the Pulse was the "good" cooler, and the Nitro/Nitro+ had the "even better" cooler, I'd be curious to see how their Nitro cooling solution does, when they release one for the 5700XT.Reply -
spigias ReplyAeroWB said:Chris, thanks for the great review. The amount of information packed in the review is amazing. I really like the inclusion of the Frames per Second by Percentile graphs. Unfortunately the graphs are a little small and the colors are sometimes so close its very hard to see what is what.
Also I want to dare you to change the order of the cards in the graphs based on the 99 percentile values. The 99 percentile scores are more important to determine the experience than the old average FPS measurement.
For power consumption I'd like a graph with the power consumption from Metro with the other cards in the review, now I have to go to multiple reviews to compare.
Futher the review is lacking noise measurements while there are fan RPM, clock rate and temperature measurements. As a user I am more interested in noise than those other 3, as noise I can compare top other cards the other 3 measurements are less interesting and sometimes even incomparable.
In the conclusions you mention that its a good card but though its 10% faster than a GTX2060 Super its higher power consumption and lack of ray tracing make it a hard choice. As a user I am looking at performance per dollar first and performance per watt second, and I think that holds for most user. Now while ray tracing is nice feature it cannot be used in the majority of games and especially in this segment enabling ray tracing is a tough trade off as you probably will see more stuttering (or you will need to lower other graphics settings, can that a be good trade ever?)
So my conclusion would be reversed. The RX5700XT is the default choice in this price and only if you need to limit power consumption (for example if your case has bad cooling) or if you'd really want to do ray tracing the GTX2060 becomes the better option. Also the Sapphire RX5700XT is 10% faster on average over the average FPS of the 13 games. If we look at 99 percentile its 12% faster, again not much but still a good bit. Also the drivers are less matured so you could a expect a little more improvement from that side too.
Its not such an easy the choice as the Ryzen 3000 is compared to the Core i5/7 at this moment where the former is better in almost all aspects, but I think the RX5700XT is the better choice for most gamers shopping around this price.
Great comment, thank you AeroWB, your conclusion is much better than Chris.(opinions respected of course) . Had to visit other tech sites for a comparisons too. Makes me wonder what happened to this site. -
Minnefornian Did they say when will the TriXX software be available for the Pulse? The current version crashes upon launch for me.Reply
