Why you can trust Tom's Hardware
Our power, clocks, and temperature testing now utilizes the same test suite as our gaming benchmarks, as the PCAT v2 hardware and FrameView software lets us collect this data alongside frametimes. We're also using our updated Core i9-13900K platform, so we're less likely to have CPU or platform limitations playing a role.
We have 1440p and 4K charts for power, GPU clocks, and temperatures below. Then we do a test using Metro Exodus at whatever "demanding for the GPU being tested" means — 1440p ultra in the case of the Sapphire RX 7900 XT — and after letting the game run for 15 minutes or more, we check noise levels. This basically represents the worst-case workload and maximum noise, though in practice a lot of games will end up at similar levels.
We'll present additional tables and information about efficiency (FPS/W) and value (FPS/$) at the bottom of the page.
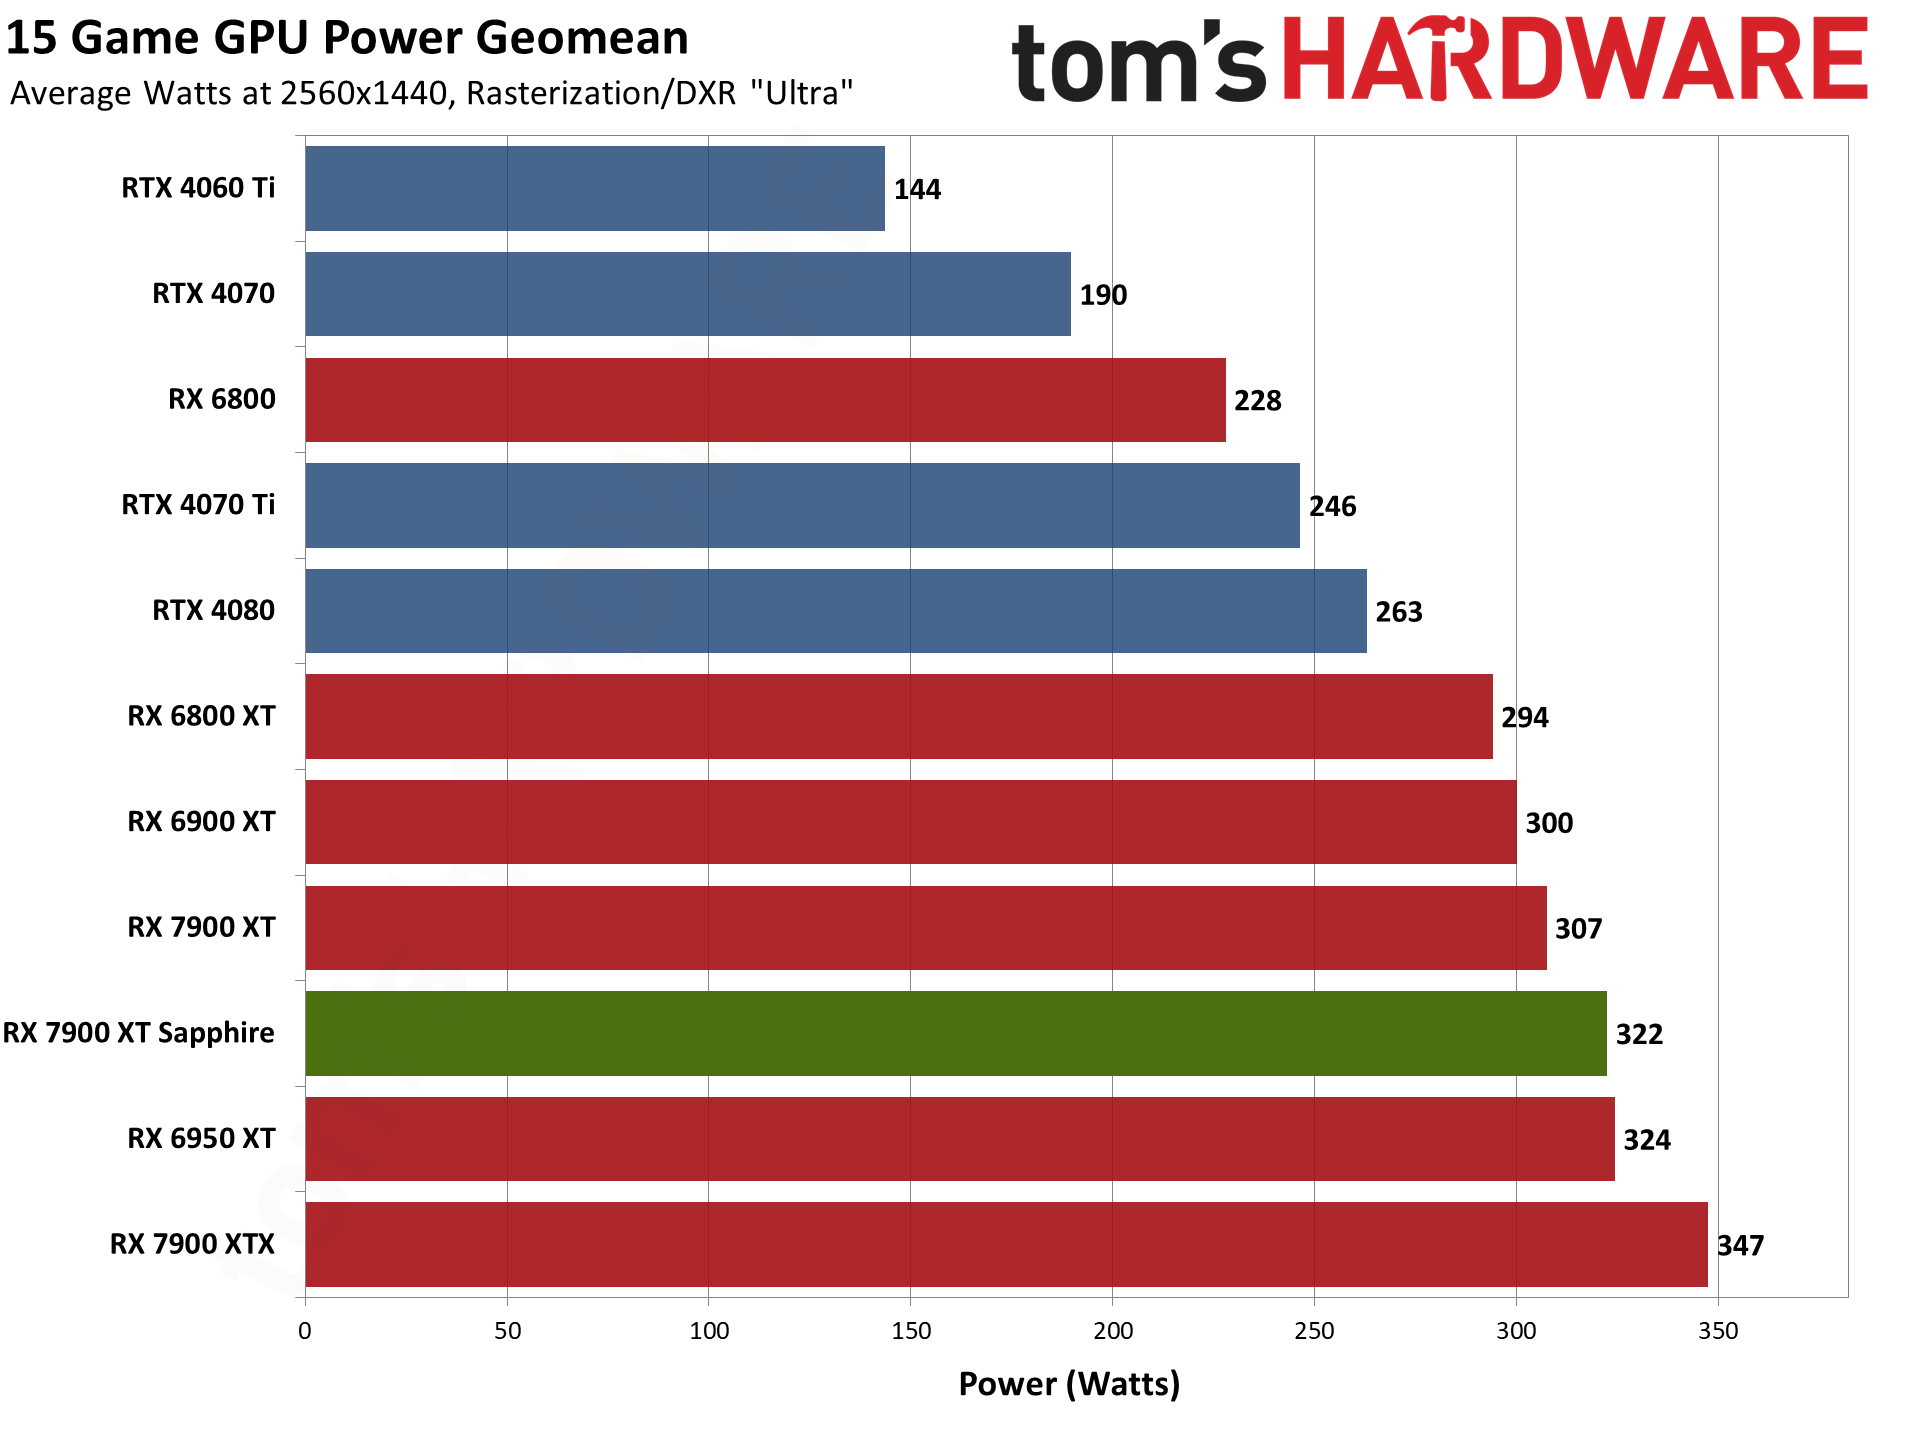
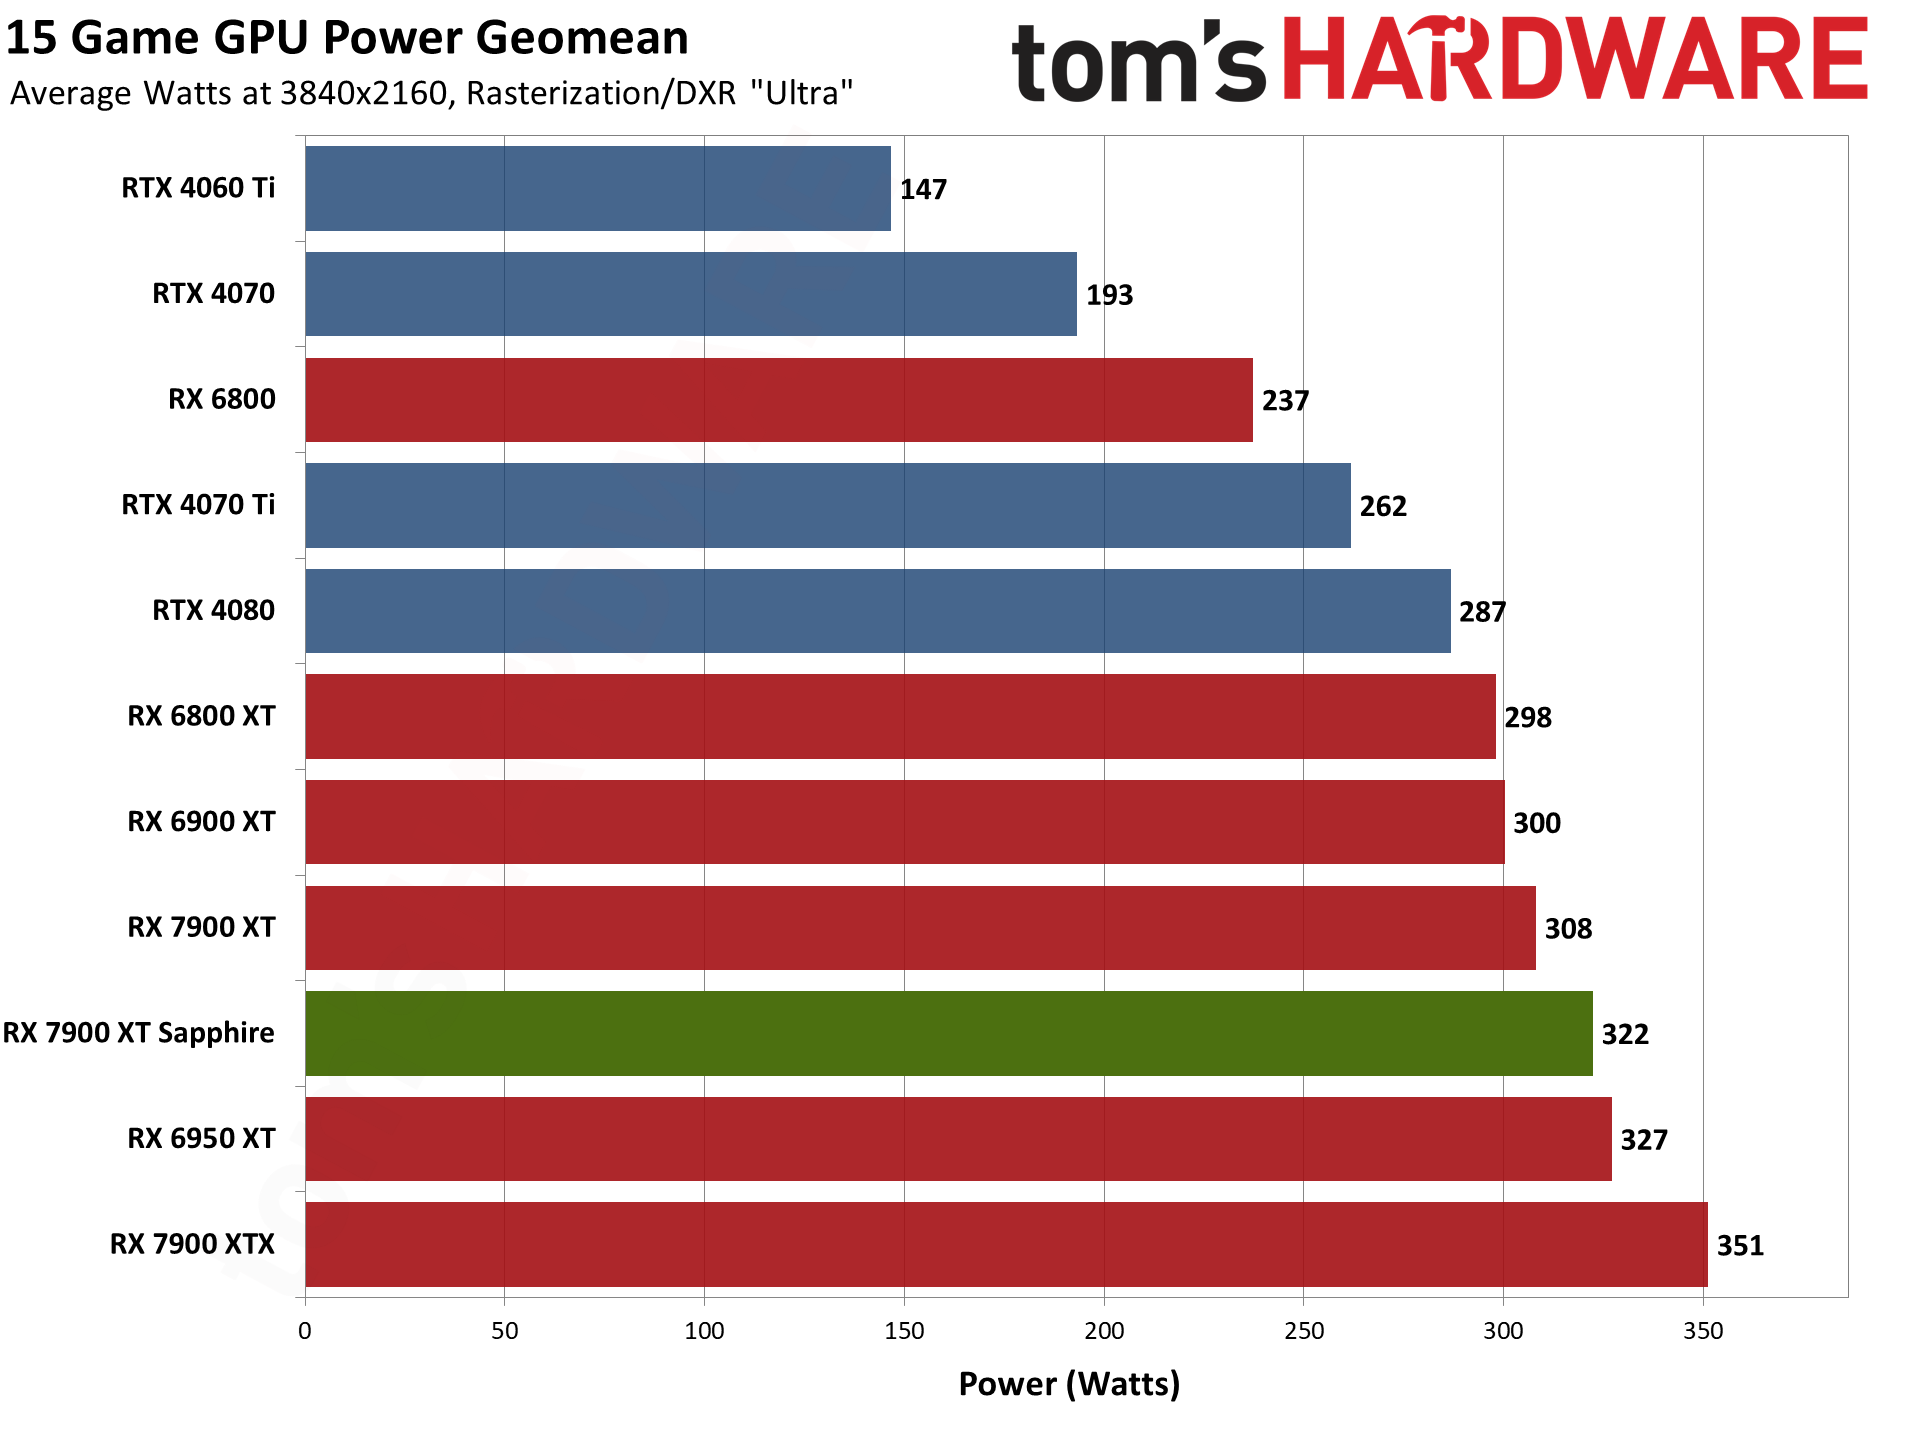
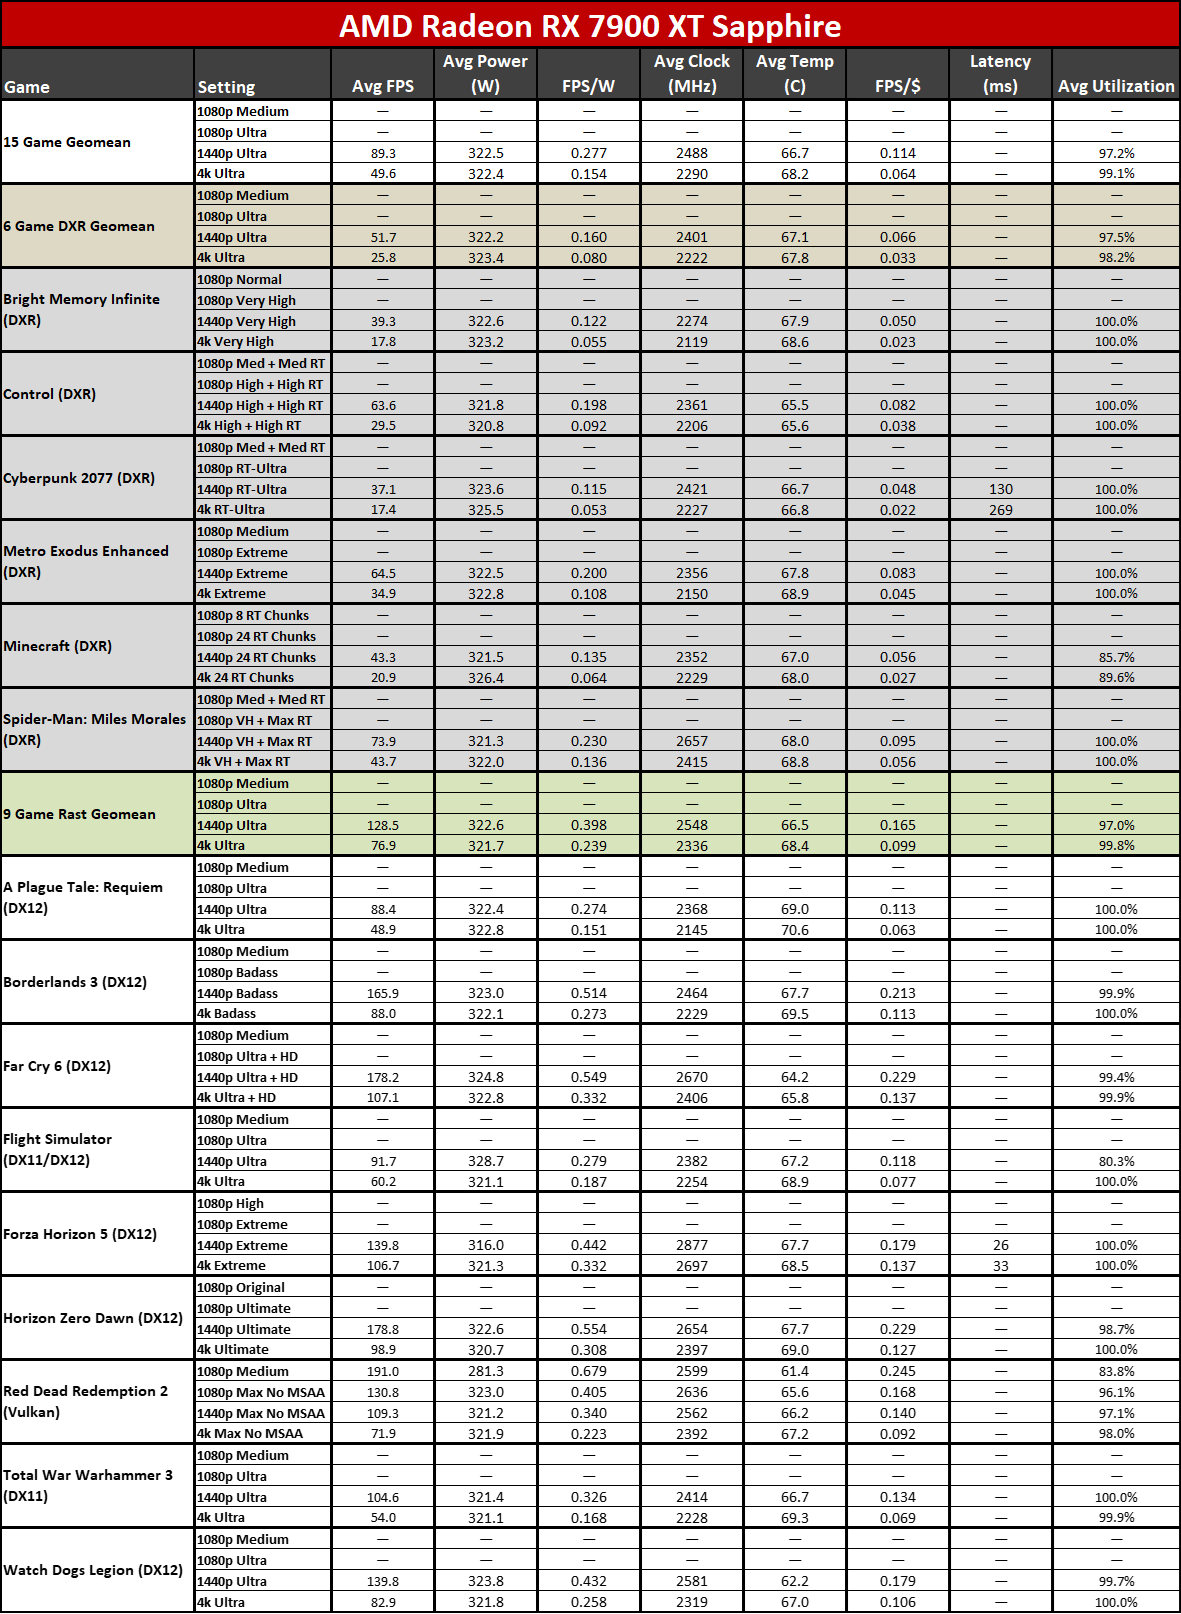
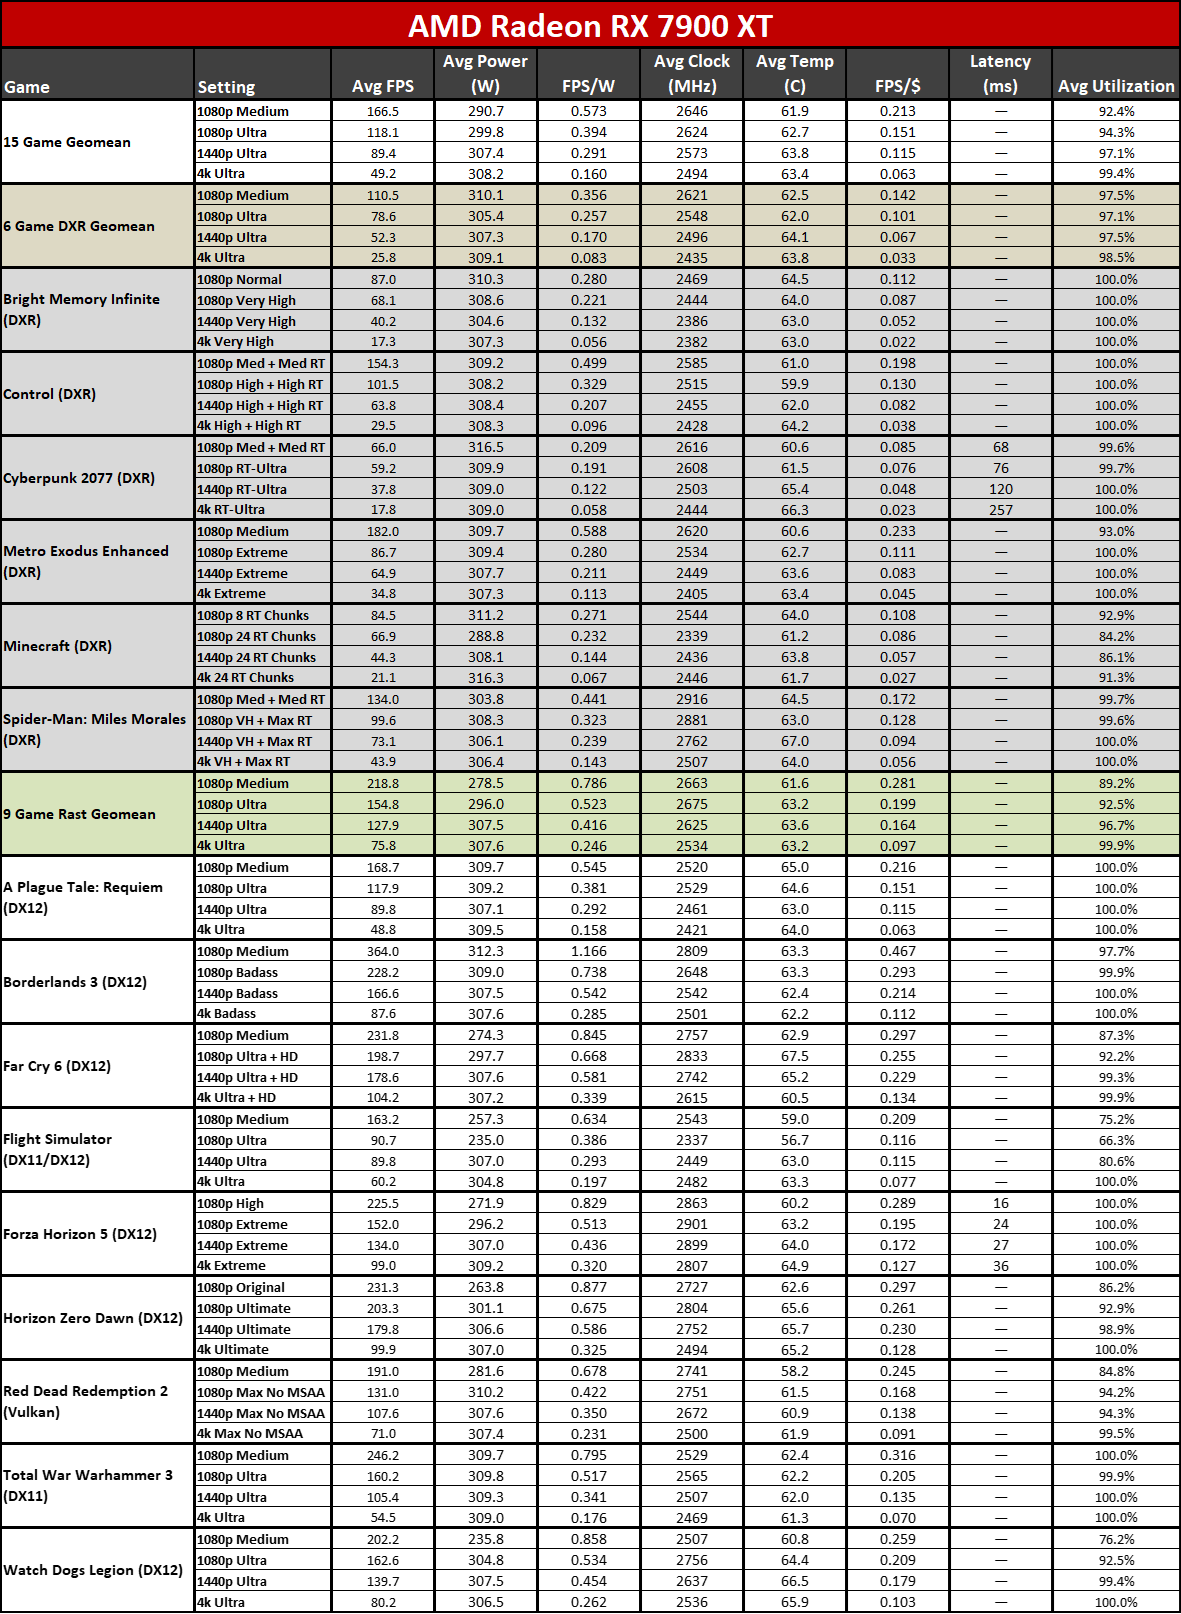
The Sapphire RX 7900 XT does as advertised and uses slightly more power across our test suite than the reference 7900 XT, at both 1440p and 4K. In both cases, the Sapphire card averaged 322W of power use, while the reference card used 307W and 308W. Nvidia's RTX 4070 Ti meanwhile needed just 246W on average at 1440p, and 262W at 4K.
This is an ongoing issue with AMD's RDNA 3 architecture. If you look at RDNA 2 and Ampere, the previous generation GPUs, AMD generally held an advantage in efficiency. Part of that was because Nvidia used Samsung 8N (a 10nm-class node) while AMD used TSMC N7. Now, they're basically on the same 5nm-class node (TSMC 4N and N5, for Nvidia and AMD, respectively). It seems like Nvidia's architecture is overall simply more efficient.
There's also the question of how much extra power AMD had to use by opting for GPU chiplets instead of a monolithic die. We may never know for certain, but certainly there's room for improvement from AMD. Sapphire for its part managed to provide equivalent performance while drawing more power, which definitely isn't the best way of doing things.
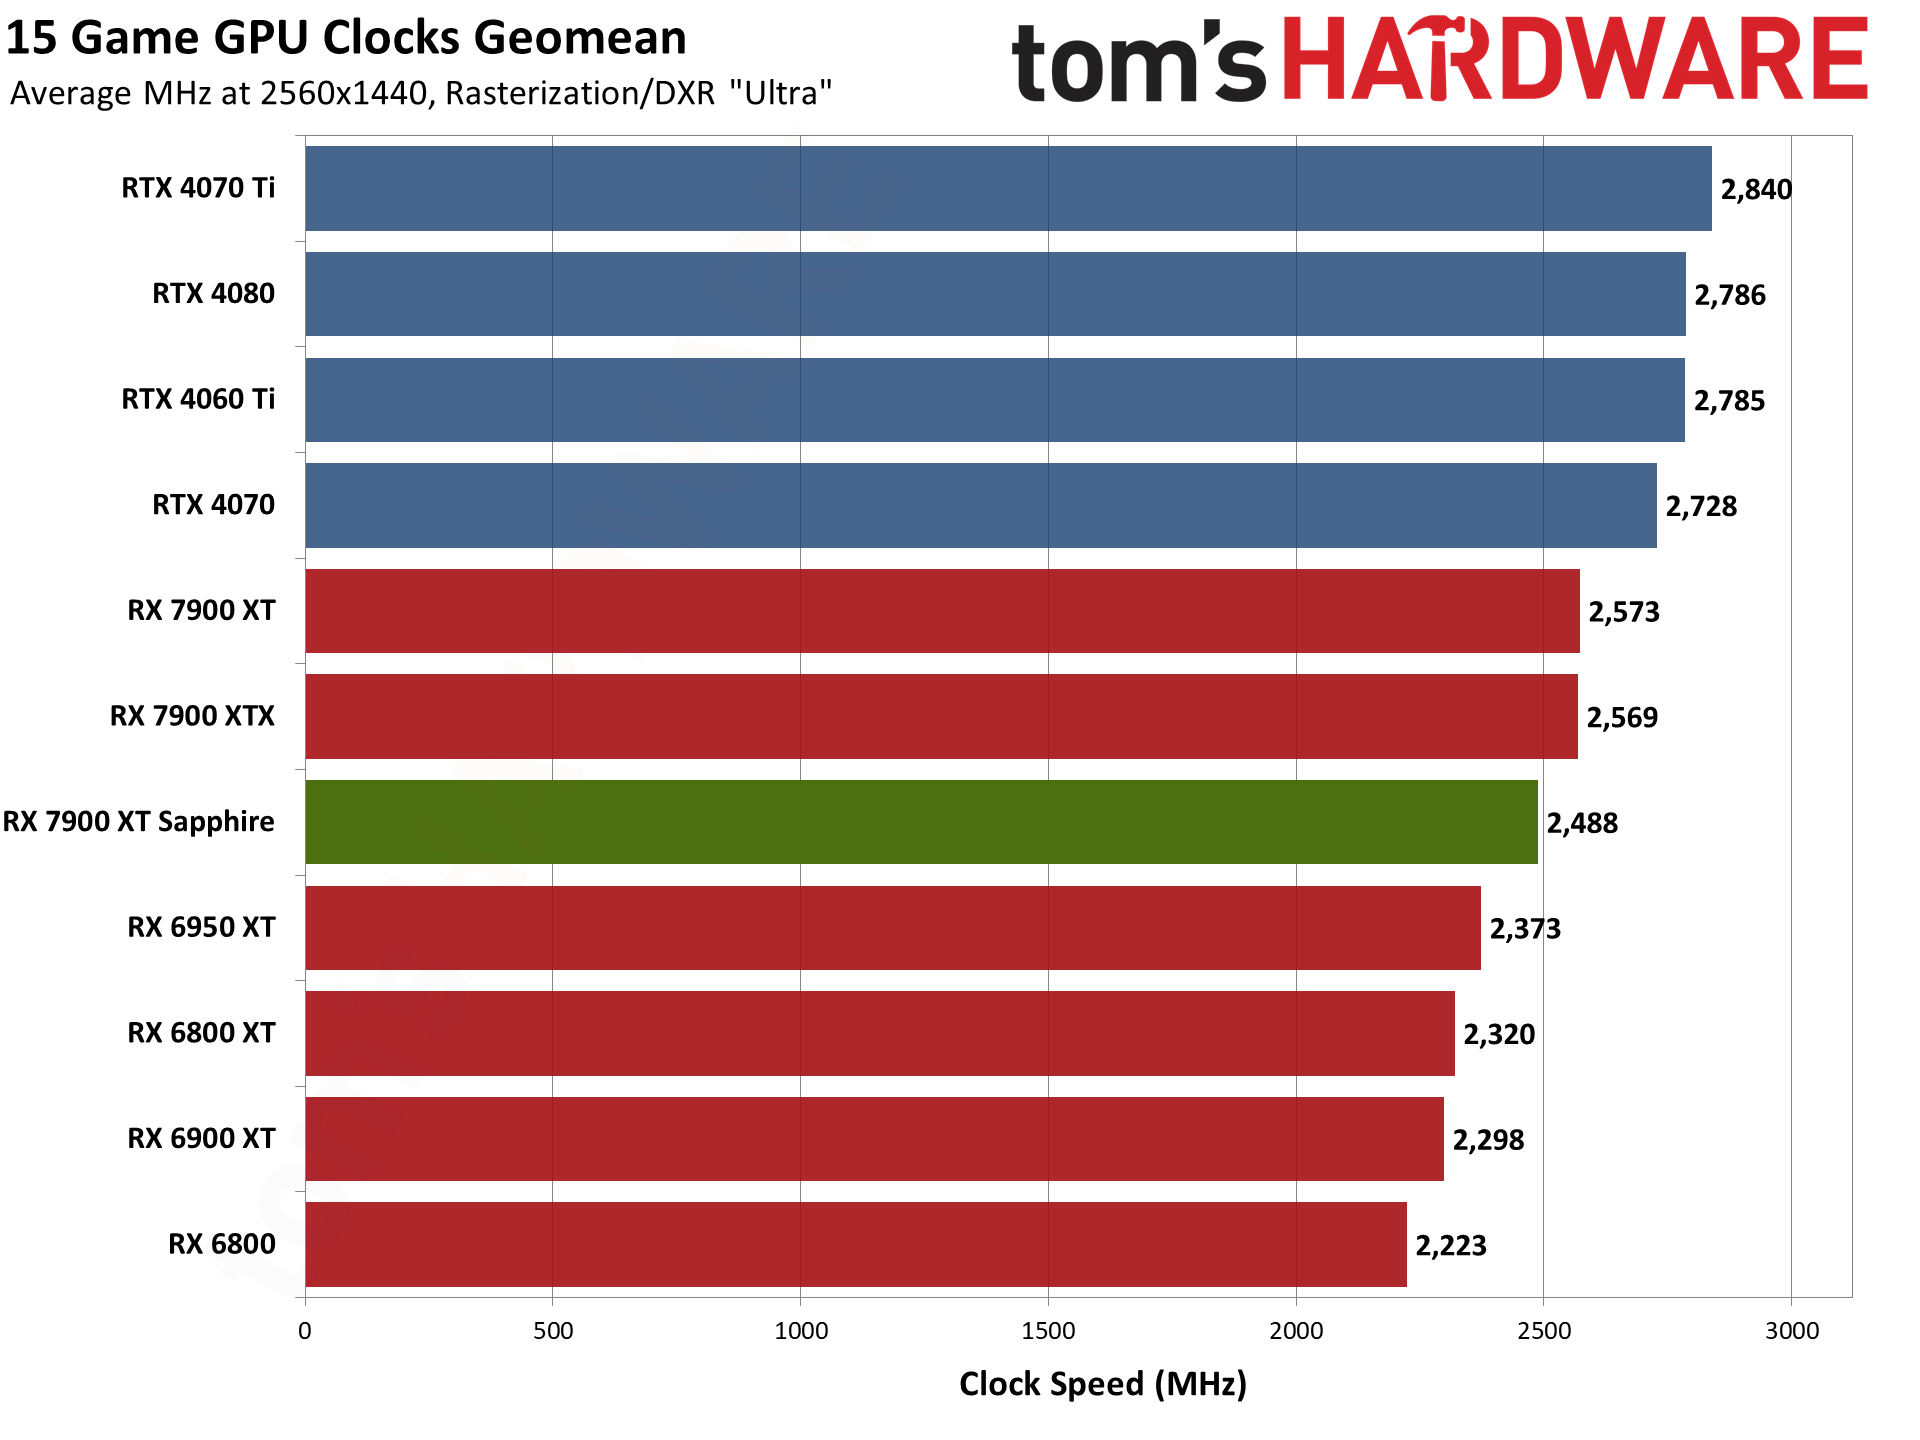
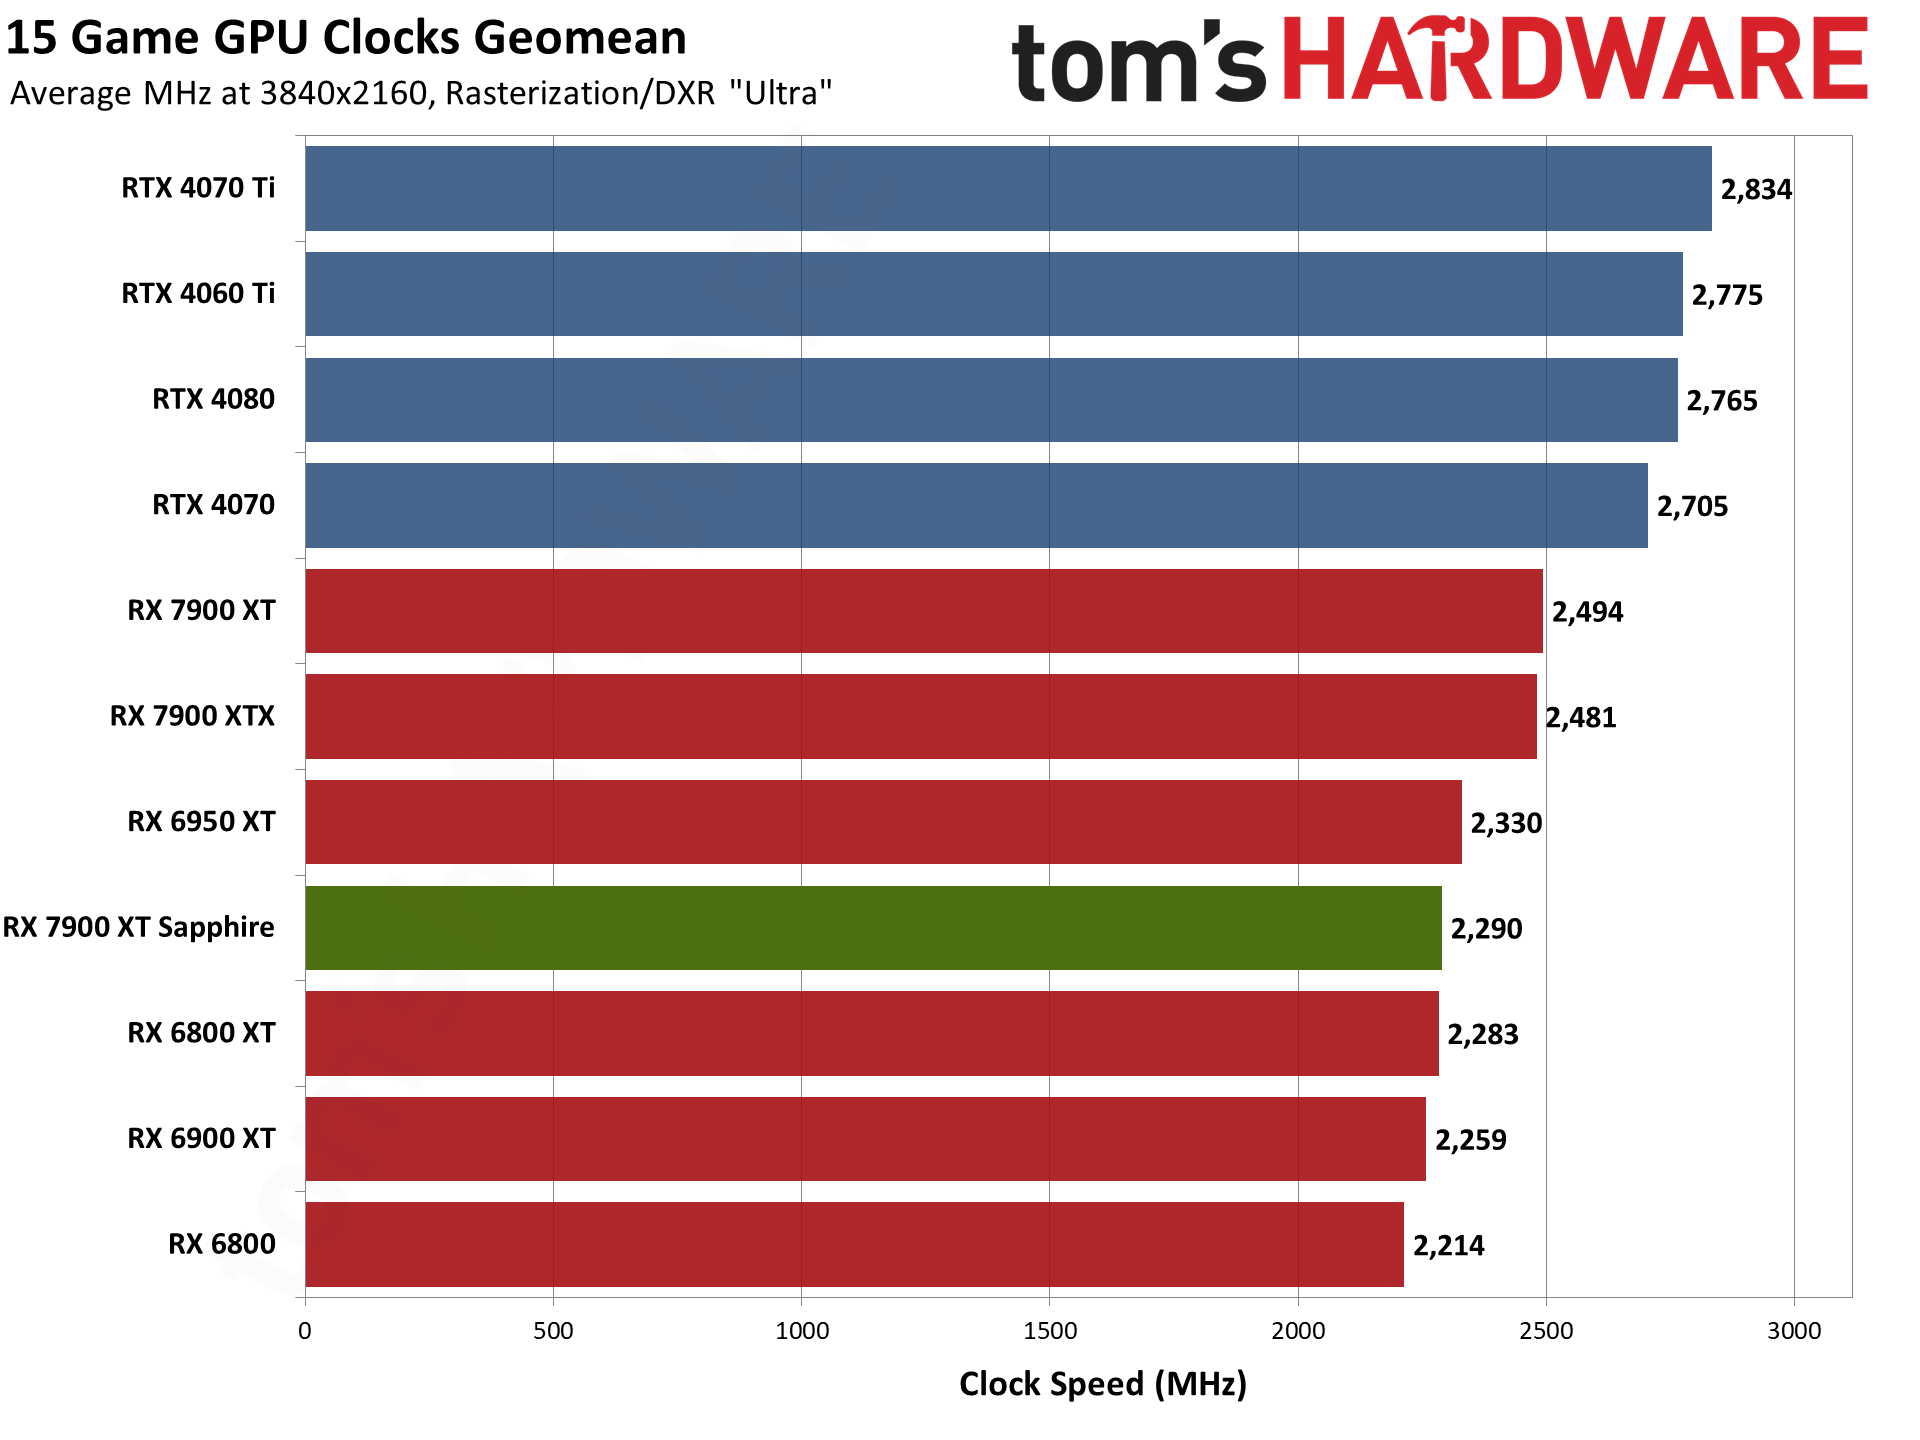
GPU clock speeds on their own don't mean too much, unless you're comparing within the same architecture and even GPU. And that's where things get a bit interesting with the Sapphire RX 7900 XT. On paper, it has a higher 2450 MHz boost clock while the reference card 'only' has a 2400 MHz boost clock. But we know from experience that AMD's latest generation GPUs are likely to exceed that conservative boost clock.
With the reference RX 7900 XT, across our 15-game suite, we measured average GPU clocks of 2573 MHz — 173 MHz above the advertised boost clock. The Sapphire model meanwhile only averaged 2488 MHz, 38 MHz above its advertised speed. That's a 1440p, incidentally. The clocks drop quite at bit at 4K, where the reference card still averaged 2494 MHz, but the Sapphire card dropped to just 2290 MHz.
Looking at these results, we can't help but wonder if our Sapphire card was a bit of a lemon. We've since returned the card to the company, but other sites' results don't seem to corroborate with our results. There's a good chance a different Pulse card would have performed better than what we've shown here.
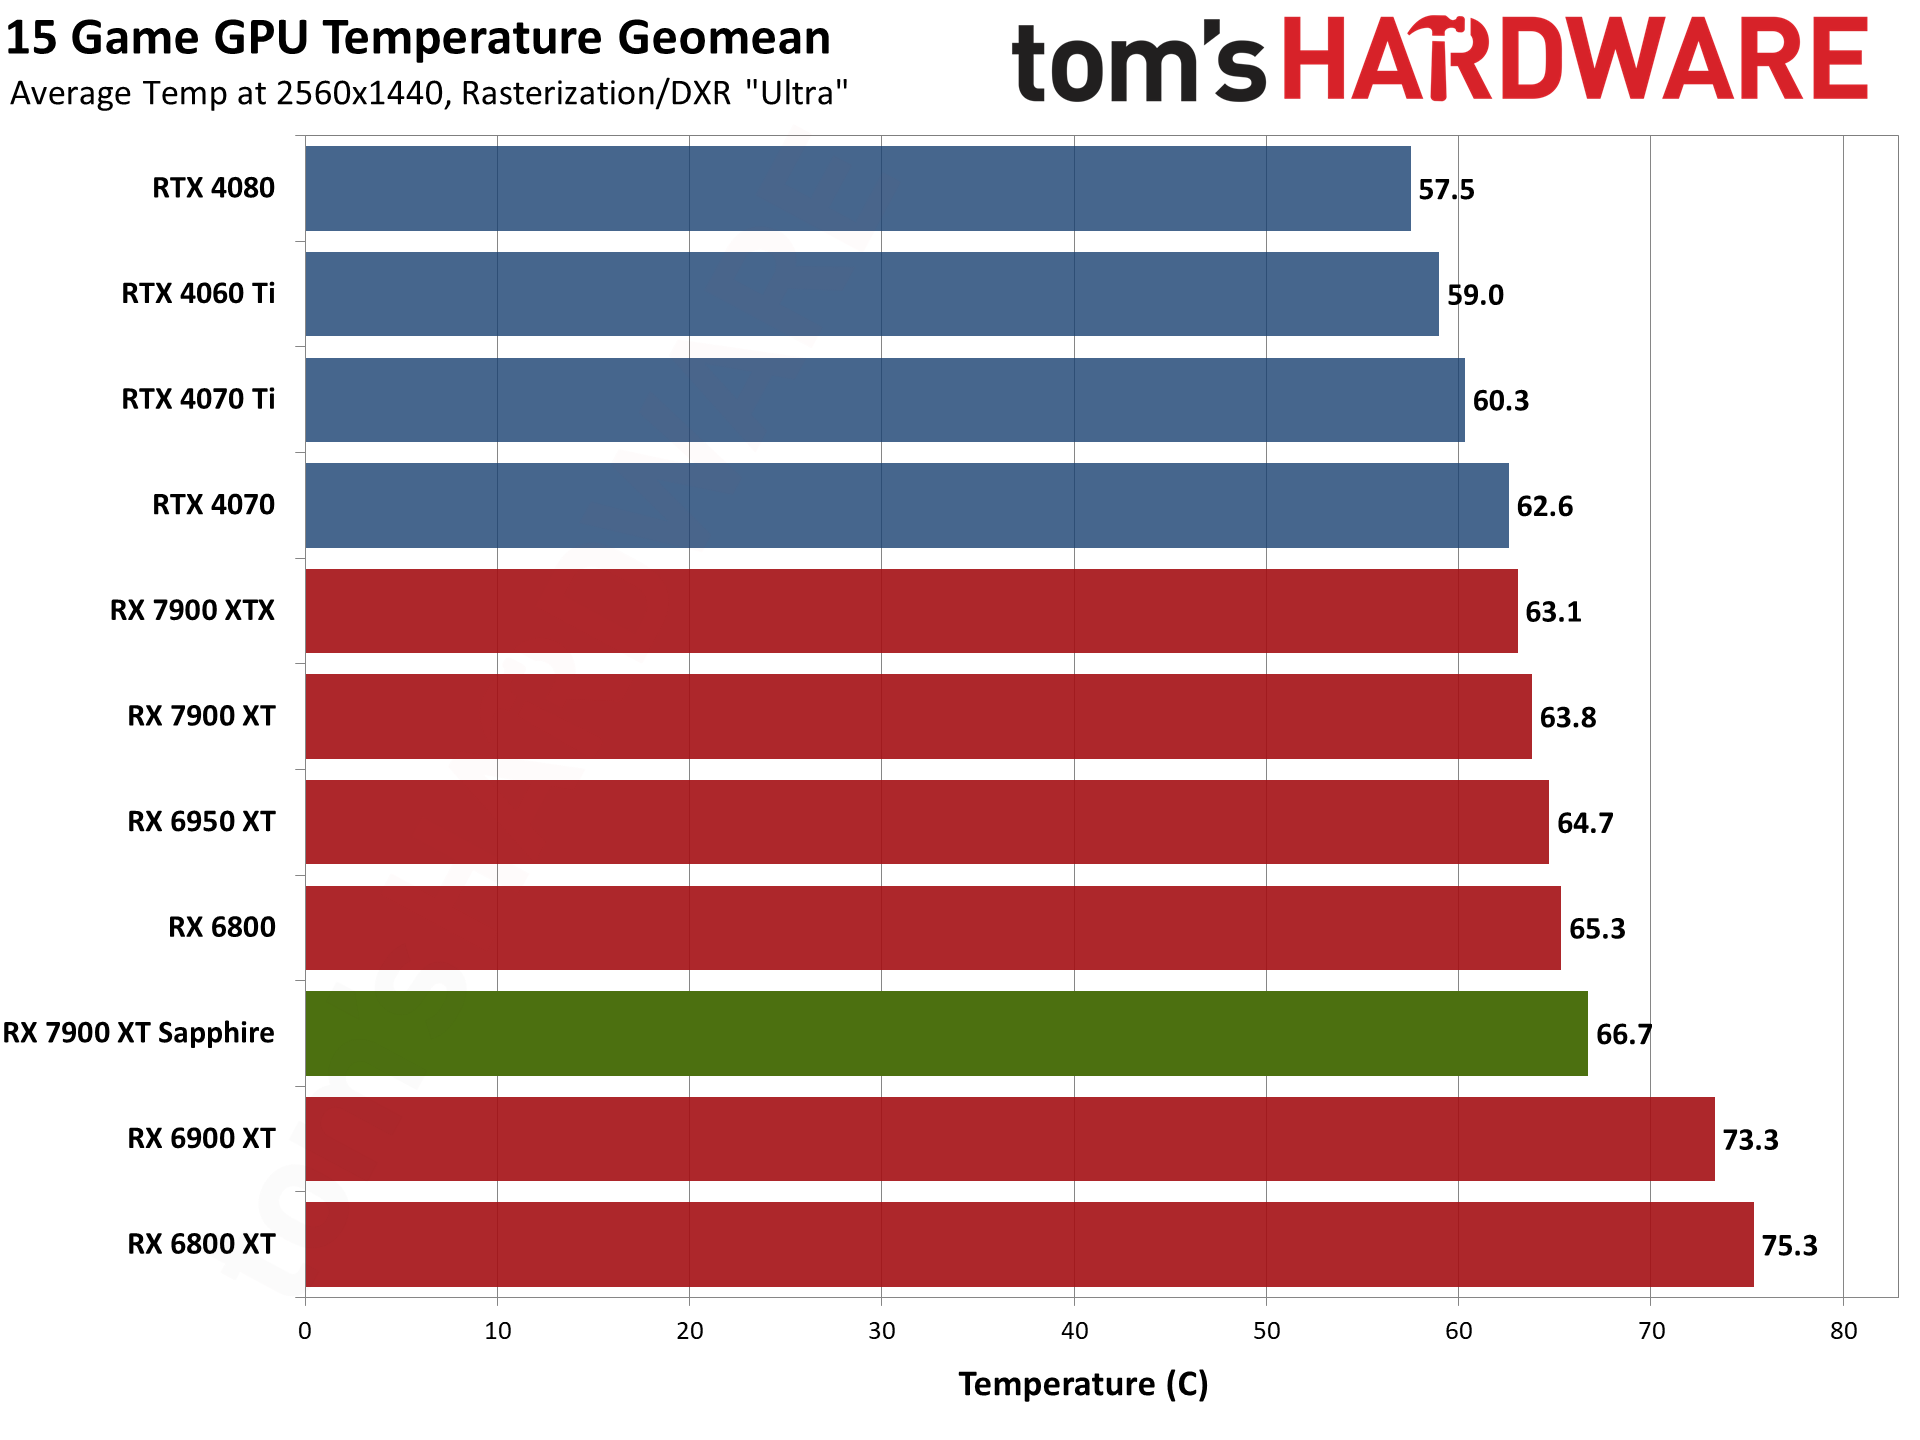
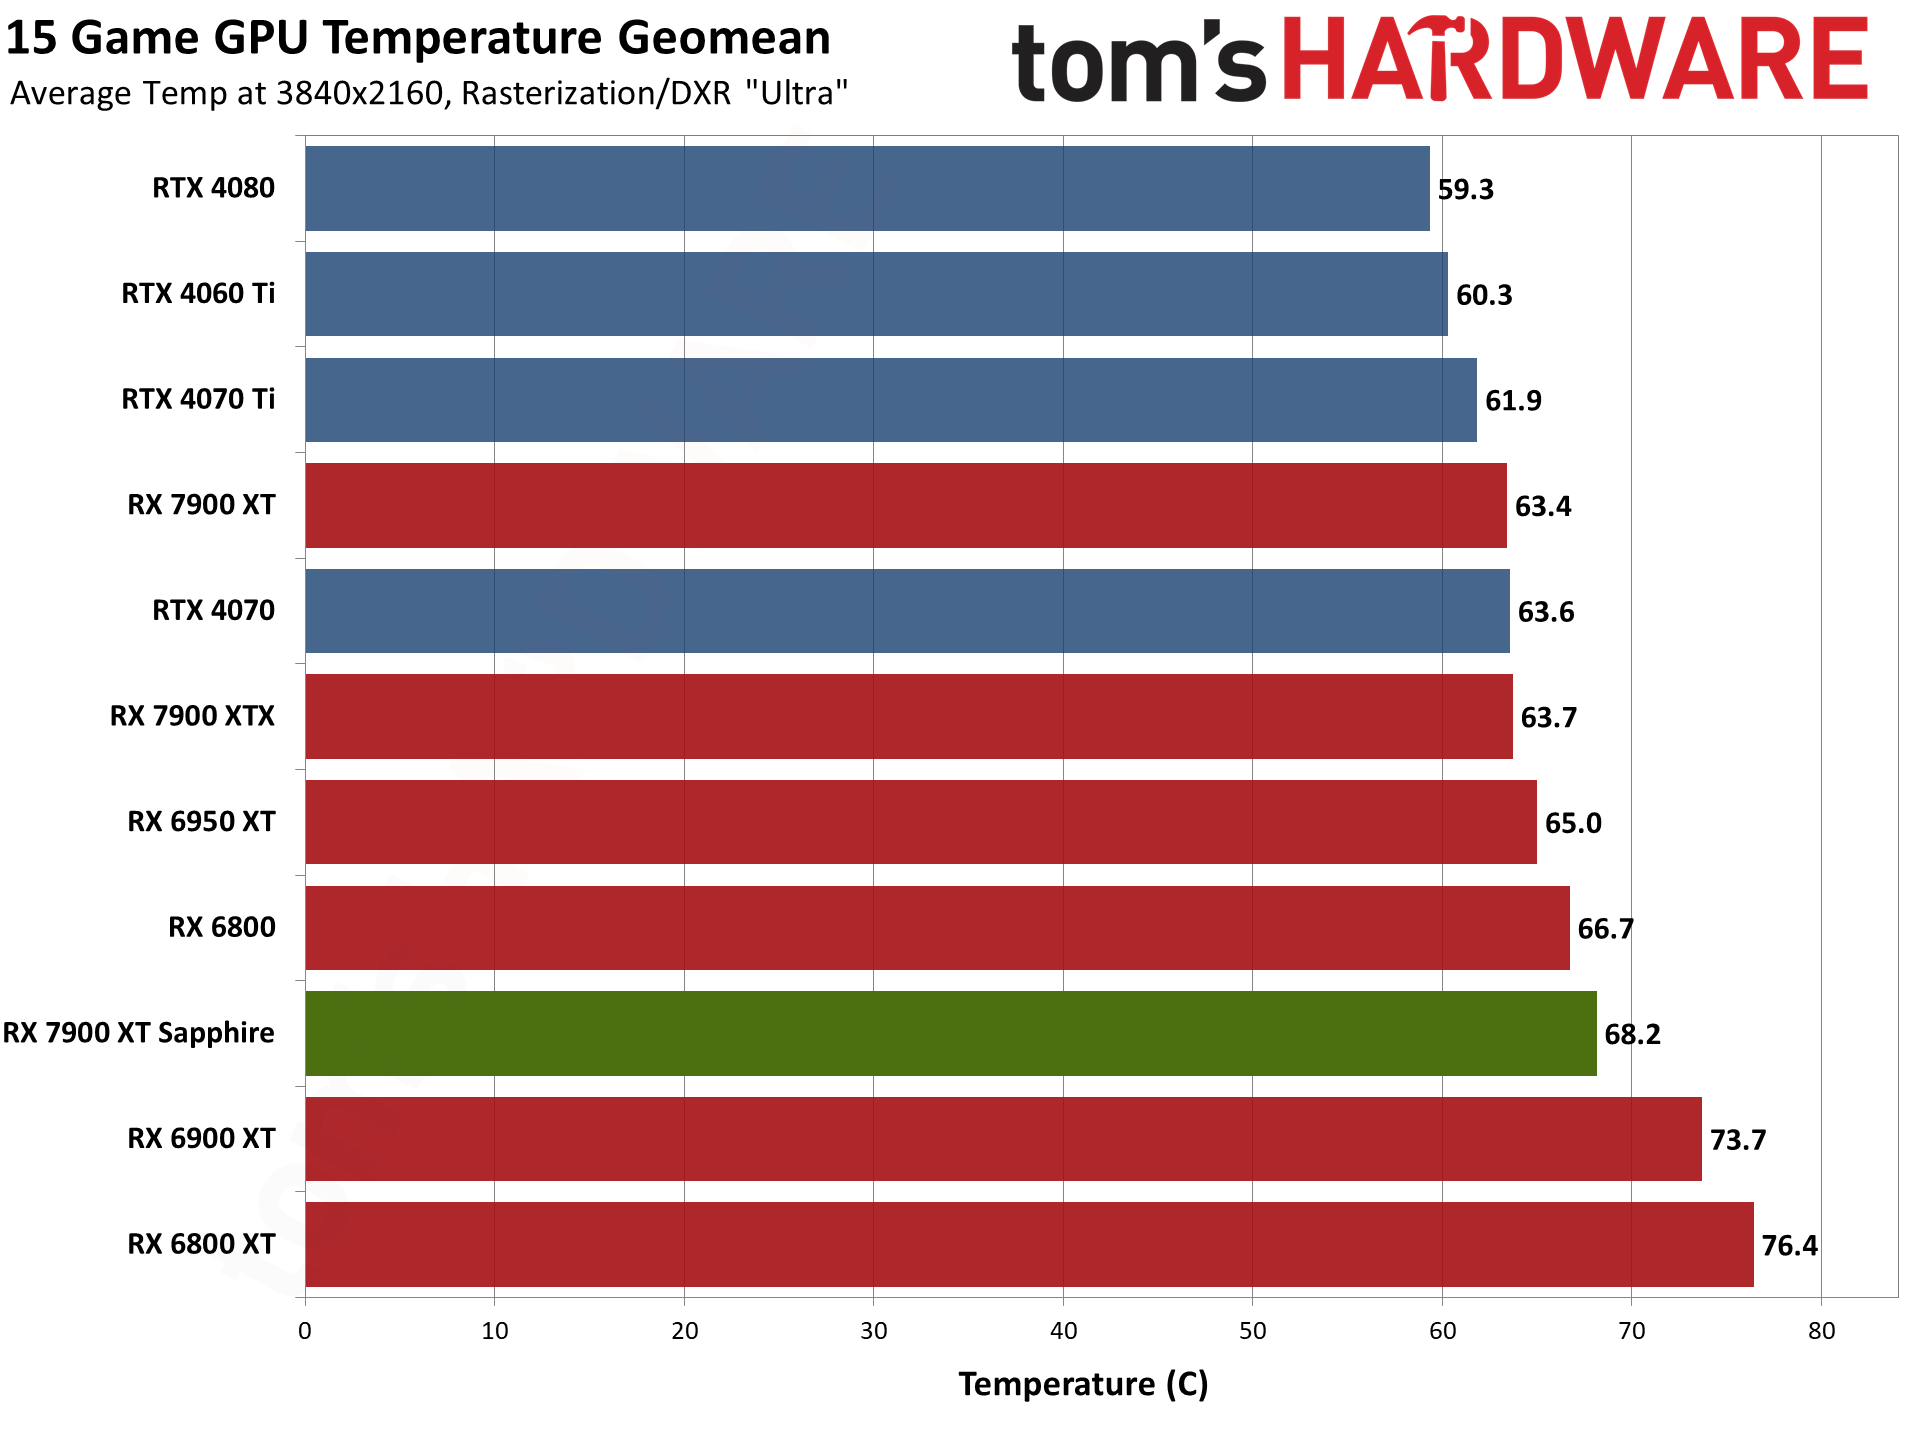
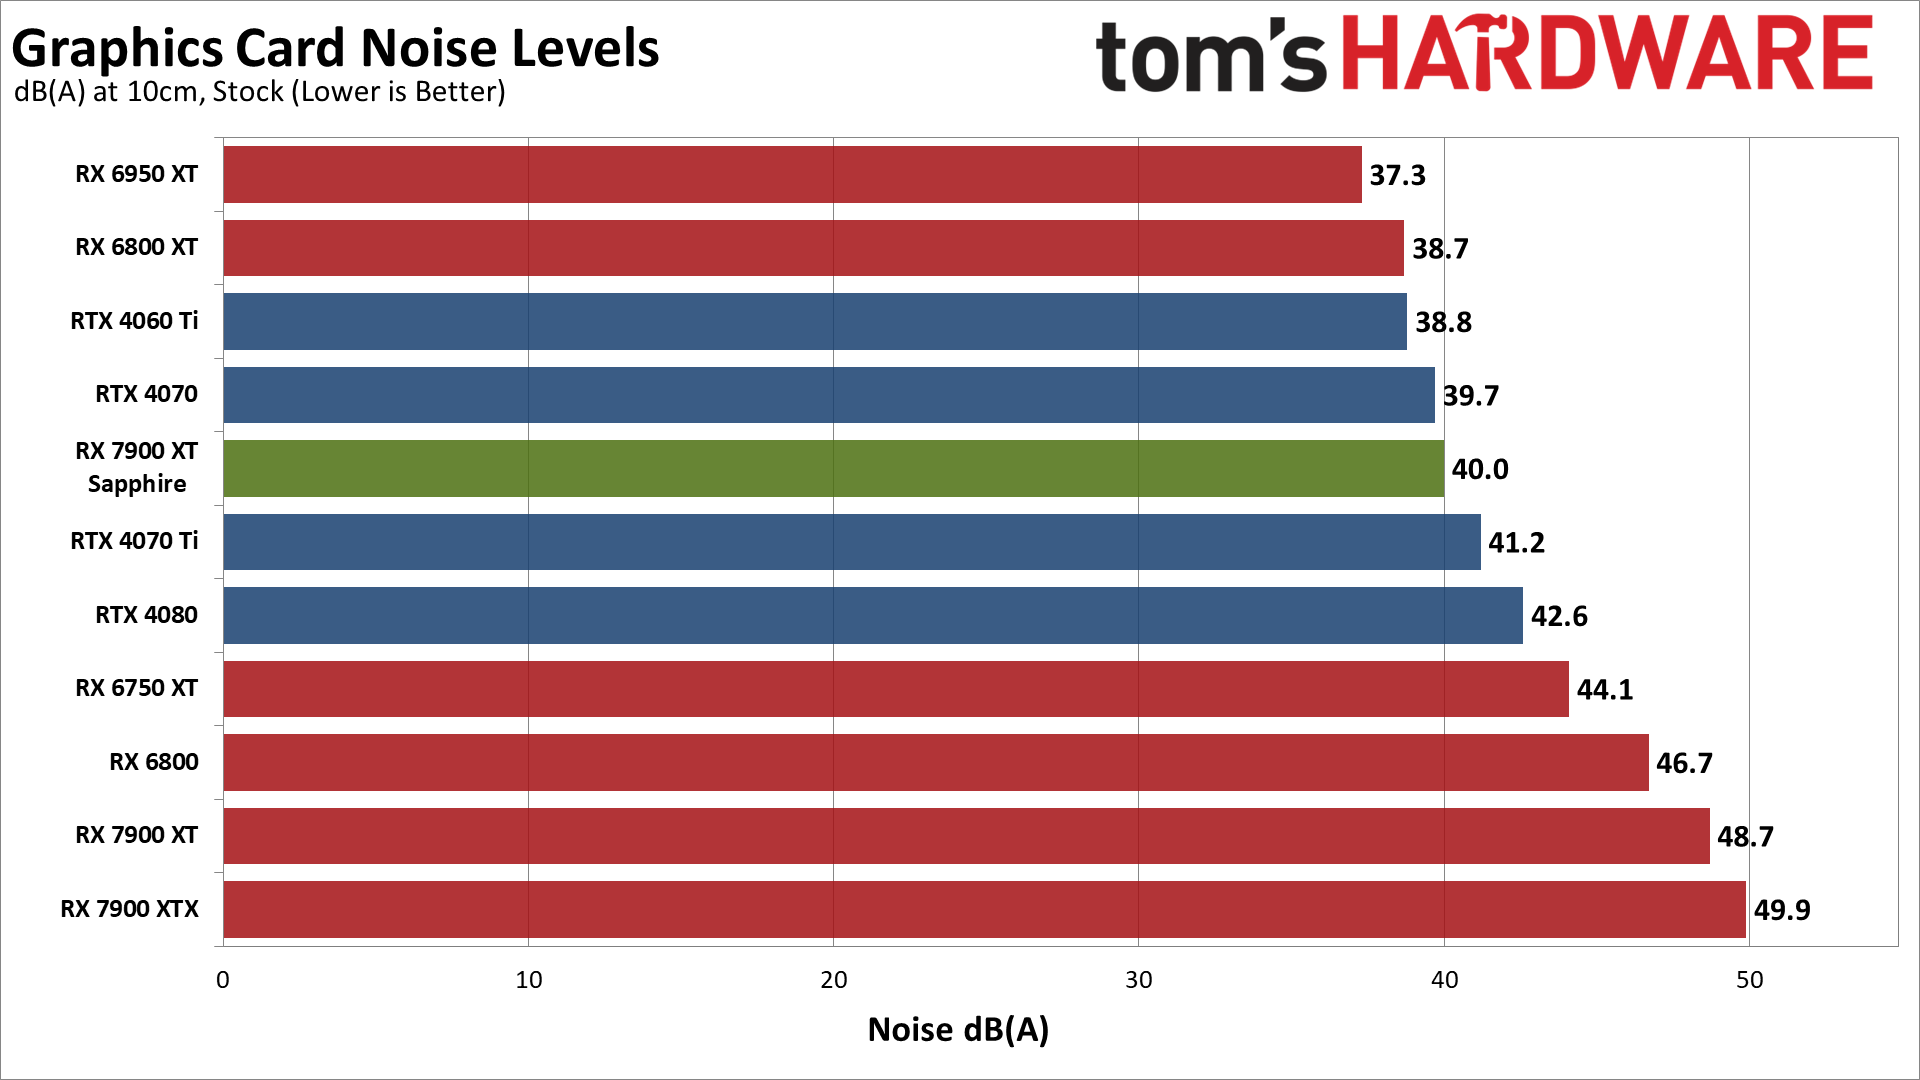
Finally, we have to look at temperatures and noise levels as a linked pair. Higher fan speeds can drop noise levels, and conversely lower fan speeds can result in higher temperatures but less noise. There's a balancing act that needs to be maintained, and generally speaking GPU core temperatures of less than 80C aren't a concern.
Looking just at the thermals, the Sapphire RX 7900 XT ran about 3–5C hotter than the reference card. Neither one averaged more than 70C, so temperatures aren't a concern, but we can only get a better idea of how the cards compare by also looking at fan speeds and/or noise levels.
We check noise levels using an SPL (sound pressure level) meter placed 10cm from the card, with the mic aimed right at the center of the middle fan (on the Sapphire card). This helps minimize the impact of other noise sources like the fans on the CPU cooler. The noise floor of our test environment and equipment is less than 32 dB(A).
After running Metro Exodus for over 15 minutes, the Sapphire RX 7900 XT settled at a fan speed of 38% with a noise level of 40.0 dB(A). While not the quietest GPU we've tested — some of the really large cards run at 37–38 dB(A) — it's equal to or better than most other competing GPUs. The reference AMD 7900 XT on the other hand had a 48.7 dB(A) result, with the fans running at 63%.
There's no question in my mind that the Sapphire cooling solution ends up performing better overall, even if the actual temperatures are slightly higher. The reference cards get relatively loud, while Sapphire's fans and cooler generally do a better job while keeping noise levels in check.
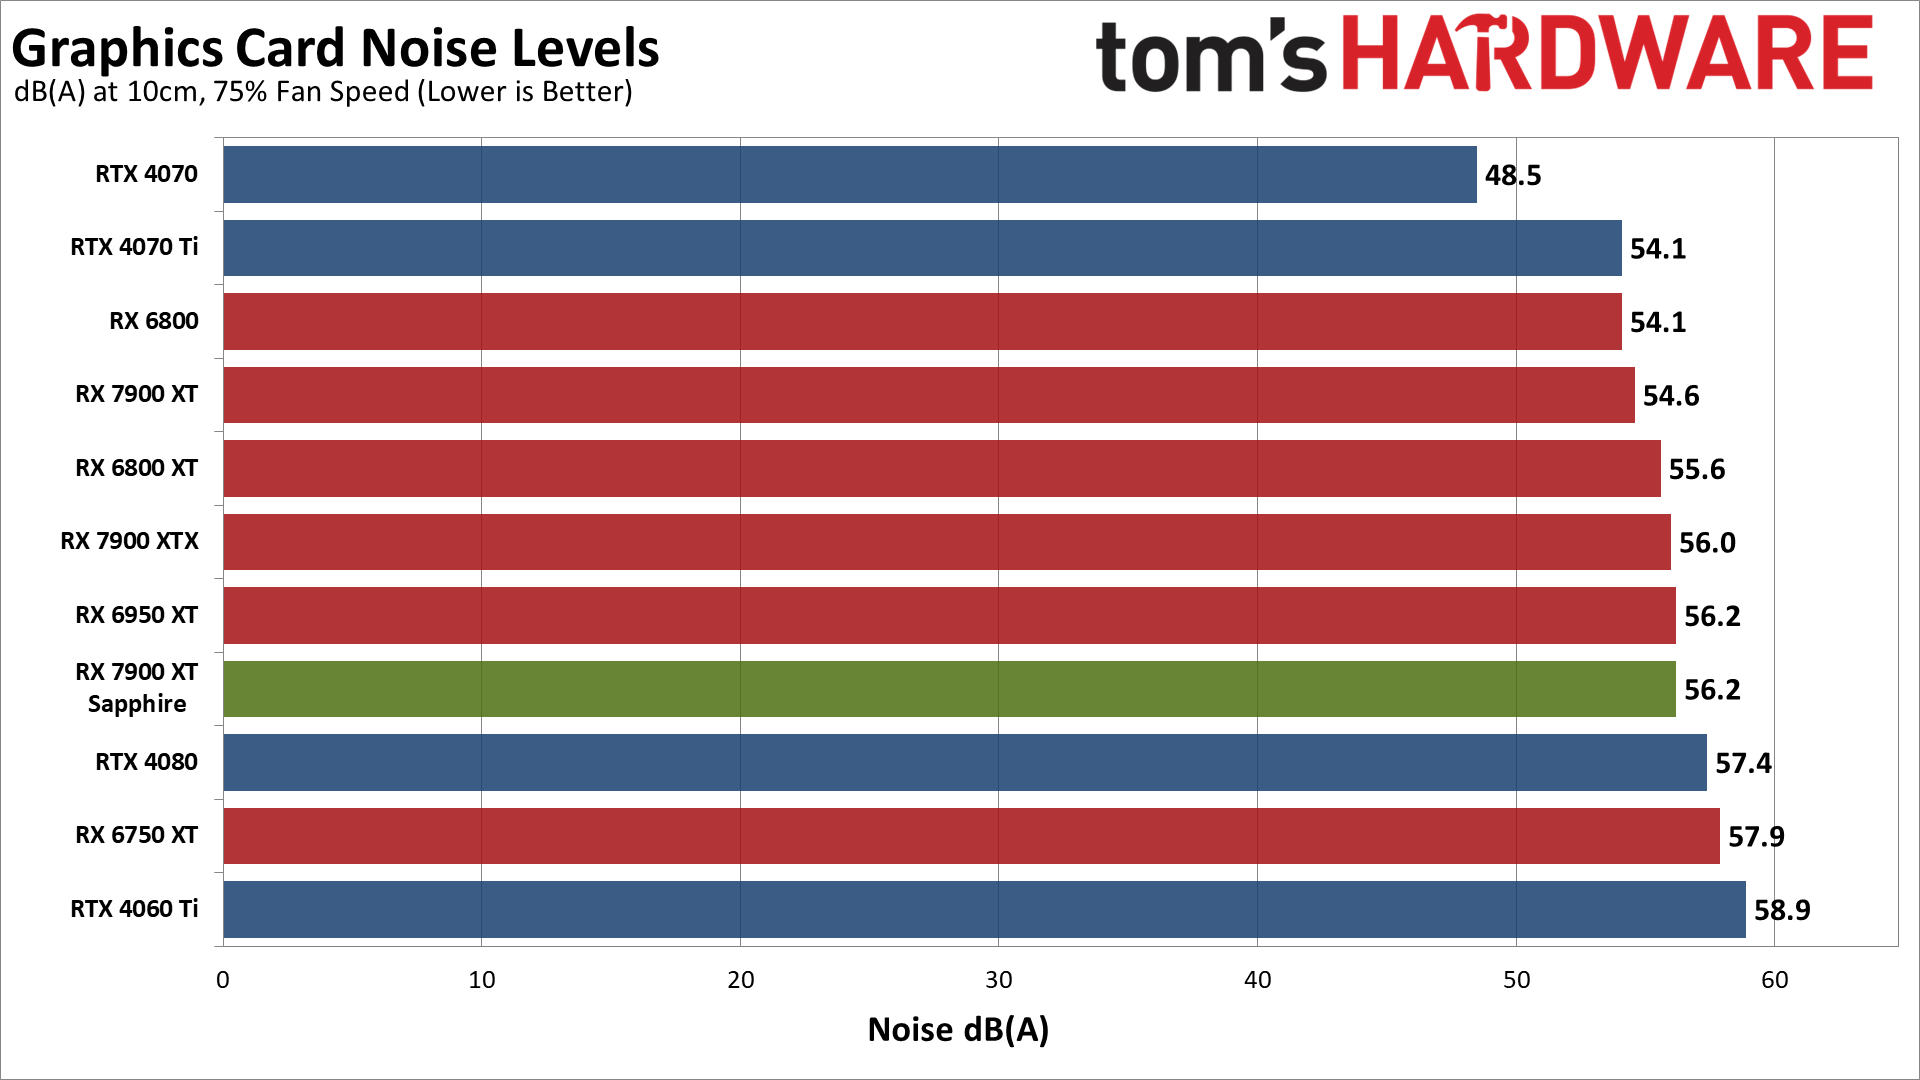
We also tested with a static fan speed of 75%, which caused the Sapphire RX 7900 XT to generate 56.2 dB(A) of noise. That's similar to a lot of other GPUs, but not hugely important as you shouldn't normally see the fans spinning at more than 50% or so.
GPU Value and Efficiency

| Graphics Card | FPS/$ | FPS/W | 1080p FPS | 1440p FPS | 4K FPS | Online Price | Power | PC FPS/$ |
|---|---|---|---|---|---|---|---|---|
| GeForce RTX 4060 Ti | 0.137 | 0.382 | 80.1 | 54.9 | 27.9 | $400 | 144W | 10 — 0.0372 |
| Radeon RX 6800 XT | 0.131 | 0.222 | 90.1 | 65.4 | 35.1 | $500 | 294W | 8 — 0.0415 |
| GeForce RTX 4070 | 0.125 | 0.386 | 101.8 | 73.2 | 39.3 | $585 | 190W | 6 — 0.0441 |
| Radeon RX 6950 XT | 0.118 | 0.230 | 100.4 | 74.5 | 40.2 | $630 | 324W | 7 — 0.0437 |
| Radeon RX 6800 | 0.115 | 0.247 | 78.6 | 56.3 | 30.1 | $490 | 228W | 11 — 0.0360 |
| GeForce RTX 4070 Ti | 0.115 | 0.367 | 121.7 | 90.5 | 50.0 | $790 | 246W | 2 — 0.0486 |
| Radeon RX 7900 XT Sapphire | 0.111 | 0.267 | — | 86.2 | 48.3 | $780 | 322W | 4 — 0.0465 |
| Radeon RX 7900 XT | 0.111 | 0.281 | 113.2 | 86.2 | 47.8 | $780 | 307W | 5 — 0.0465 |
| Radeon RX 7900 XTX | 0.099 | 0.278 | 123.5 | 96.6 | 56.3 | $980 | 347W | 3 — 0.0470 |
| GeForce RTX 4080 | 0.098 | 0.412 | 139.0 | 108.3 | 62.7 | $1,108 | 263W | 1 — 0.0496 |
| Radeon RX 6900 XT | 0.090 | 0.234 | 95.4 | 70.2 | 37.9 | $780 | 300W | 9 — 0.0379 |
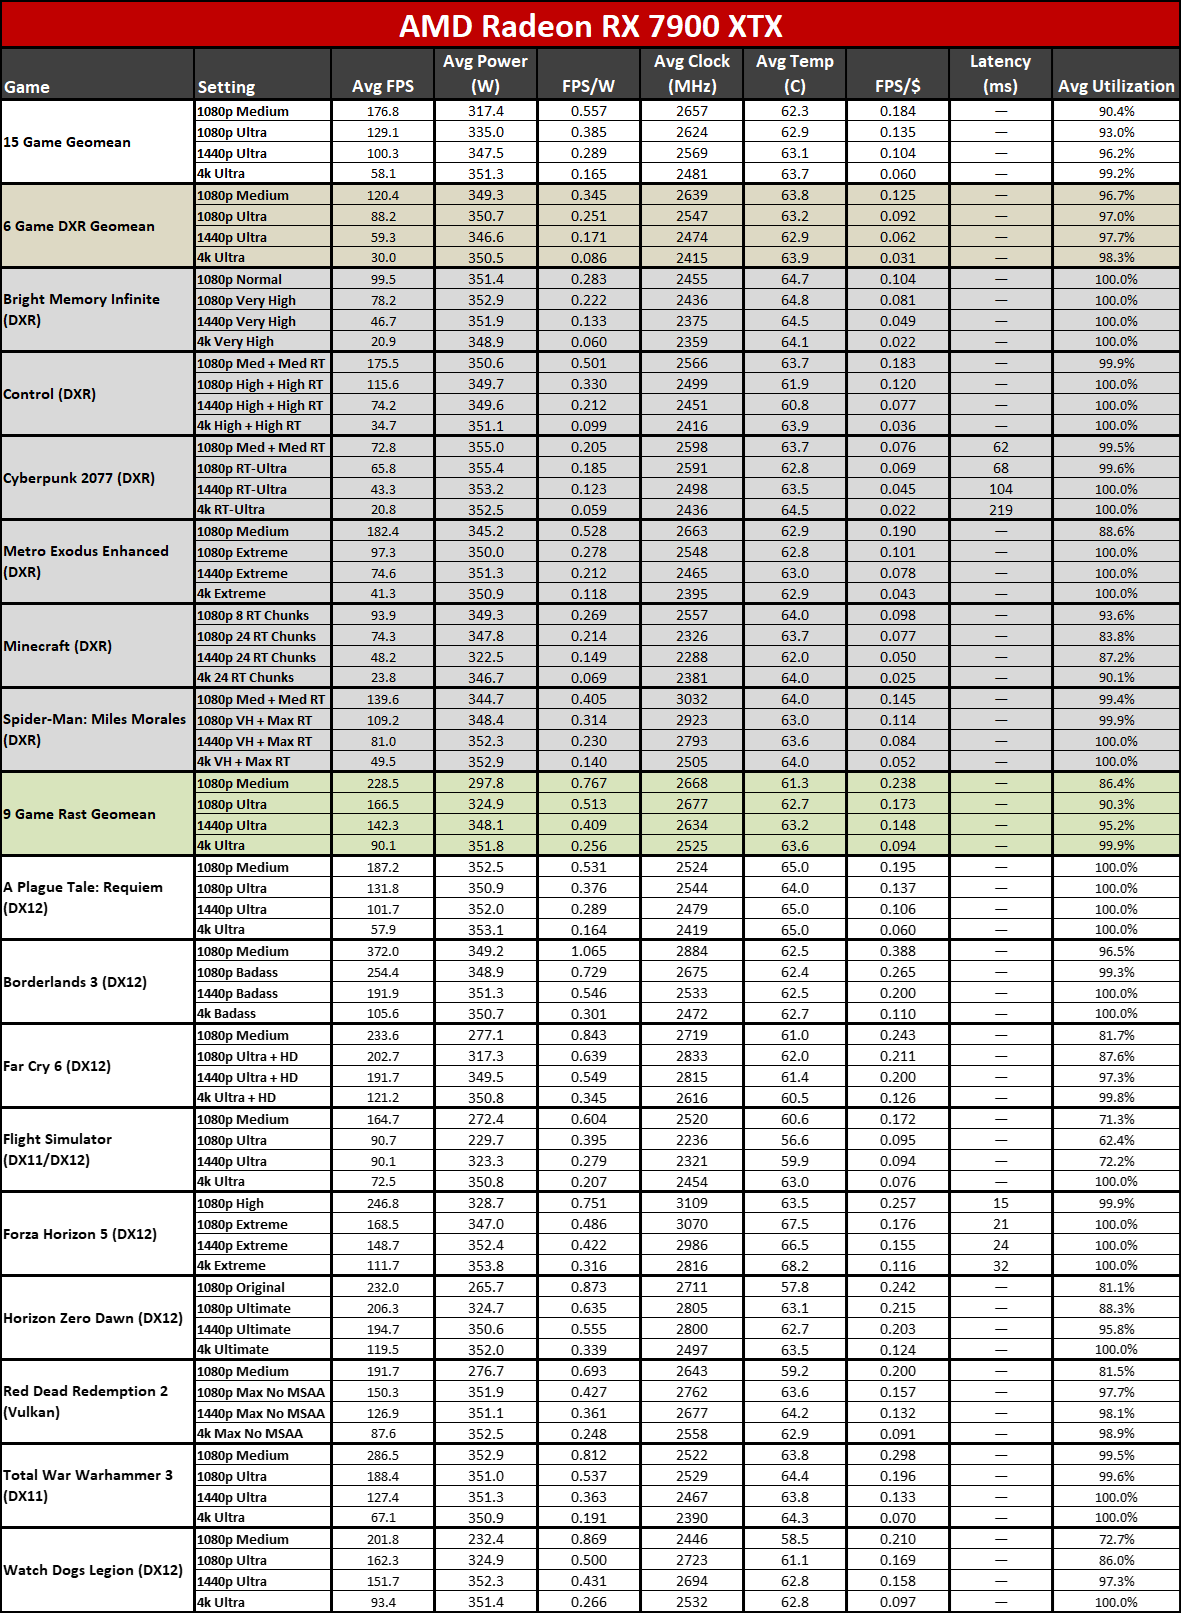
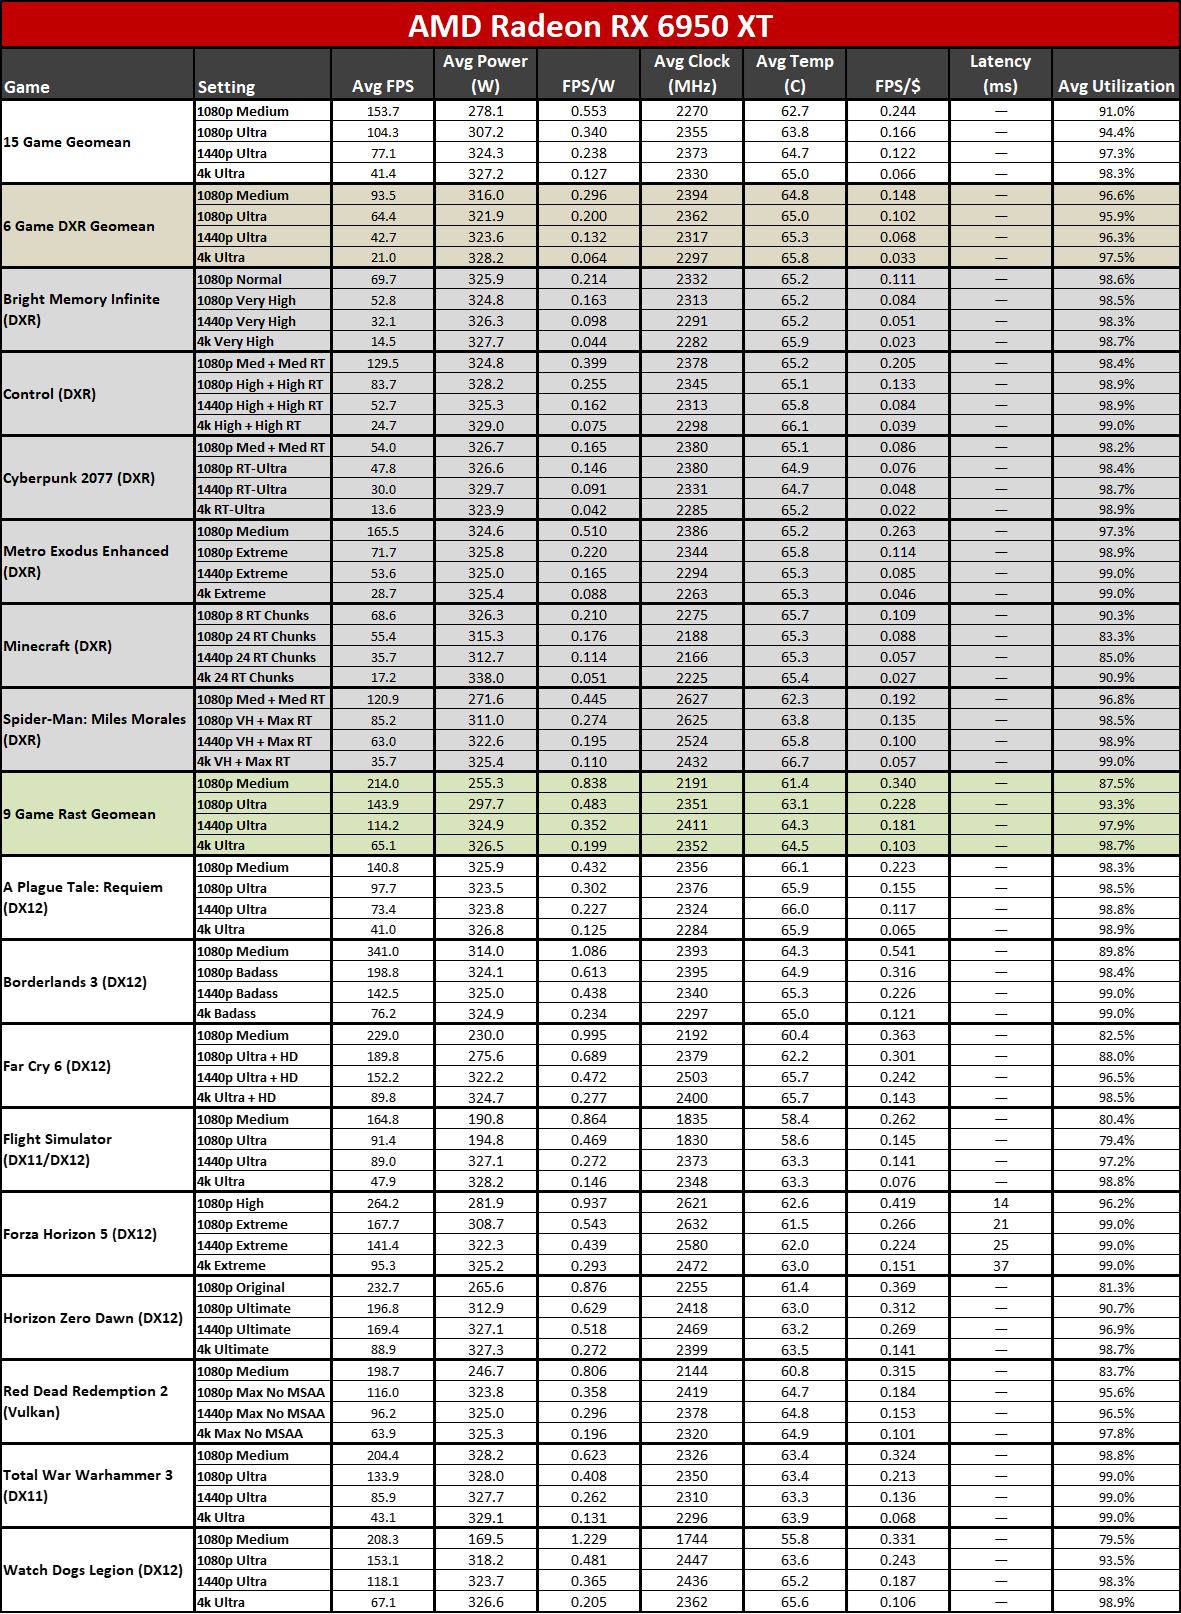
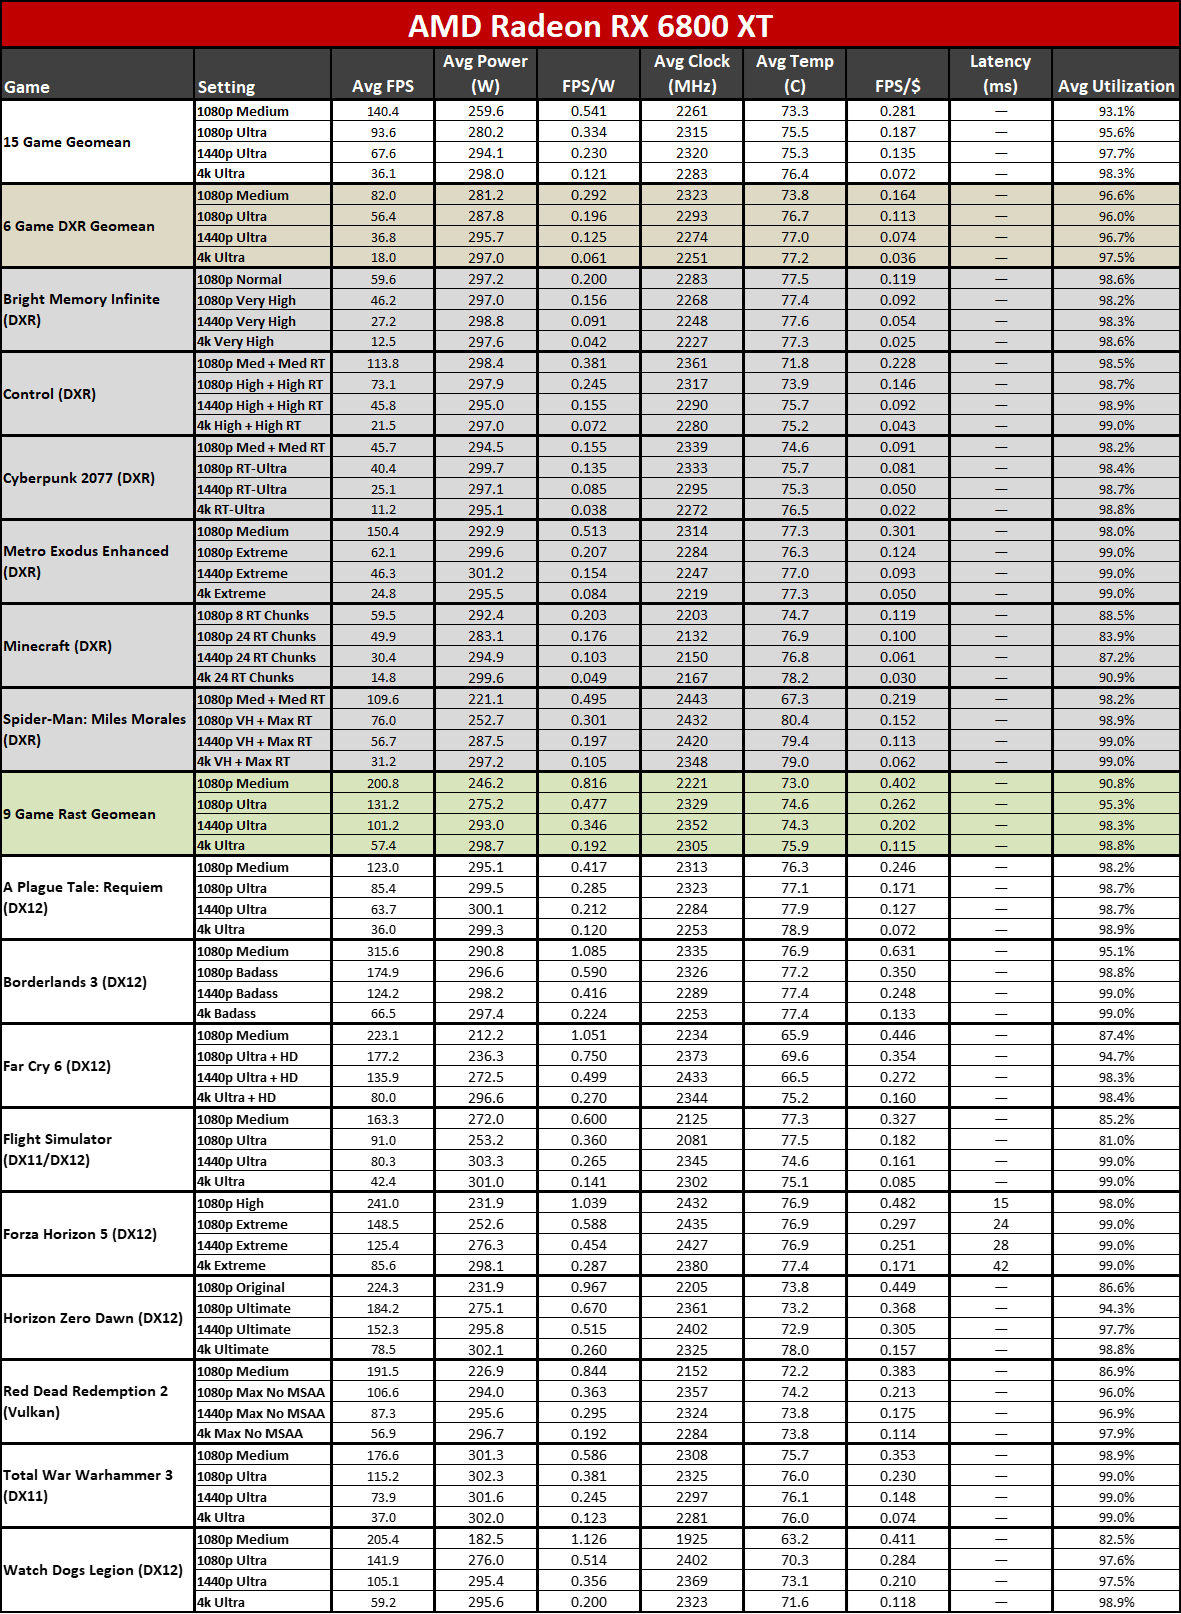
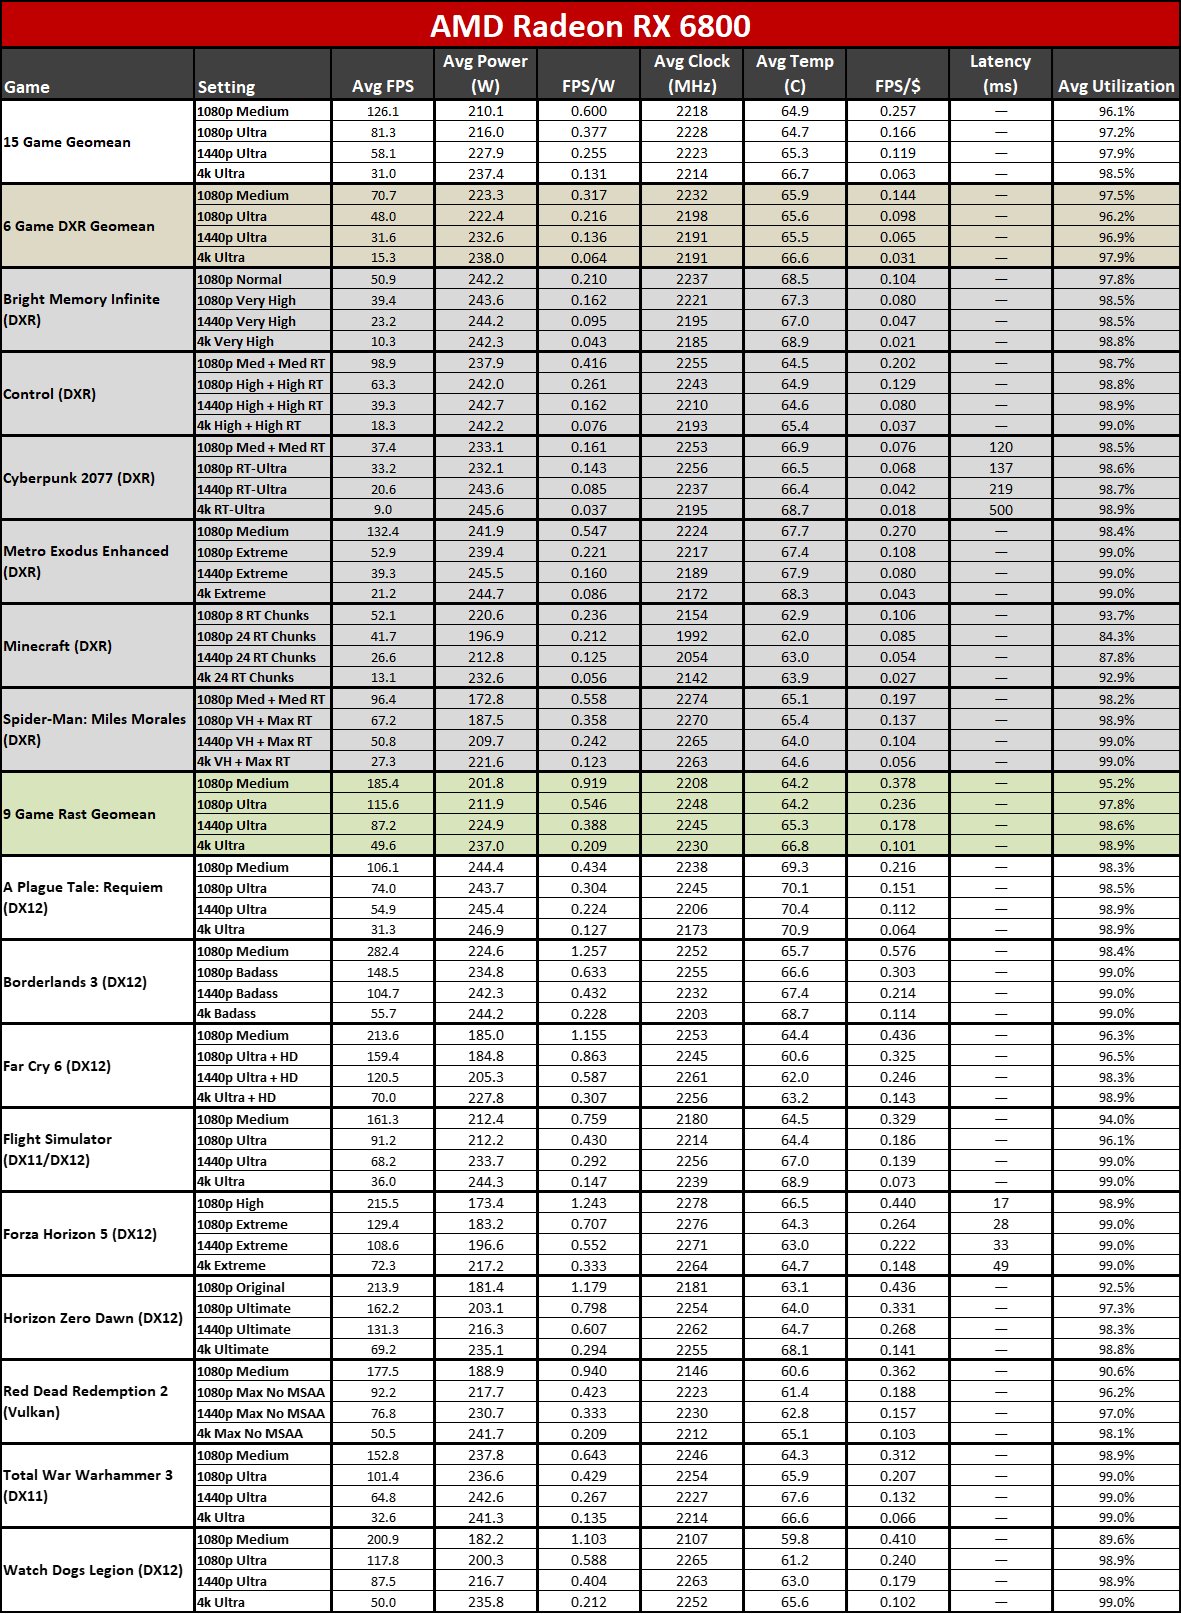
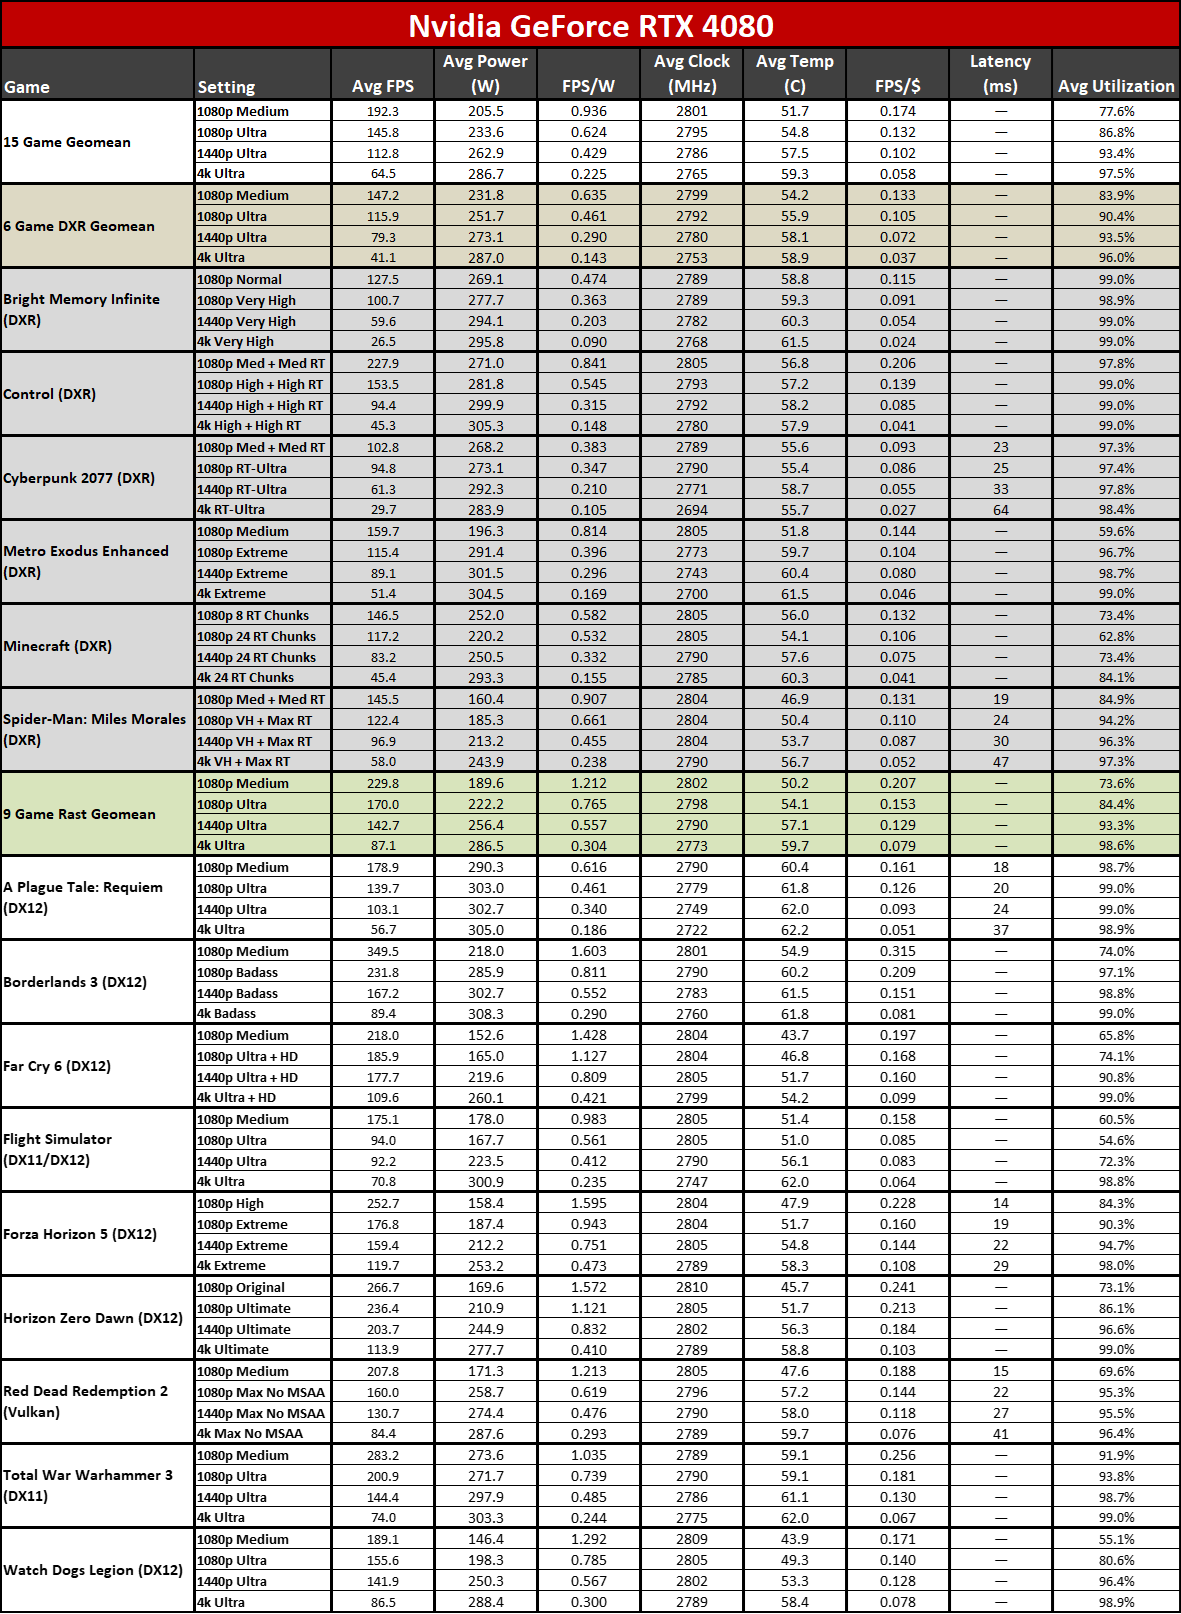
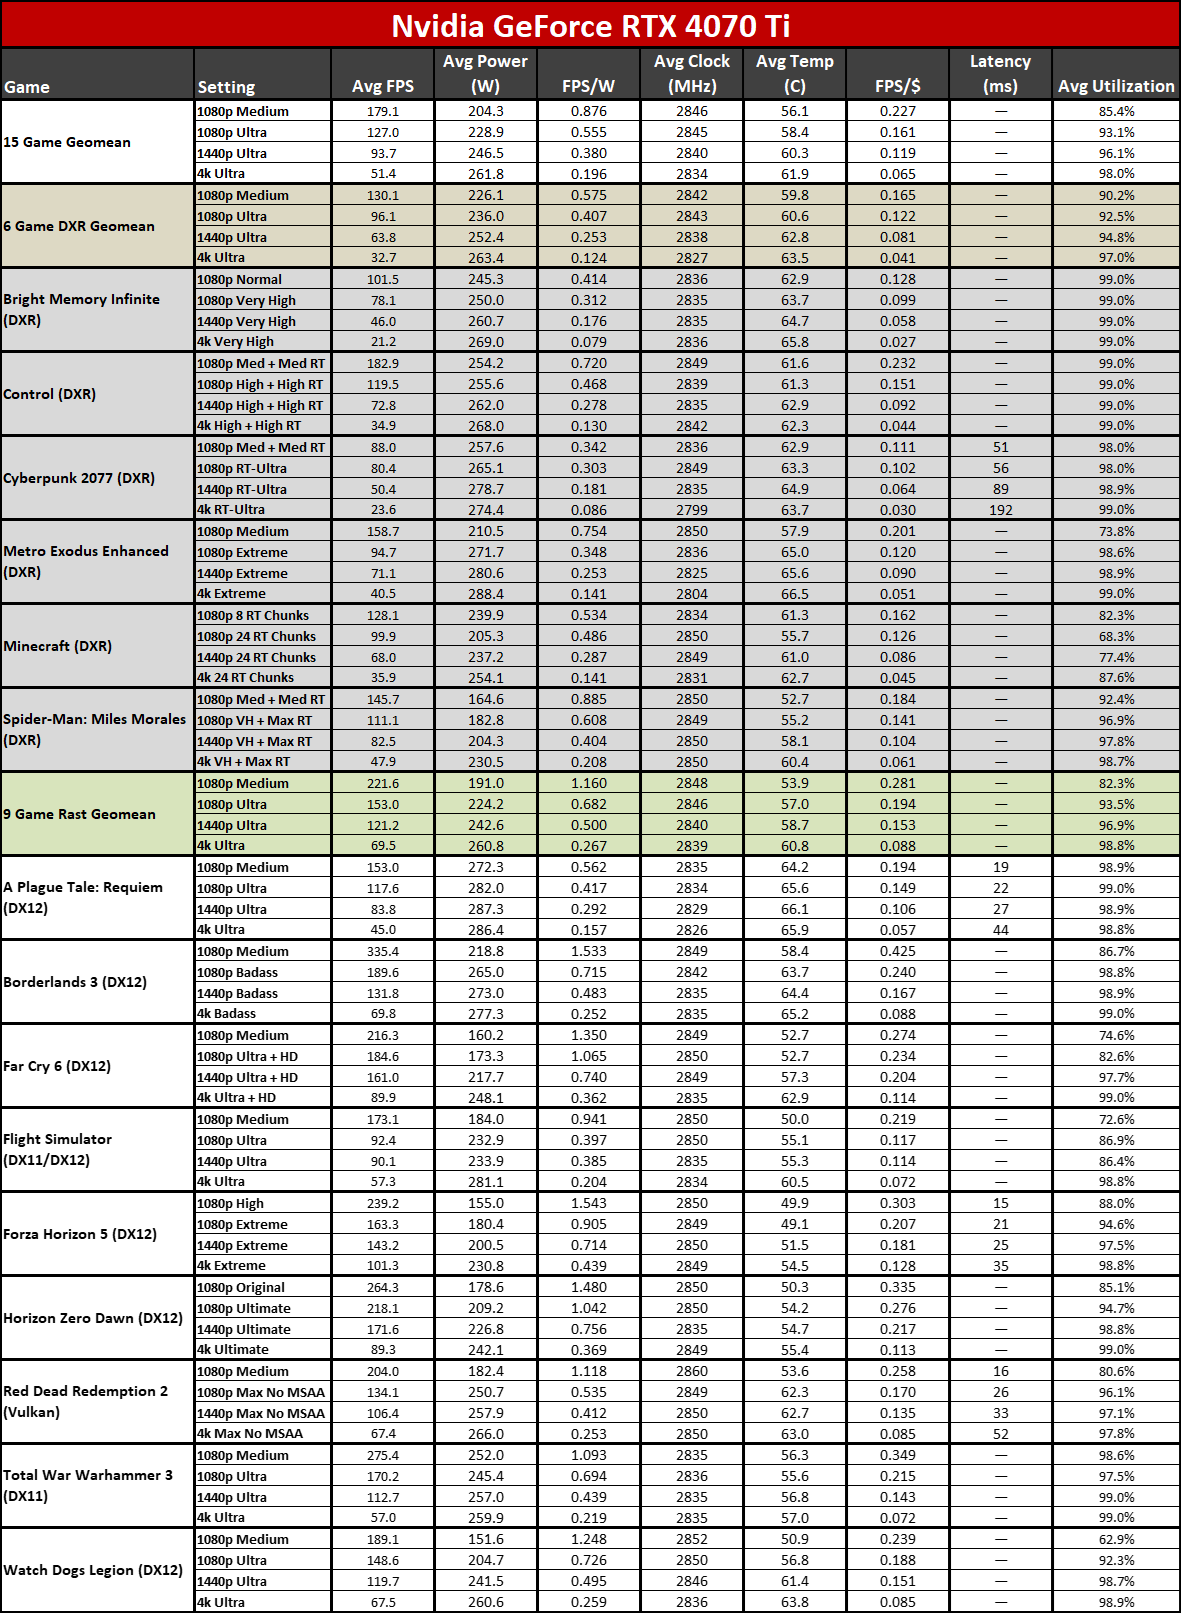
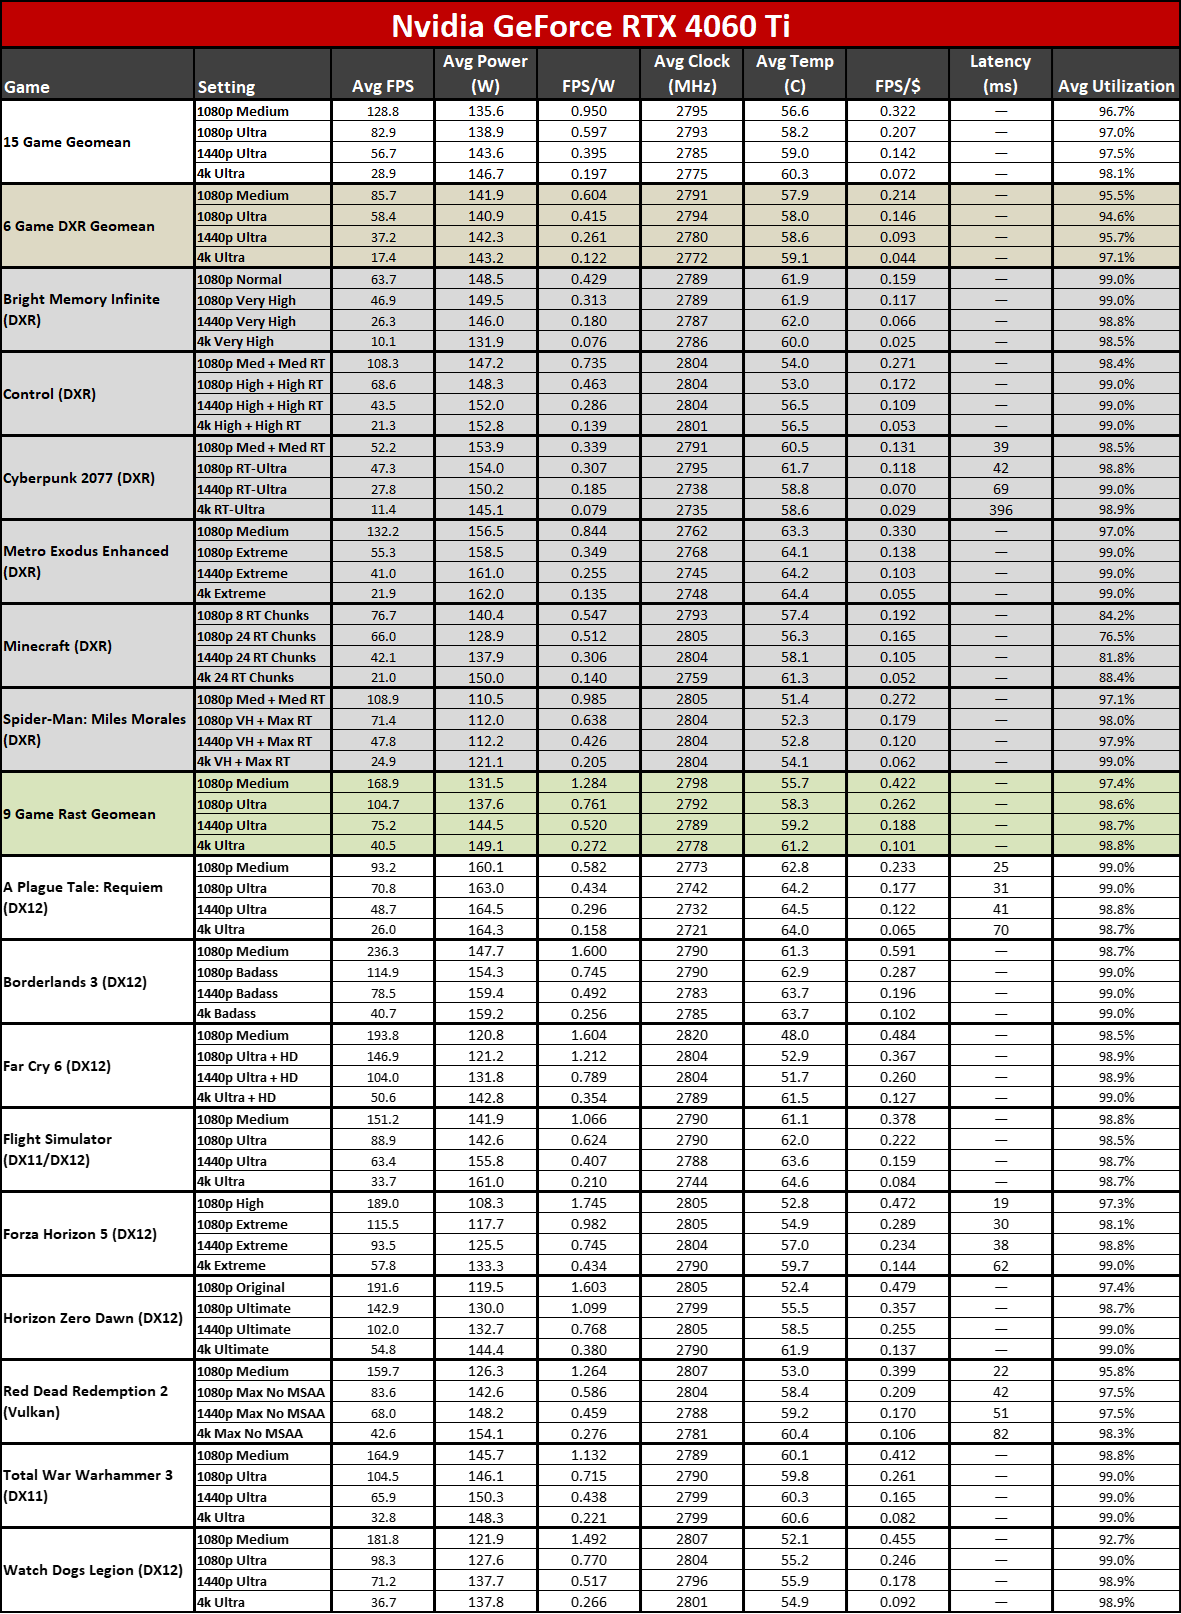
This final gallery of images shows the full performance test suite, along with the above power, clocks, and temperature information. Latency is also provided, at least in some of the games (depending on the GPU and drivers used).
We've calculated efficiency in FPS/W for the various games, plus value in FPS/$ using the best current online prices we could find (usually at Newegg or Amazon, though B&H and Best Buy were also checked). We've summarized those results in the above table (based on 1440p performance and power), sorted by overall value.
As expected, even though cards like the RTX 4060 Ti have a (perhaps deservedly) bad rap, their lower prices still make them a "better value" than the more expensive GPUs. It's the typical diminishing returns in practice. However, we should note that we're only factoring in the cost of the graphics card. If you were to include a decent high-end PC, that changes the equation a lot. That's what the "PC FPS/$" column at the far right.
For the system cost, we used a Core i7-13700K, Arctic Freezer II 240 cooler, ASRock Z790 PG Lightning motherboard, 32GB G.Skill DDR5-6400 CL32 memory, Solidigm P44 Pro 2TB SSD, Phanteks Eclipse P400A case, and Phanteks Revolt Pro 850W gold PSU. Combined, those cost $1,074 at the time of writing. For a complete PC, the "best value" (in quotes because there's an element of subjectivity involved) switches to the most expensive RTX 4080 first, then the RTX 4070 Ti, followed by the RX 7900 XTX and RX 7900 XT. Food for thought if you're planning a complete system update!
Efficiency also puts the RTX 4080 in first, followed by the RTX 4070, RTX 4060 Ti, RTX 4070 Ti, and then finally the RX 7900 XT (reference card). Sapphire's GPU ranks two steps lower, just behind the RX 7900 XTX, thanks to its higher power draw. There's still a decent gap in efficiency between it and the RX 6800, however, which was the highest efficiency GPU from AMD's RX 6000-series.
- MORE: Best Graphics Cards
- MORE: GPU Benchmarks and Hierarchy
- MORE: All Graphics Content
Get Tom's Hardware's best news and in-depth reviews, straight to your inbox.
Current page: Sapphire RX 7900 XT: Power, Clocks, Temps, and Noise
Prev Page Sapphire RX 7900 XT: 4K Gaming Performance Next Page Sapphire RX 7900 XT: Sounds Good
Jarred Walton is a senior editor at Tom's Hardware focusing on everything GPU. He has been working as a tech journalist since 2004, writing for AnandTech, Maximum PC, and PC Gamer. From the first S3 Virge '3D decelerators' to today's GPUs, Jarred keeps up with all the latest graphics trends and is the one to ask about game performance.
