Why you can trust Tom's Hardware
We measure real-world power consumption using Powenetics testing hardware and software. We capture in-line GPU power consumption by collecting data while looping Metro Exodus (the original, not the enhanced version) and while running the FurMark stress test. We also check noise levels using an SPL meter. Our test PC remains the same old Core i9-9900K as we've used previously, to keep results consistent.
We also test on our newer 13900K PC using PCAT v2 hardware in all of our gaming benchmarks, which gives a wider view of power use and efficiency. We'll start with the gallery of our PCAT results — note that FPS/$ uses the official MSRPs for the RX 7000- and RTX 40-series cards, while FPS/W (ie, efficiency) uses the measured power consumption.
We have results for our 1440p and 4K testing, along with the manually overclocked 4K testing, except on the RTX 4080. That was originally reviewed on our previous i9-12900K test PC, and while we retested standard performance on the 13900K system, we didn't retest with overclocking, so those lines are blank (but we left them in place so the images are all the same dimensions).
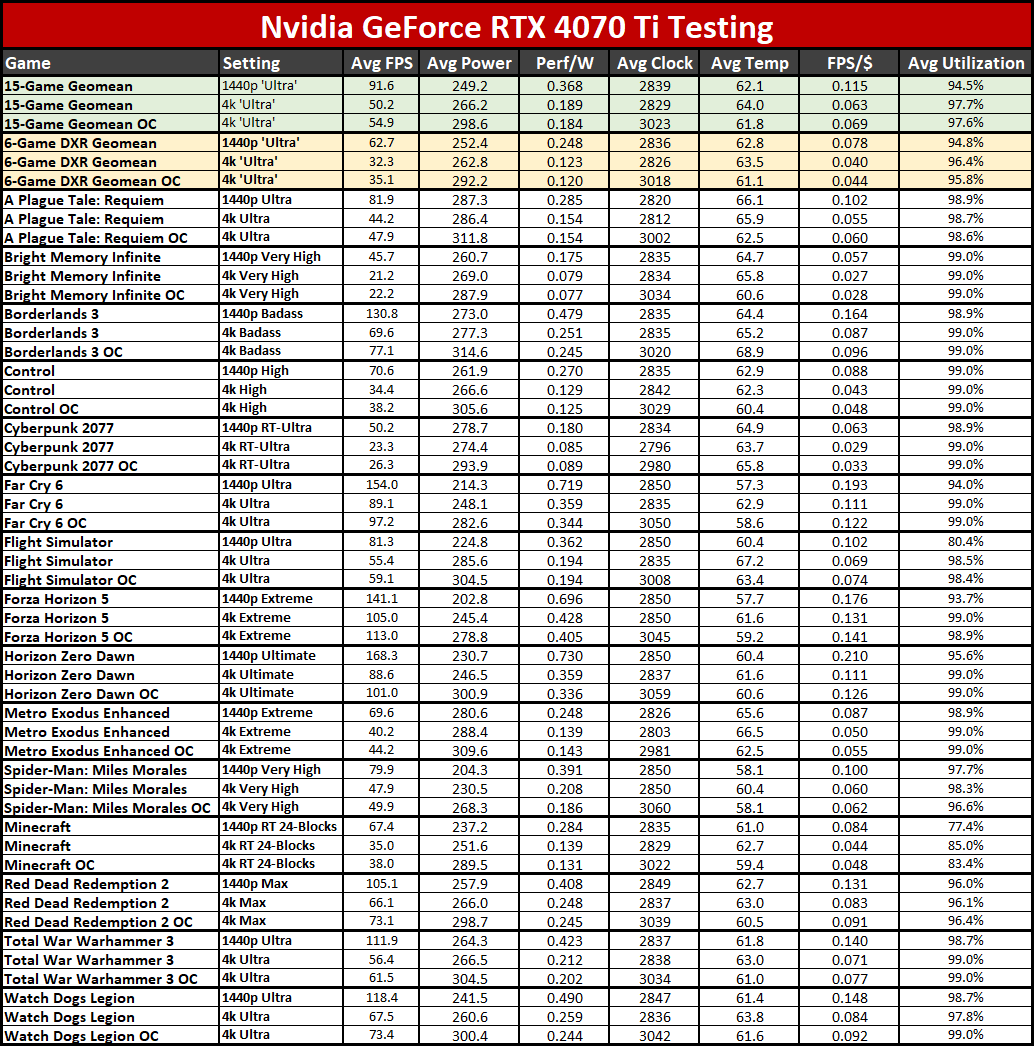
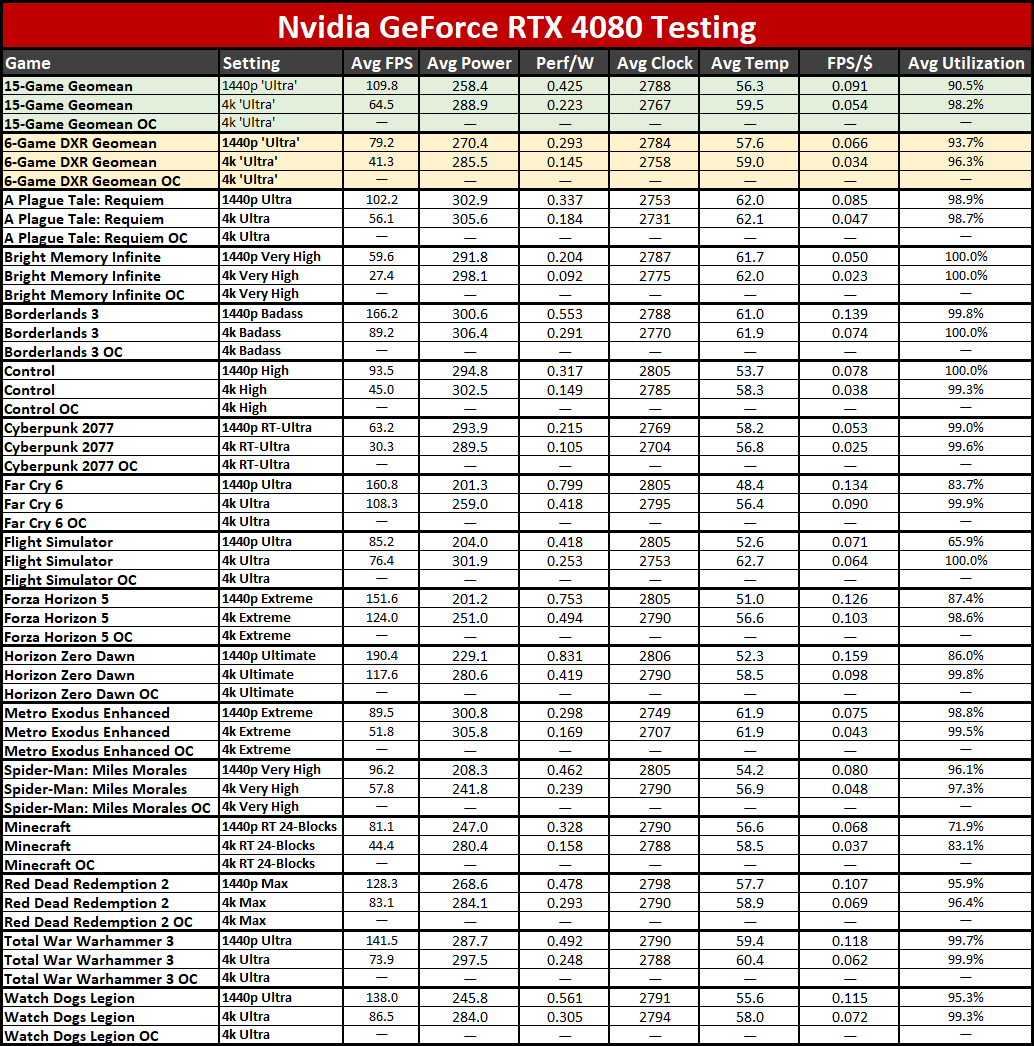
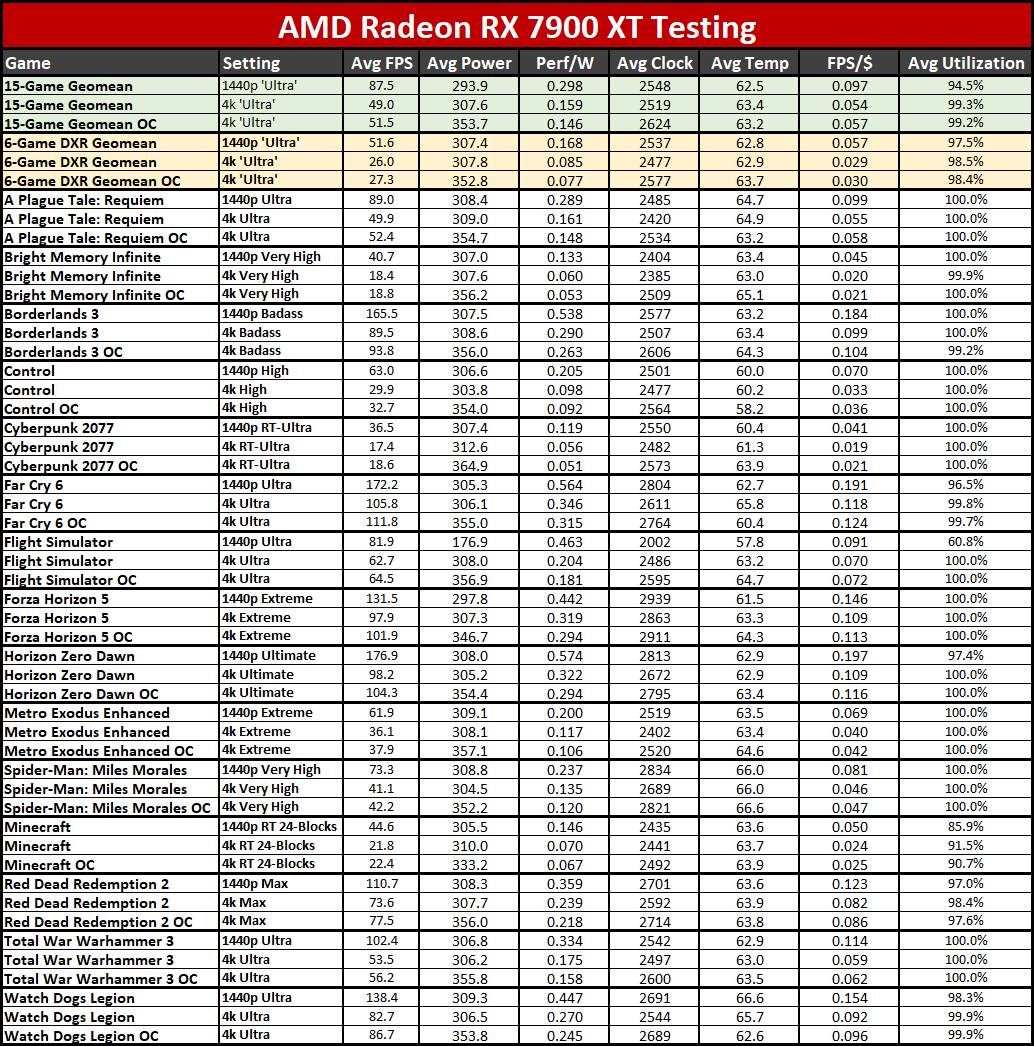
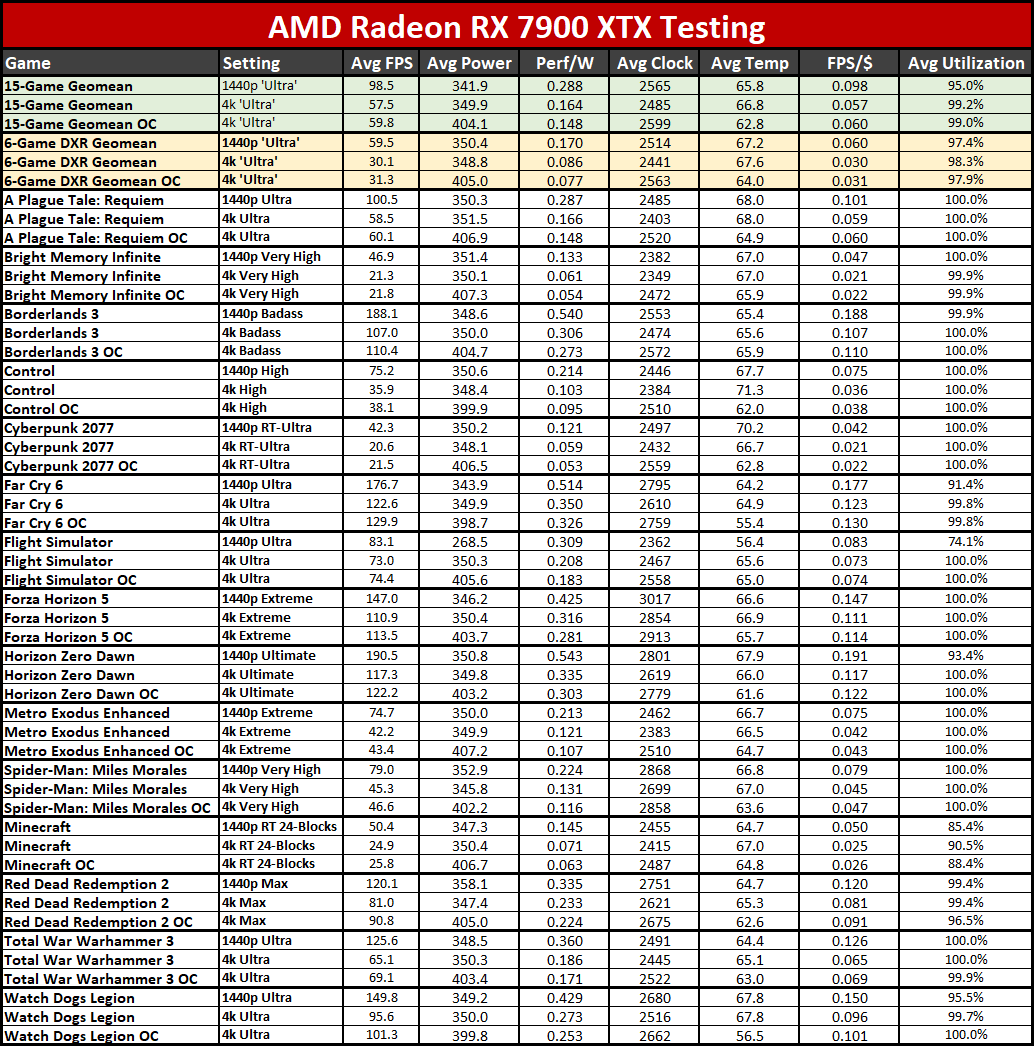
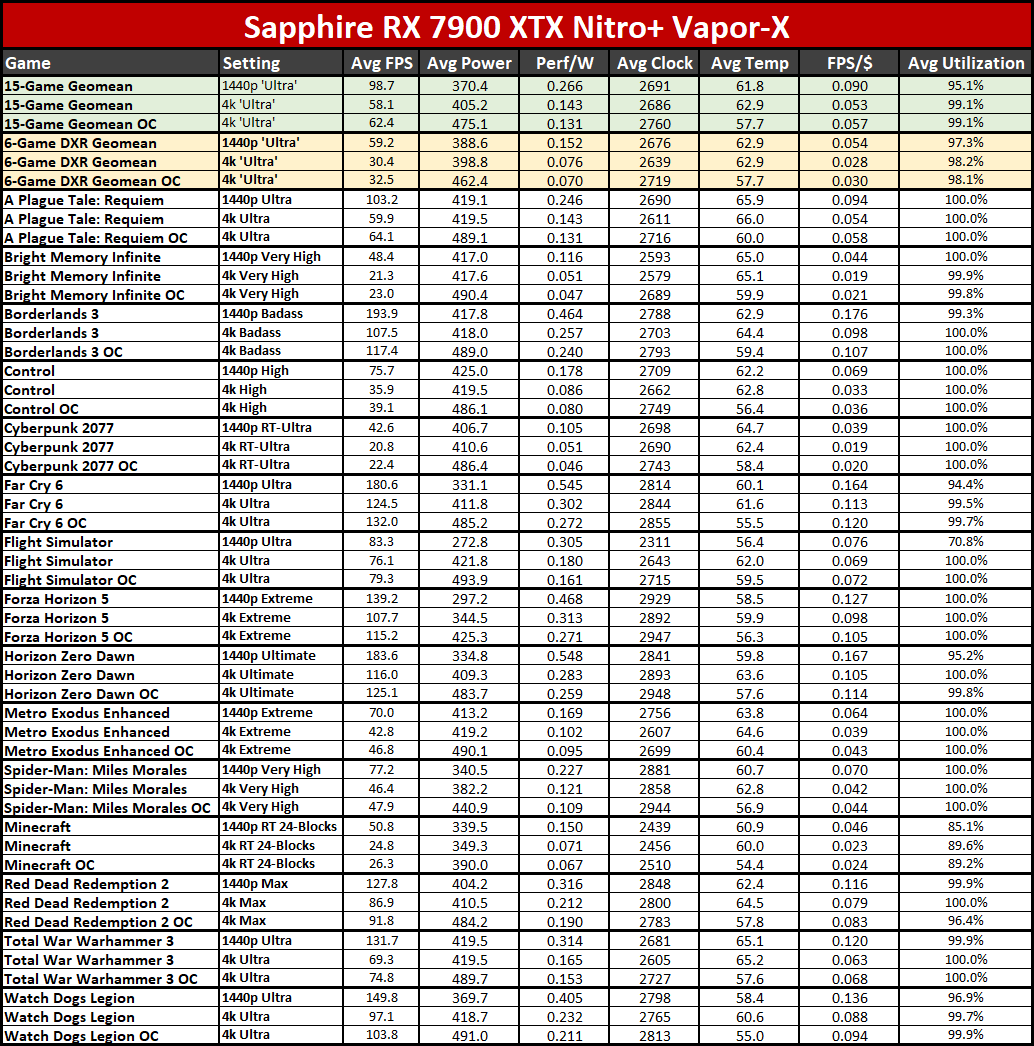
There's a lot to parse in the above tables, but if we just focus on the Sapphire card for the time being, what you'll see is that performance per watt and performance per dollar both drop compared to the reference card. That's no surprise, since the Sapphire card consumes more power, costs more, and offers a barely measurable change in performance in most of our testing.
Looking at the bigger picture, the RTX 4080 delivers the best efficiency out of the cards we've tested so far, while the RTX 4070 Ti offers the best "value" in terms of FPS per dollar. That's not to say it's a great value, or that other cards like the RX 6650 XT wouldn't beat it (we haven't retested that on the new PC yet), but of the latest generation GPUs, the RTX 4070 Ti delivers slightly more FPS per dollar spent — and it would have done much better if it had inherited the RTX 3070 Ti price!
Of course, that's predicated on any of the cards being available at MSRP. Newegg does list a couple of RTX 4070 Ti cards at $799.99, in stock, and the same goes for the RX 7900 XT, with the XFX reference model actually priced $20 below MSRP right now. The RTX 4080 starts at $1,269.99 (there's a PNY model that's also backordered at MSRP). The RX 7900 XTX meanwhile starts over $400 above MSRP, making it far and away the worst value at present.
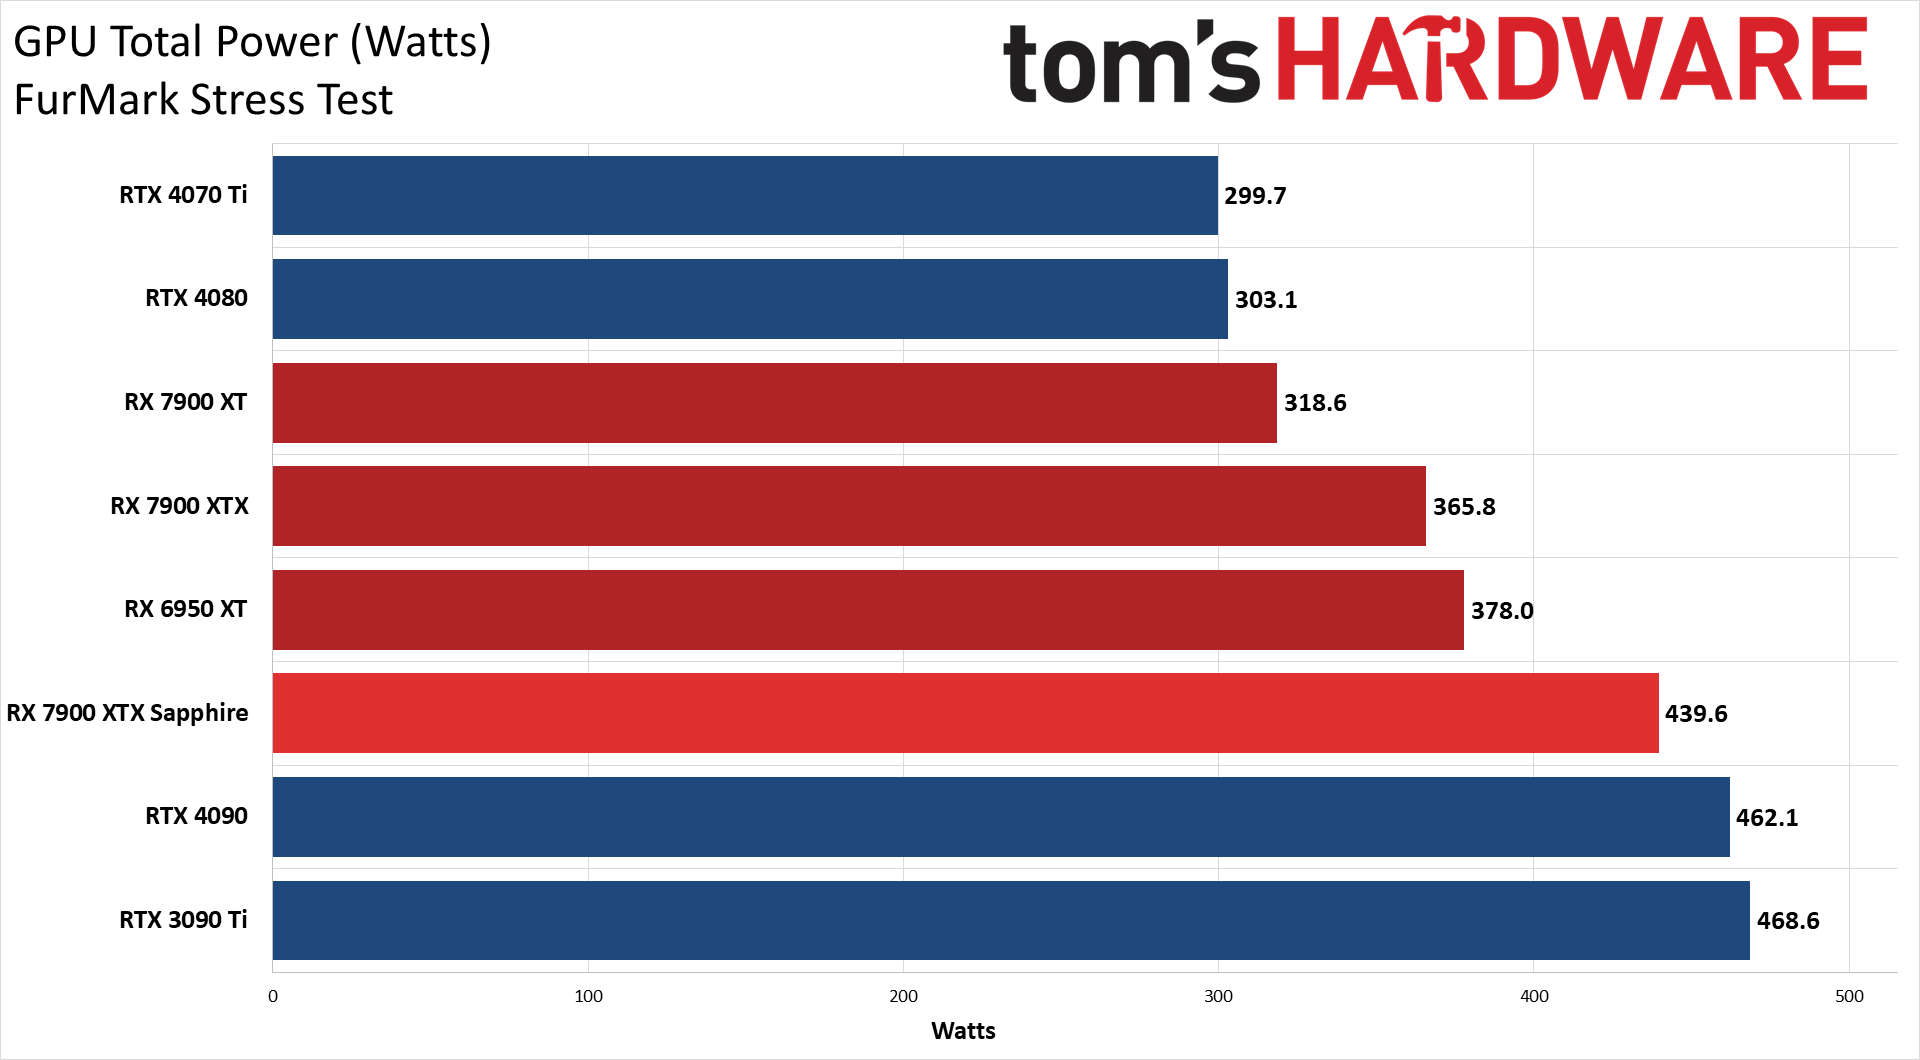
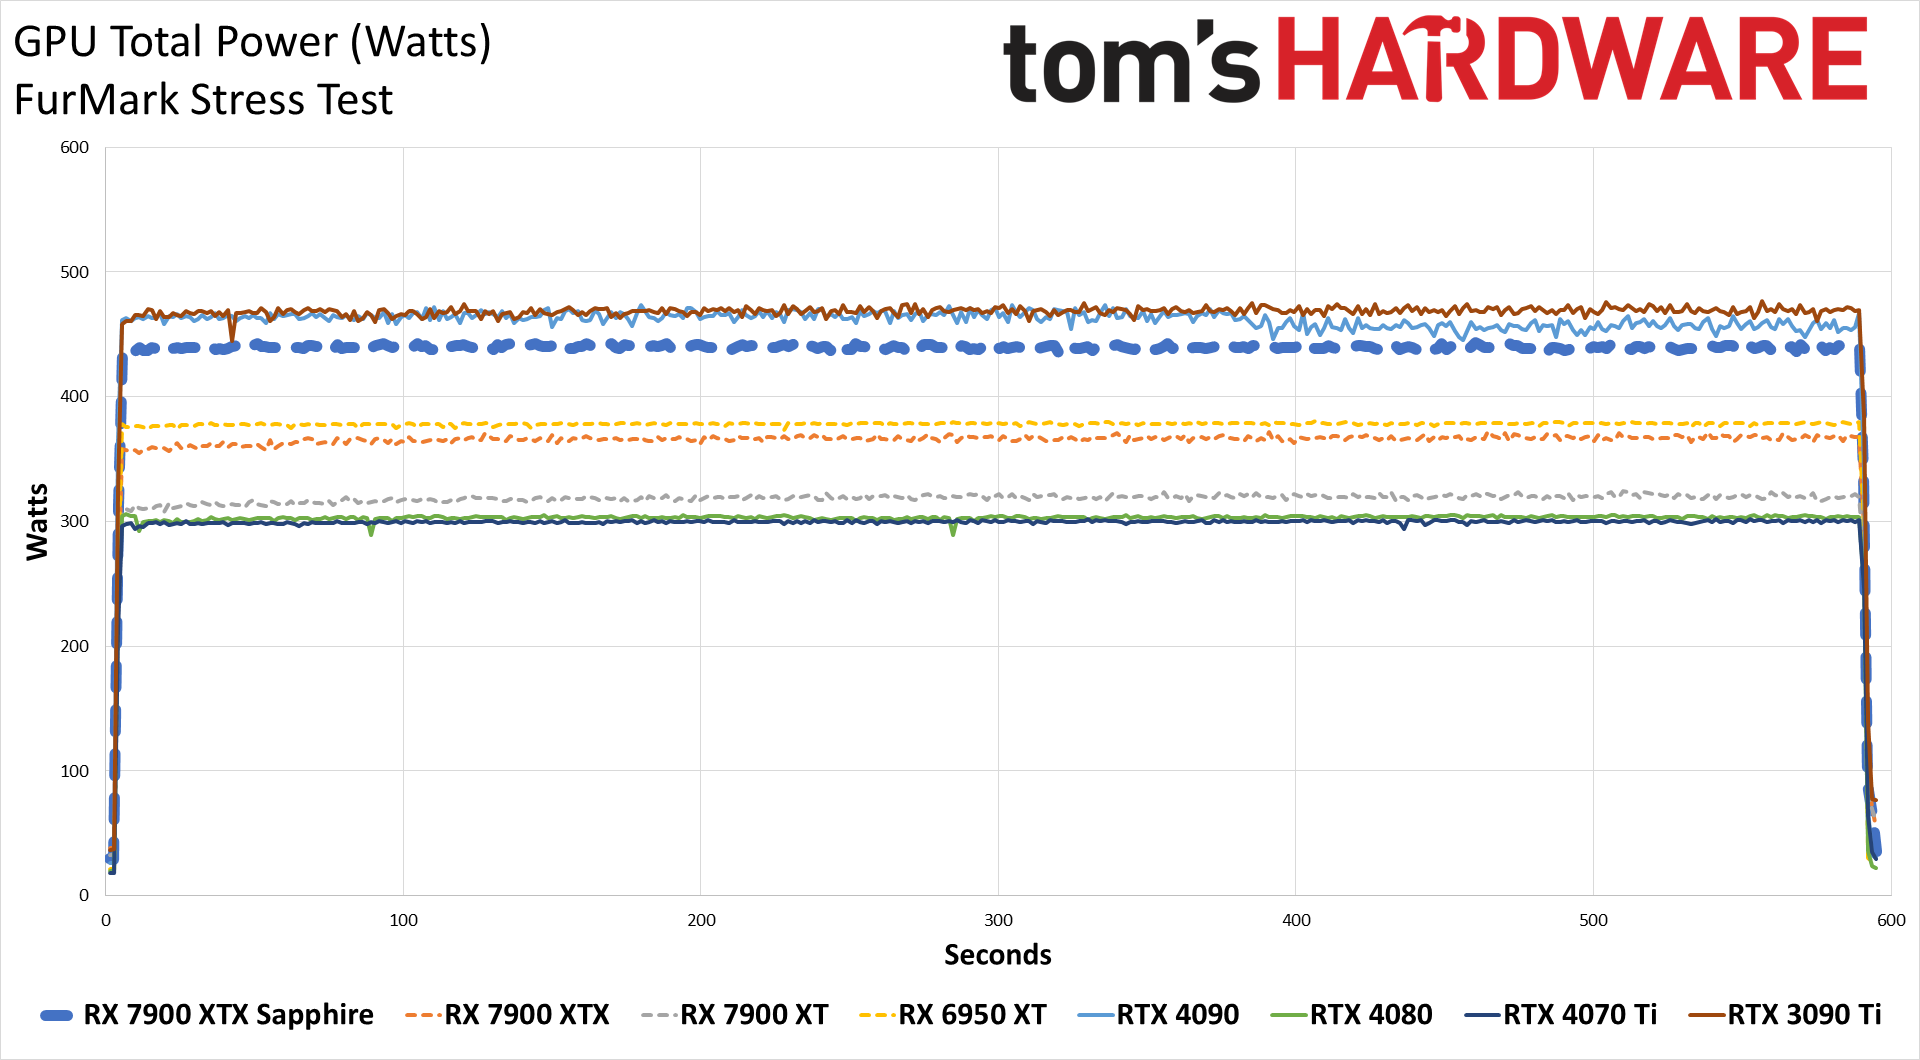
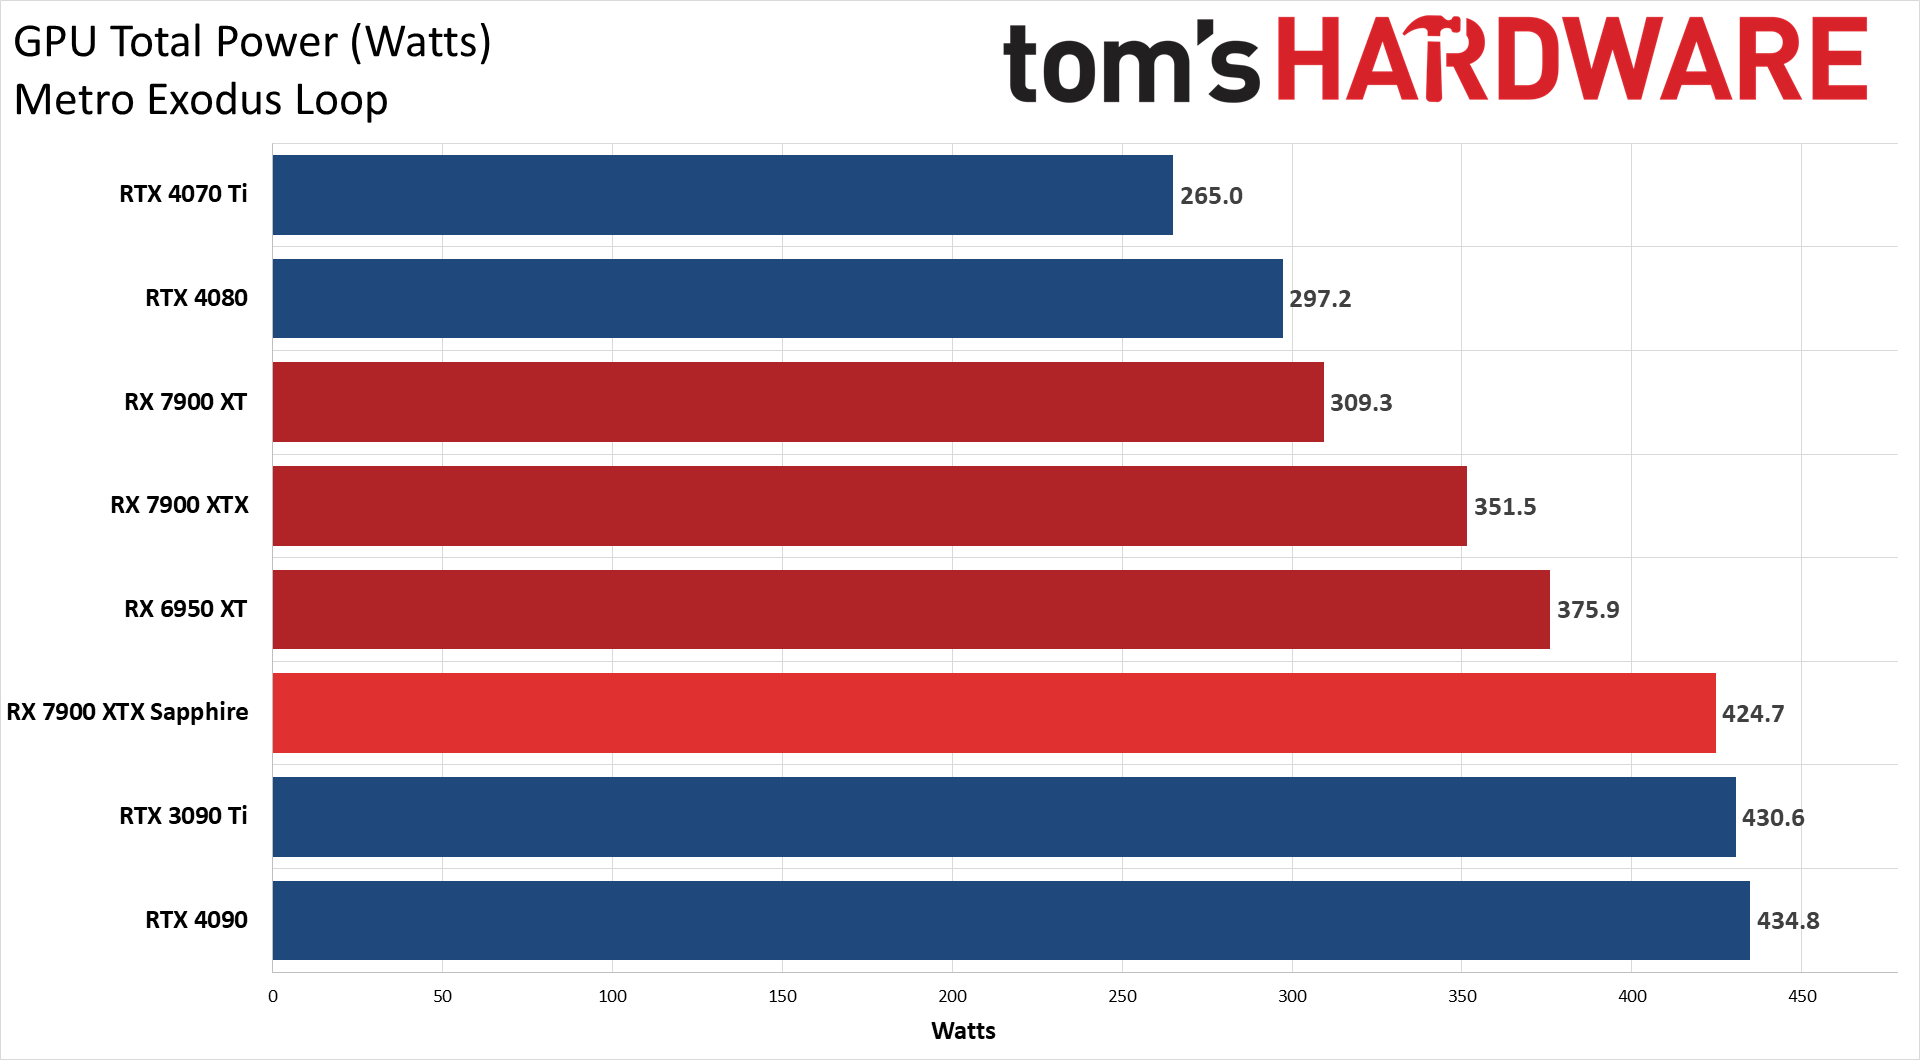
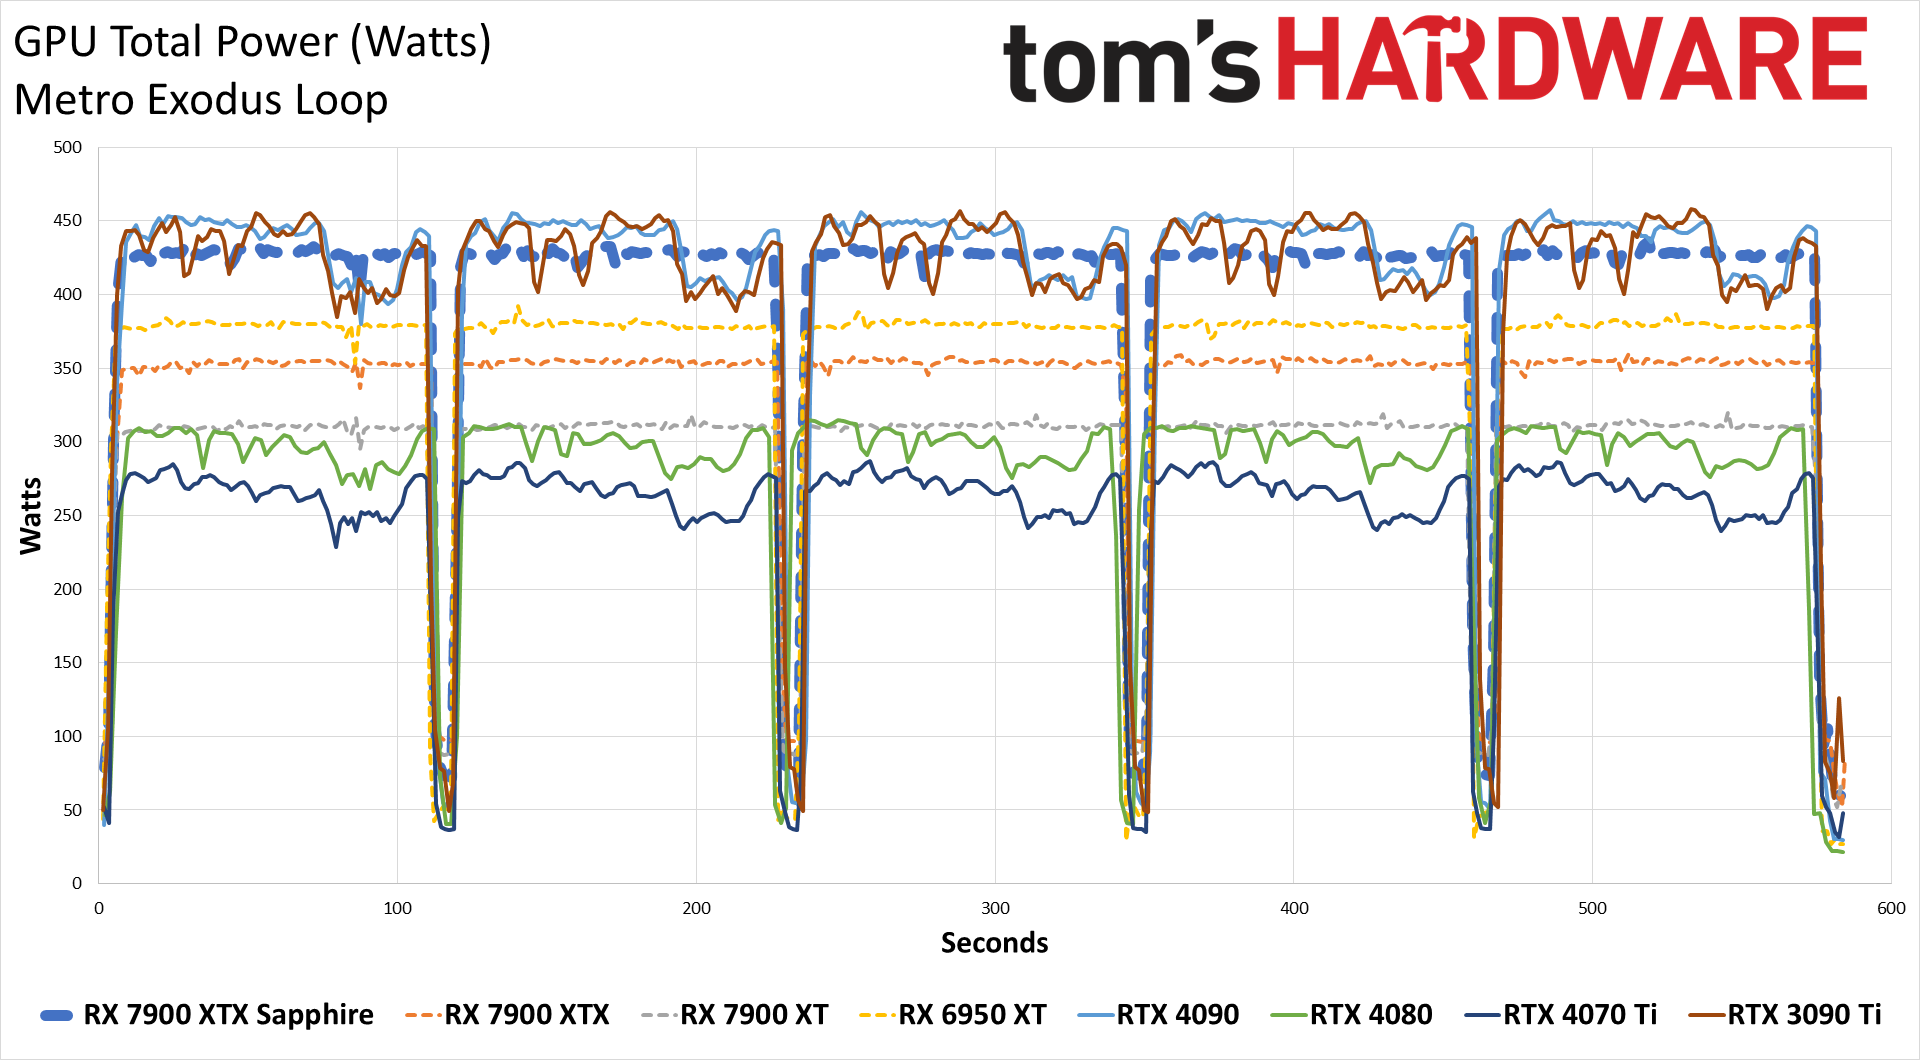
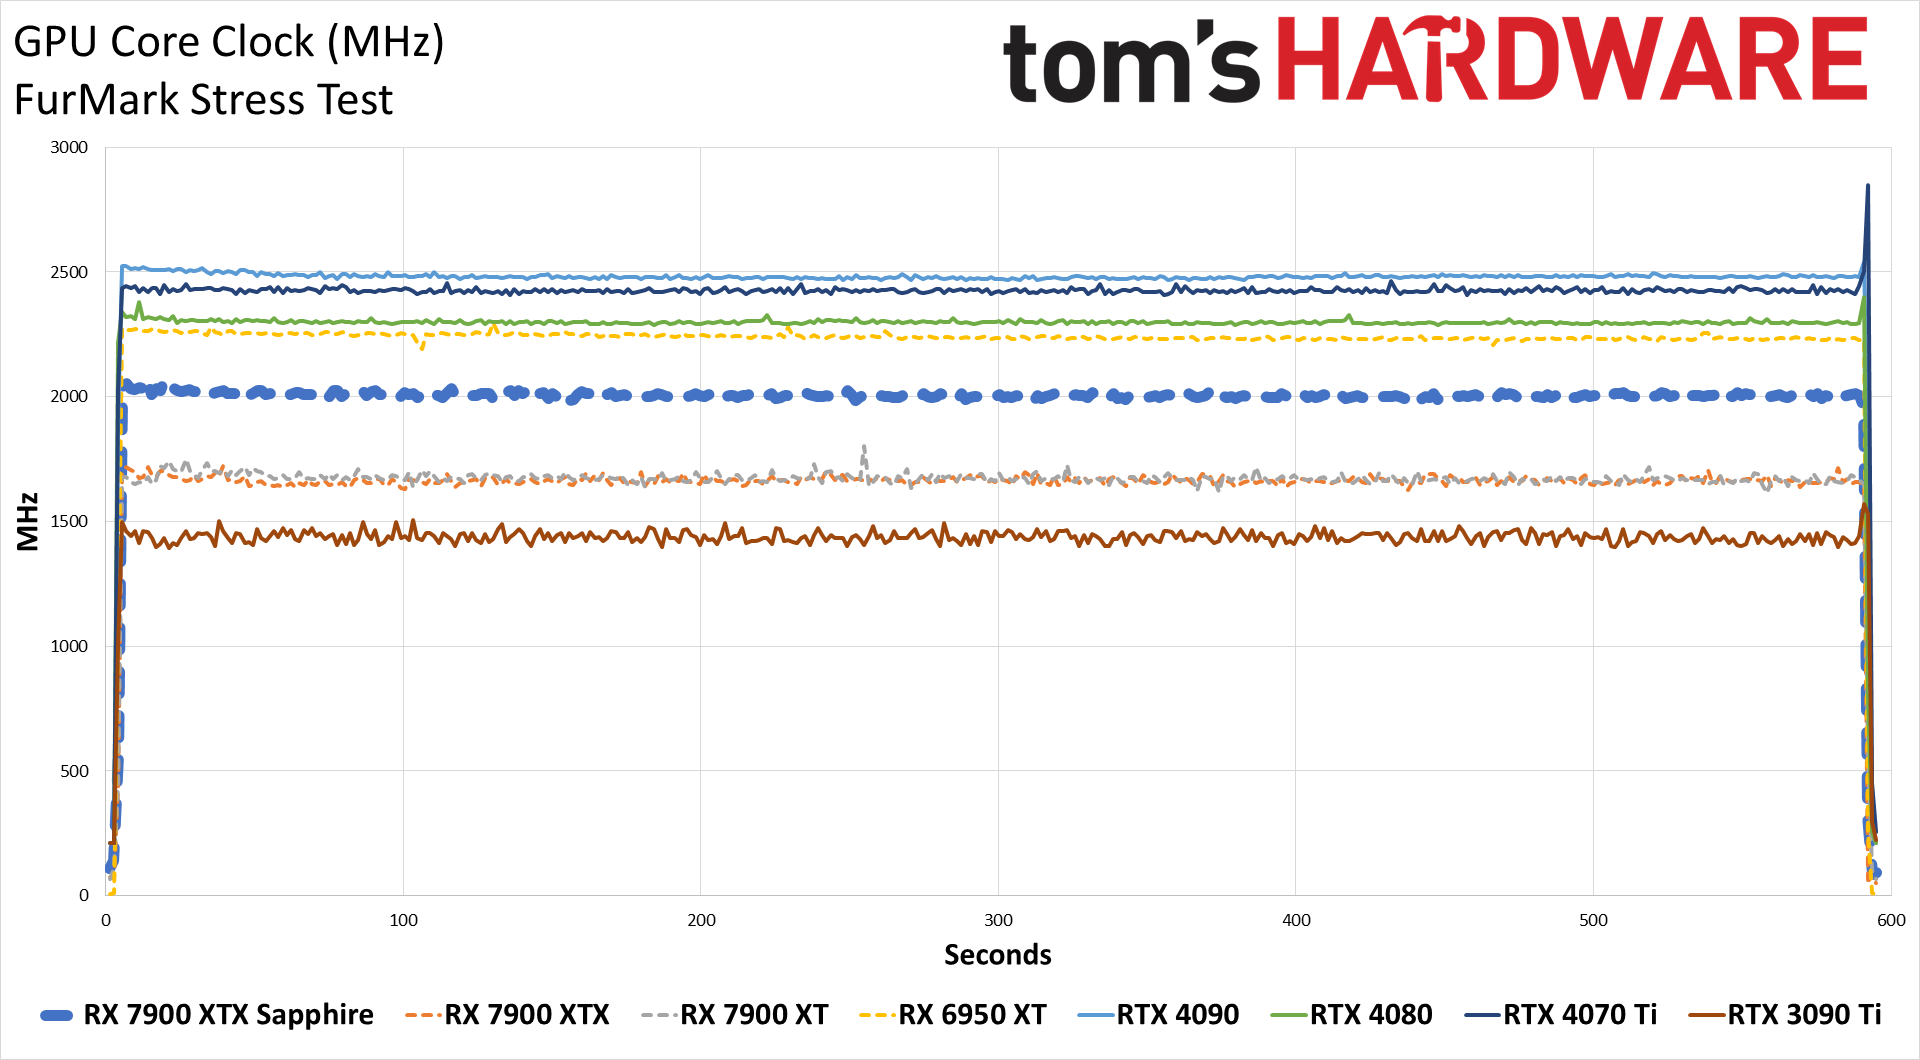
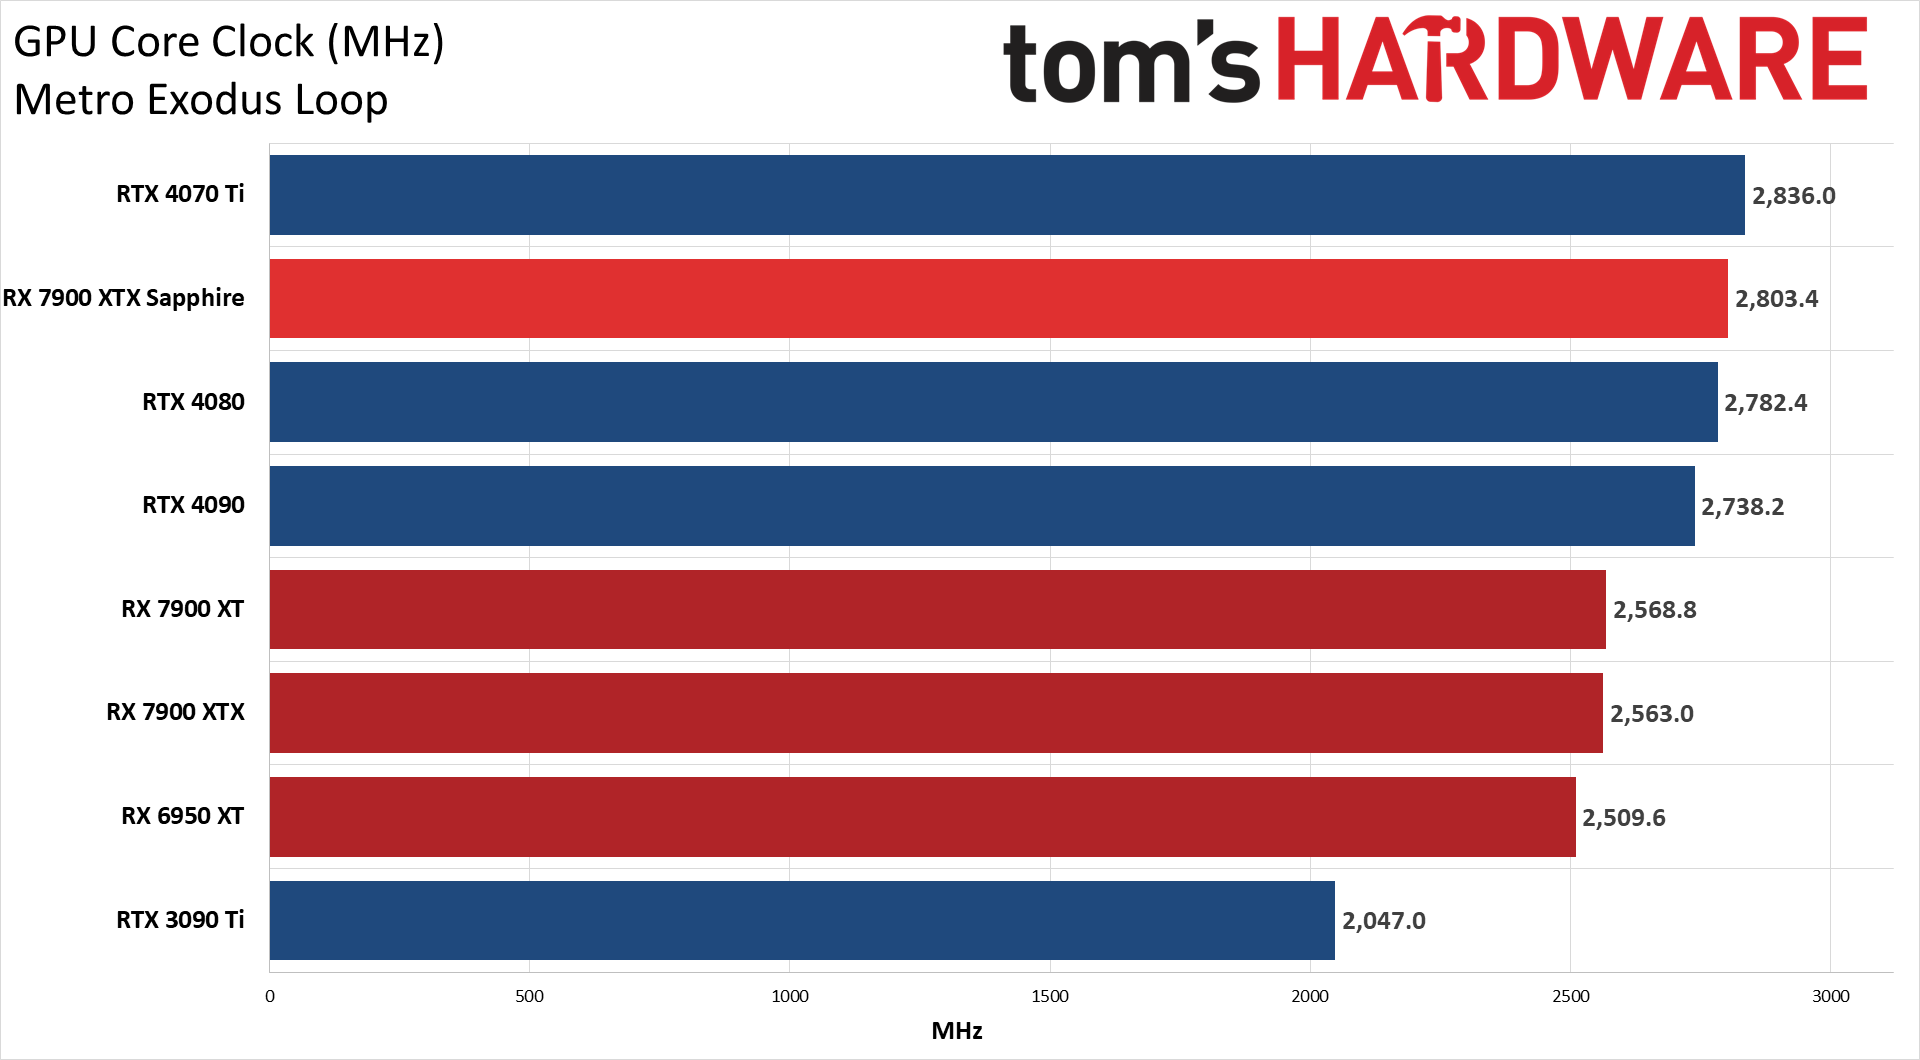
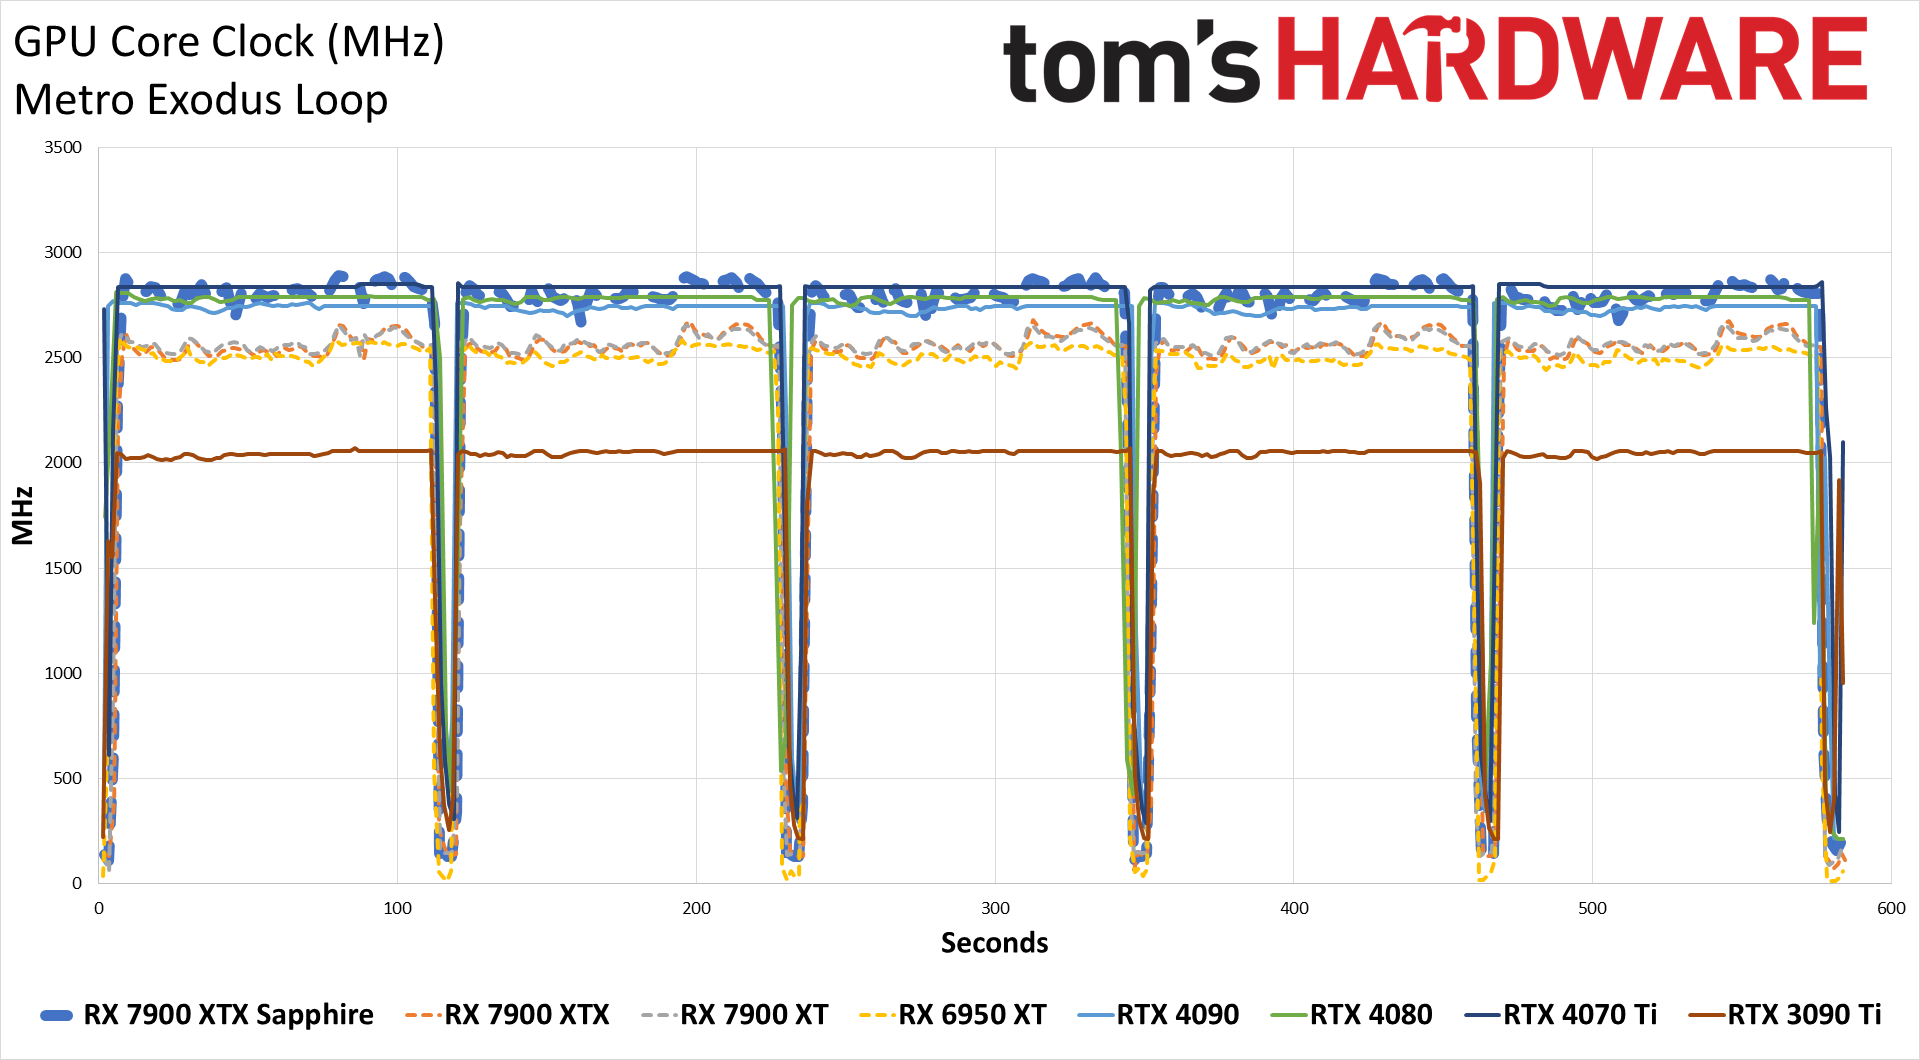
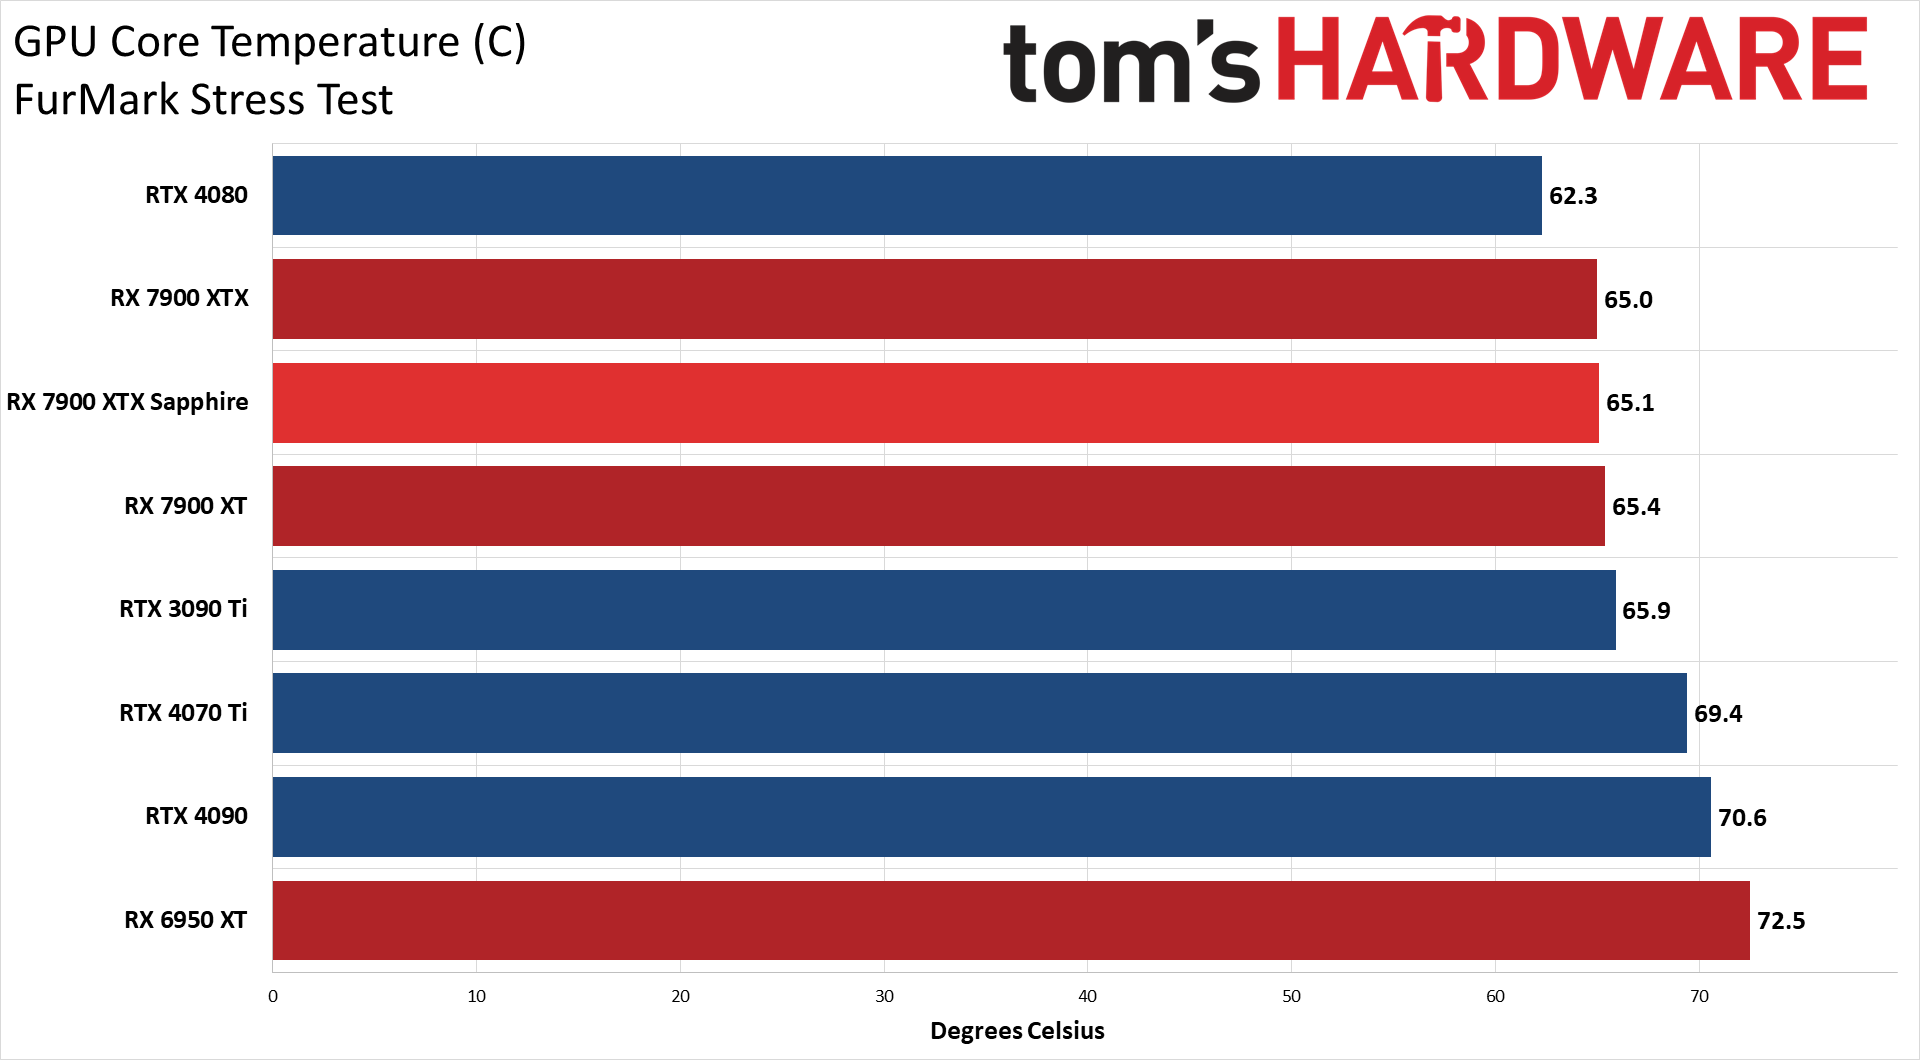
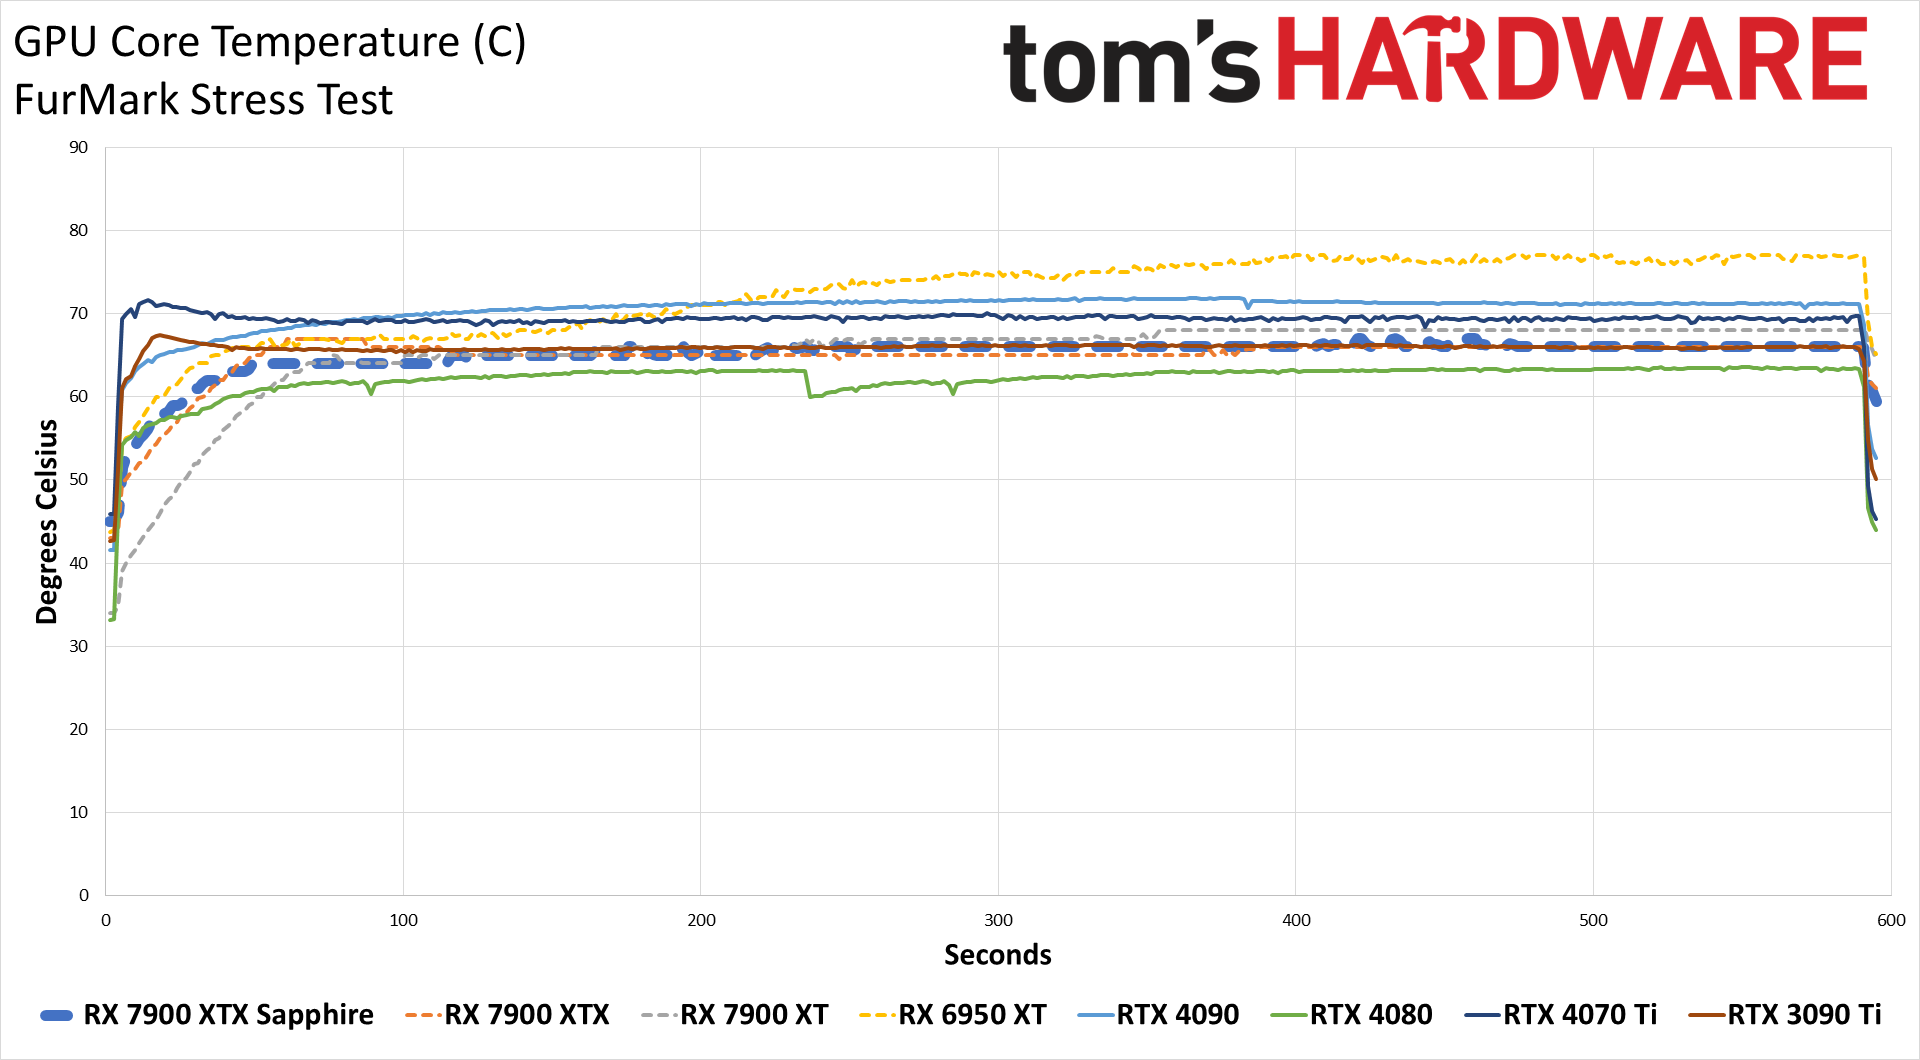
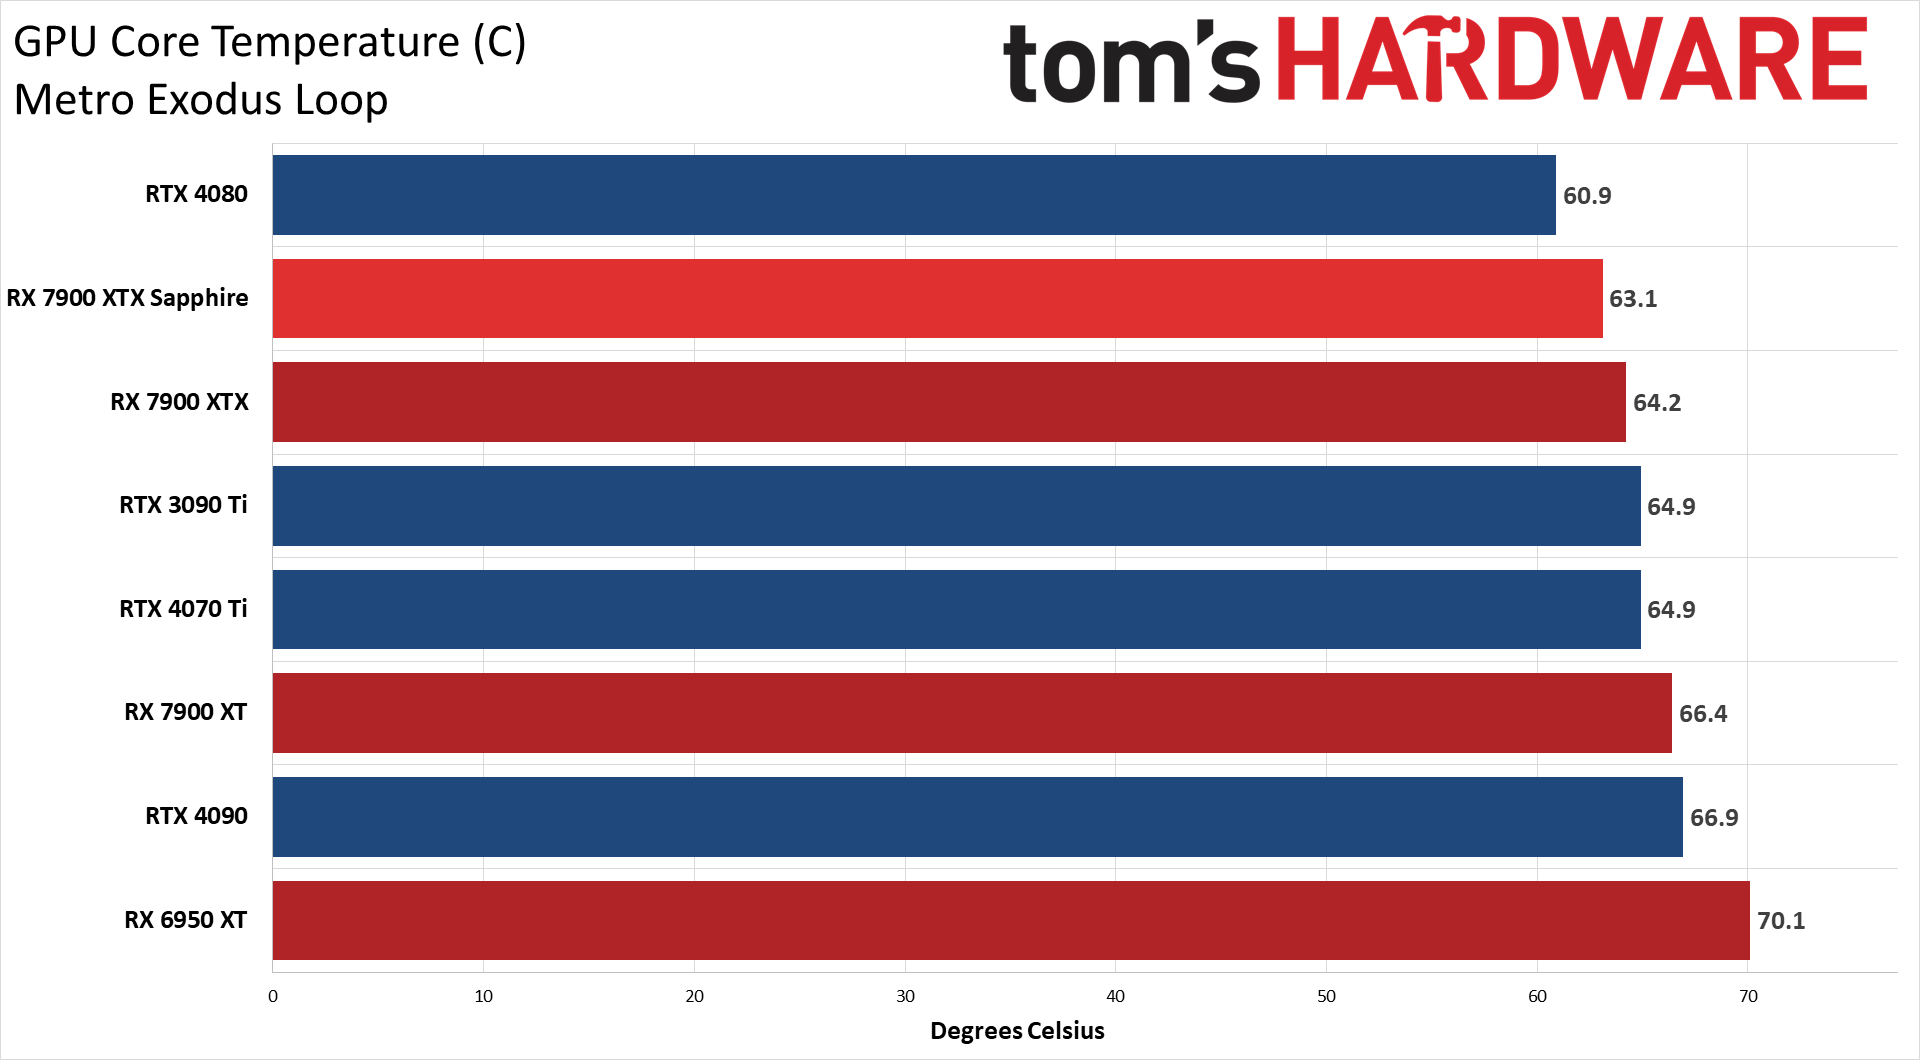
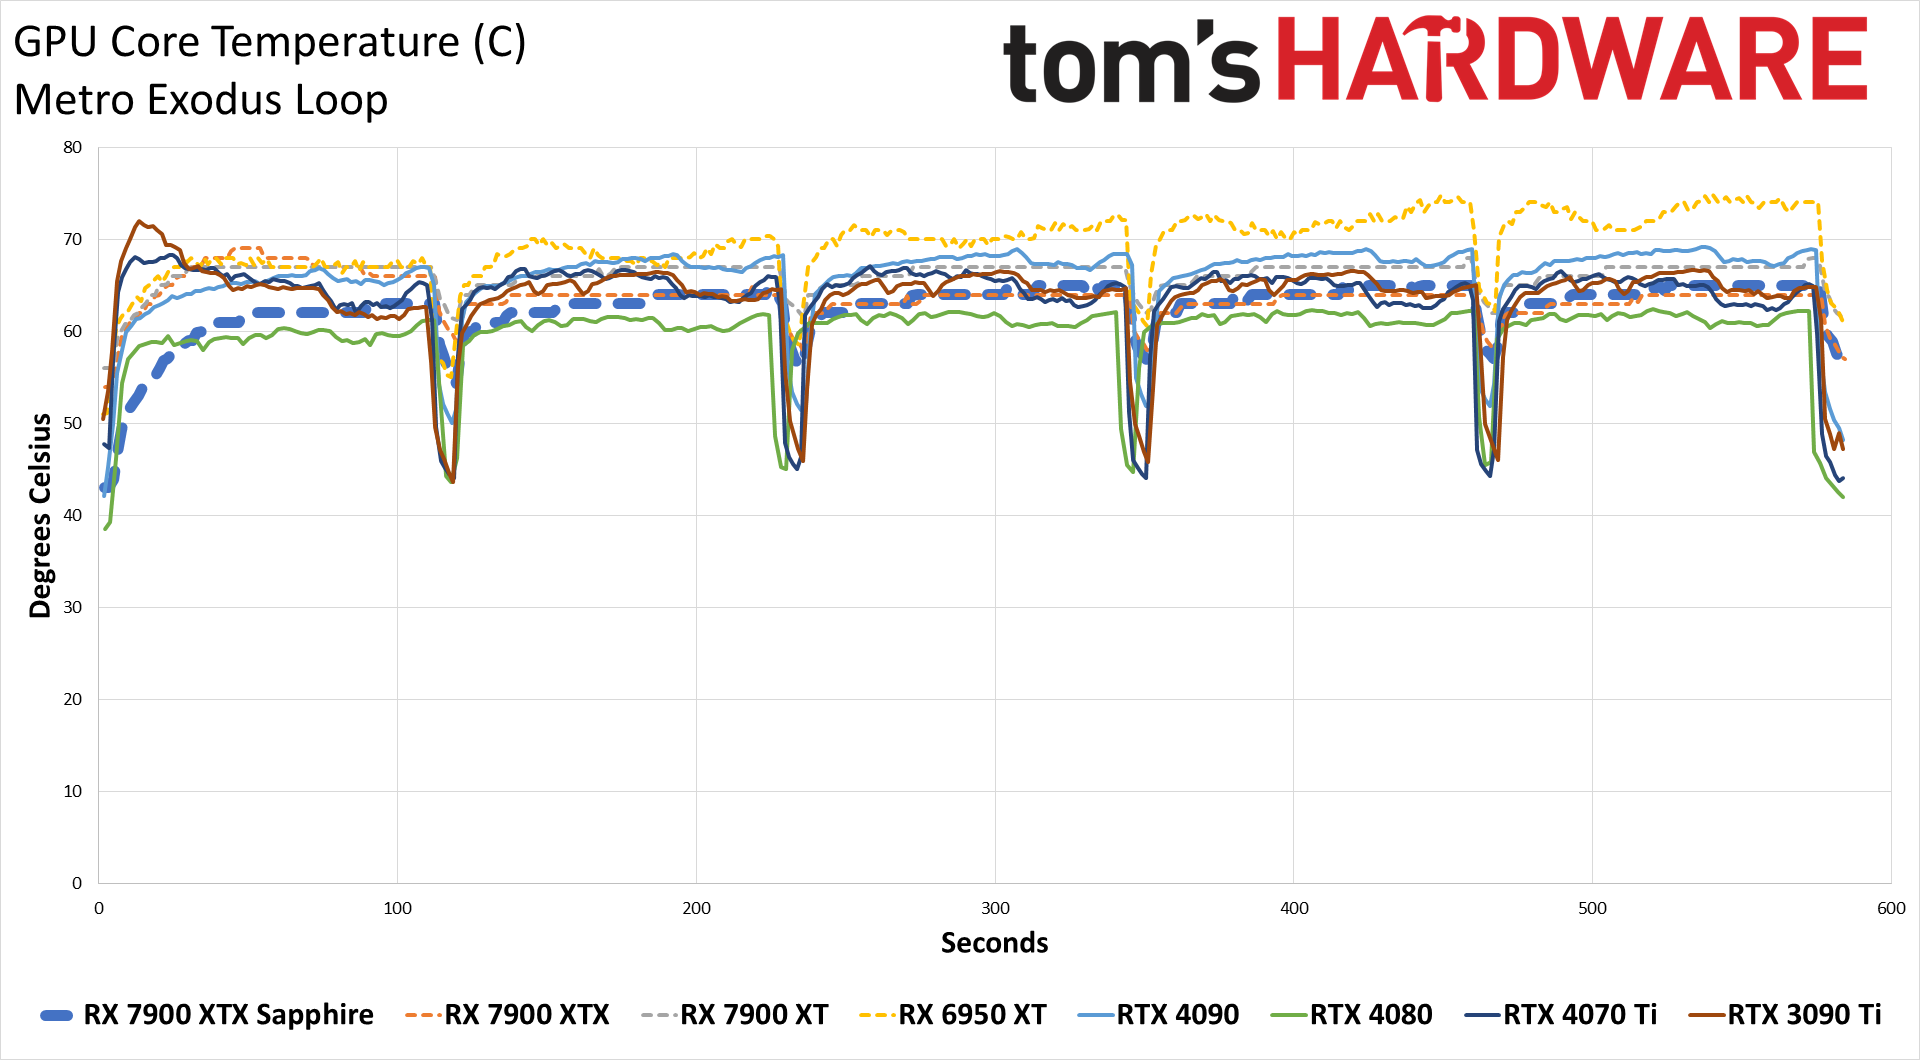
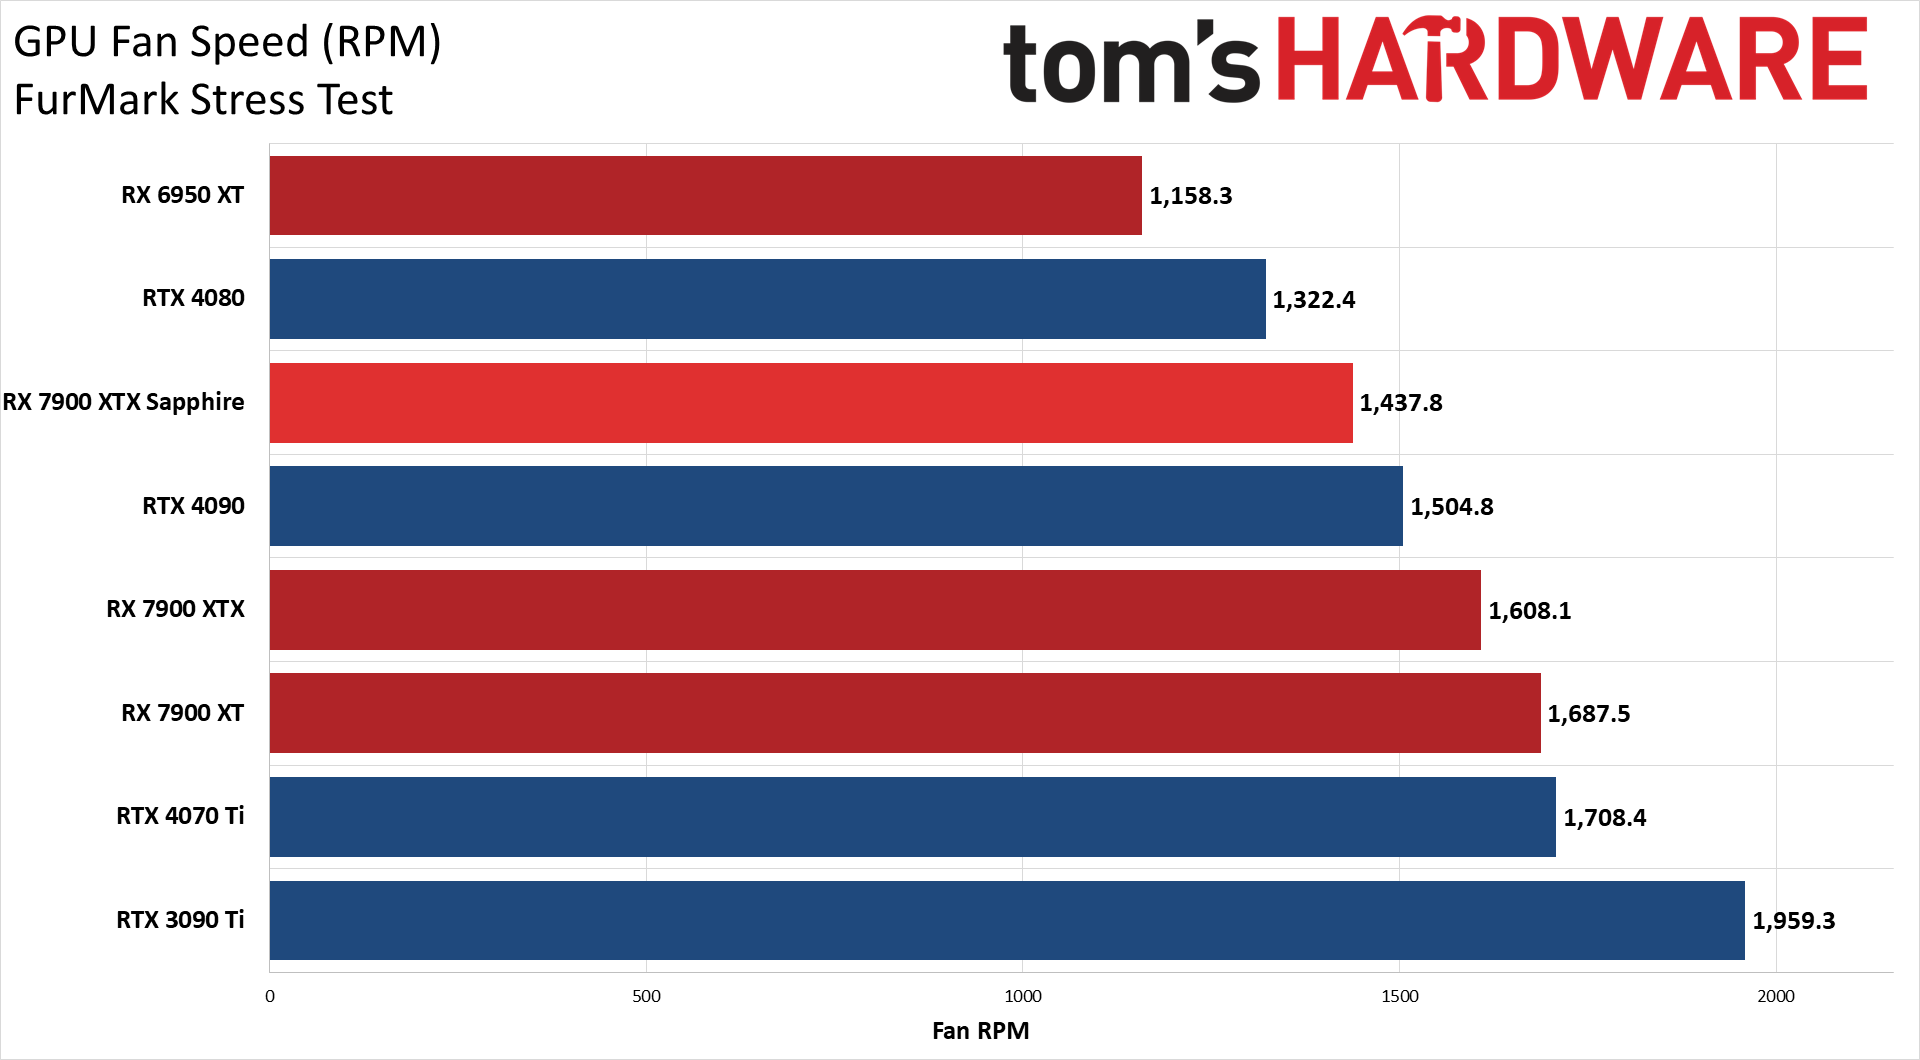
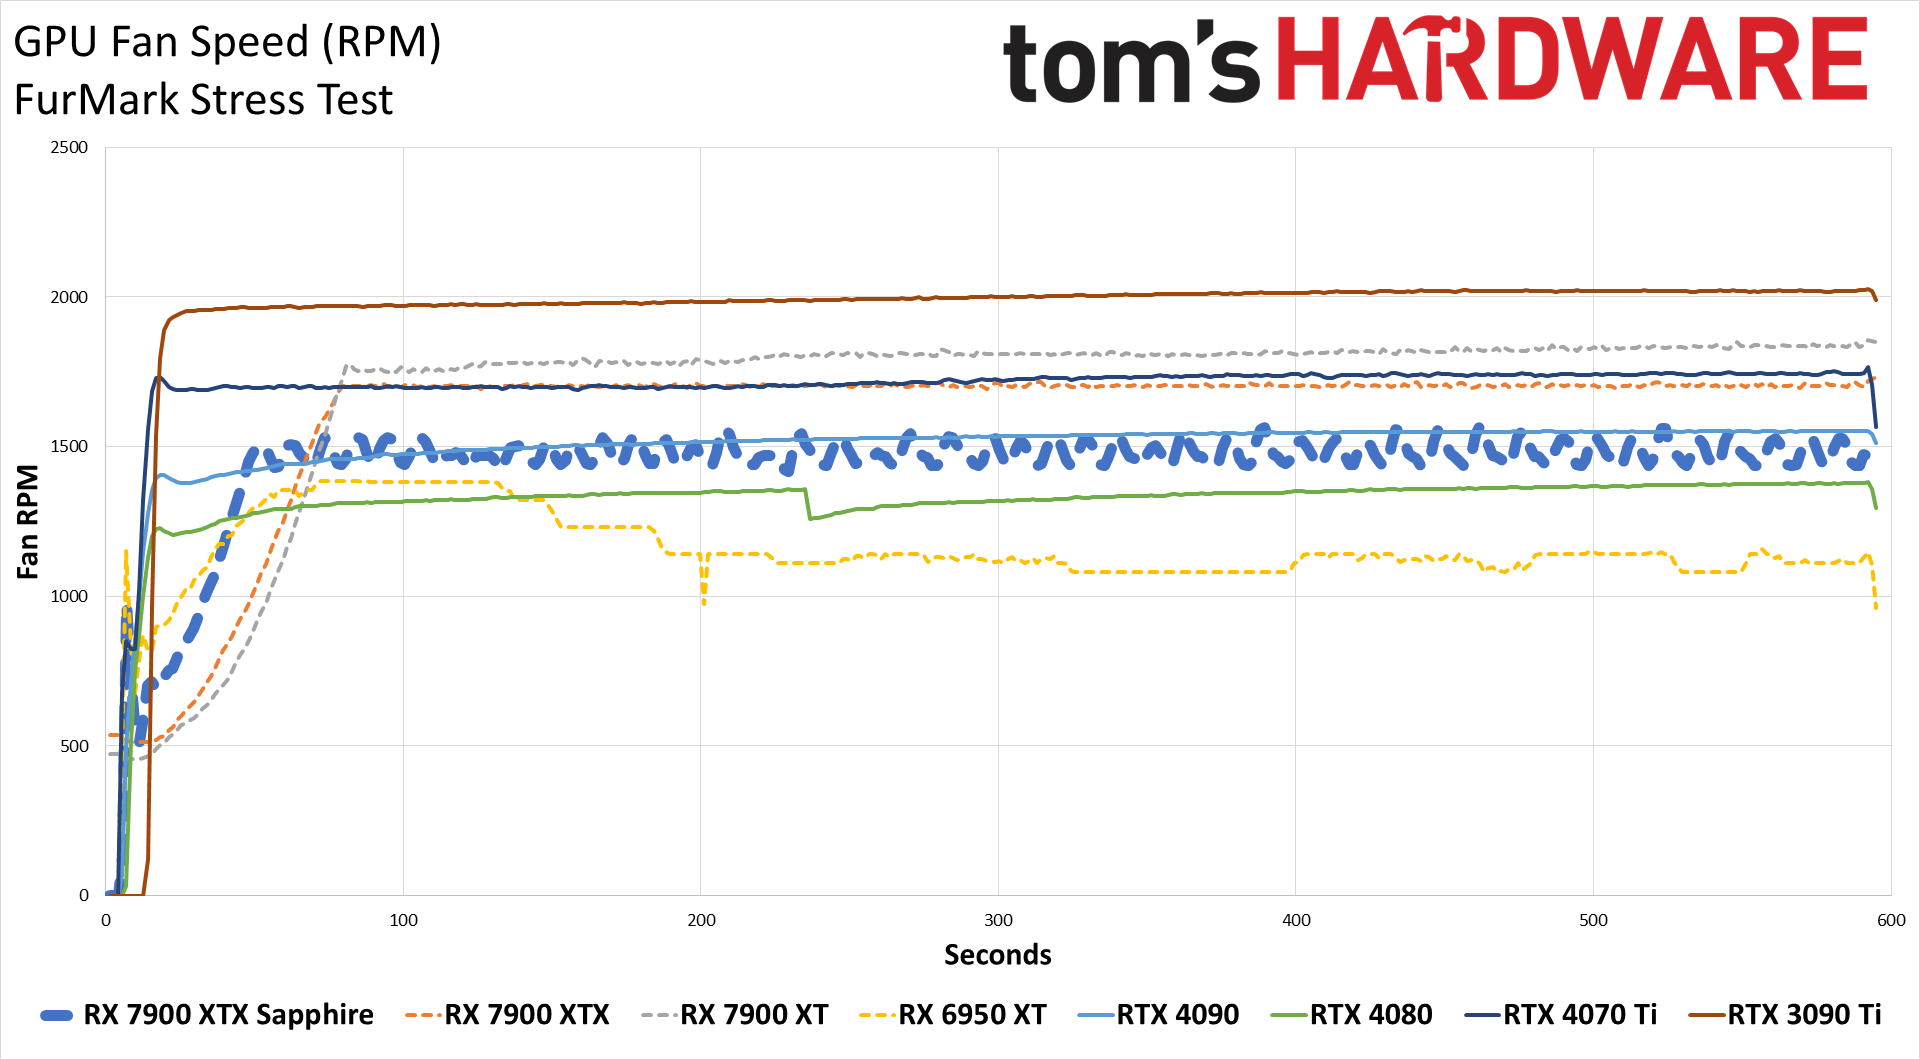
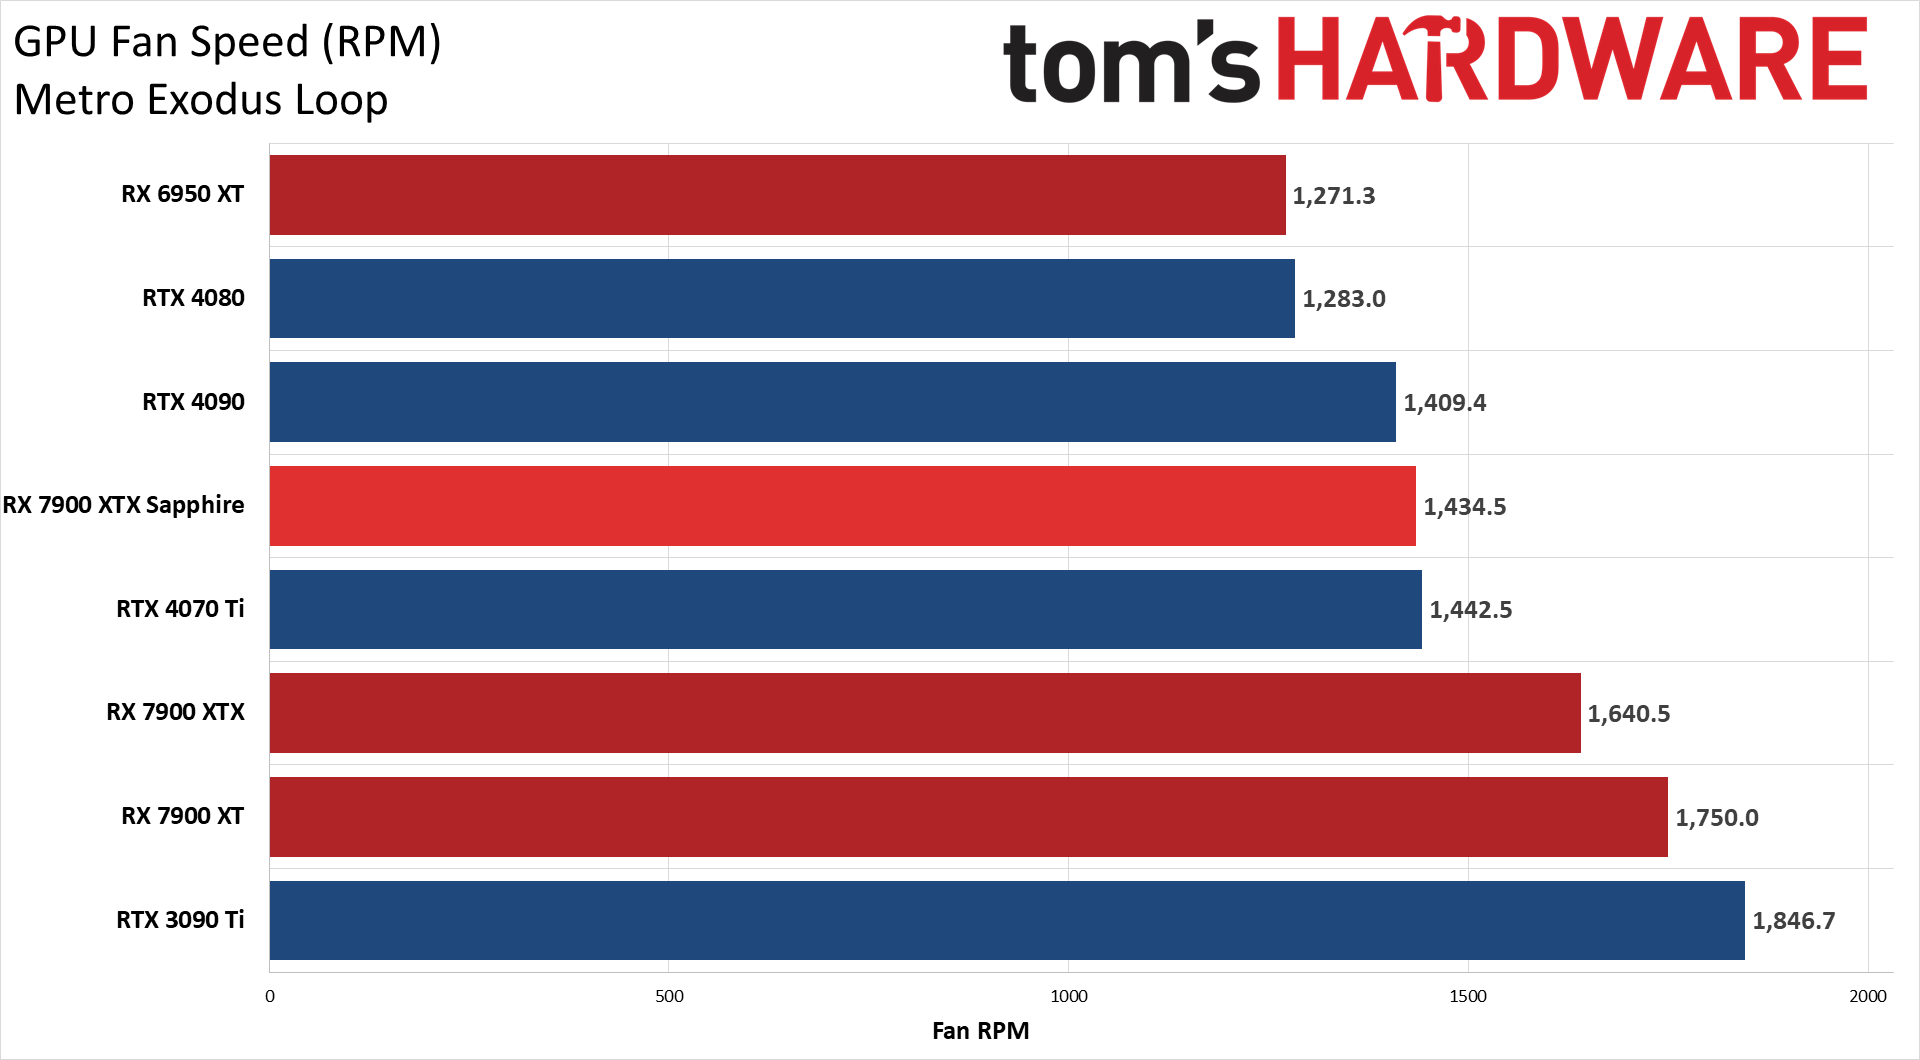
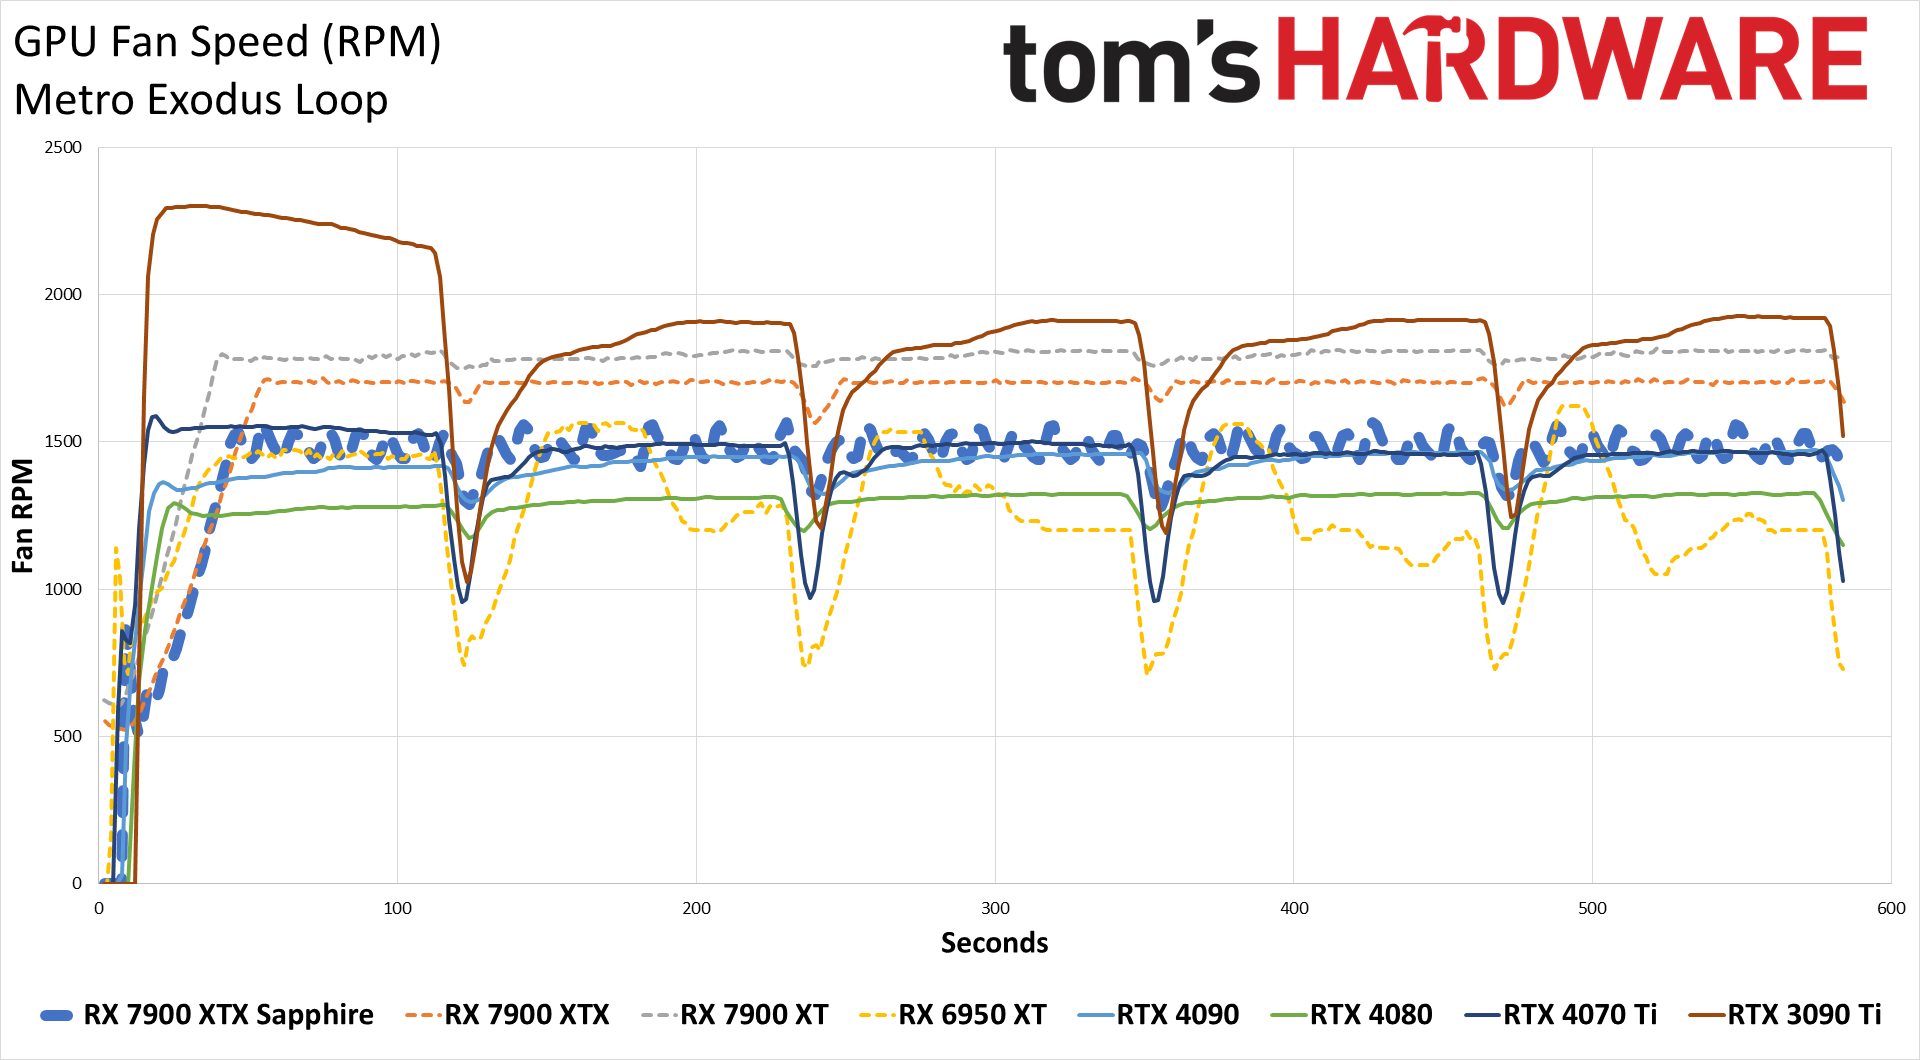
Our previous power testing results are still valid, though they're limited to two scenarios: FurMark and Metro Exodus. Both test scenarios last about 10 minutes, though Metro does have a "break" between loops that allows the GPU to recover slightly.
Sapphire's RX 7900 XTX Nitro+ ends up eclipsing everything except for the RTX 4090 and RTX 3090 Ti when it comes to power use, and it's not that far behind those in our gaming test. Power draw averaged 425W in Metro, just 6W less than the 3090 Ti and 10W less than the 4090, and also 73W more than the reference 7900 XTX and 128W more than the RTX 4080. So much for those efficiency gains AMD was talking about with RDNA 3 — they clearly don't apply when you redline the GPU.
You can of course opt to save power by switching out of the default performance mode, which might not be a bad idea. Manual overclocking, as we showed above, would only make things worse.
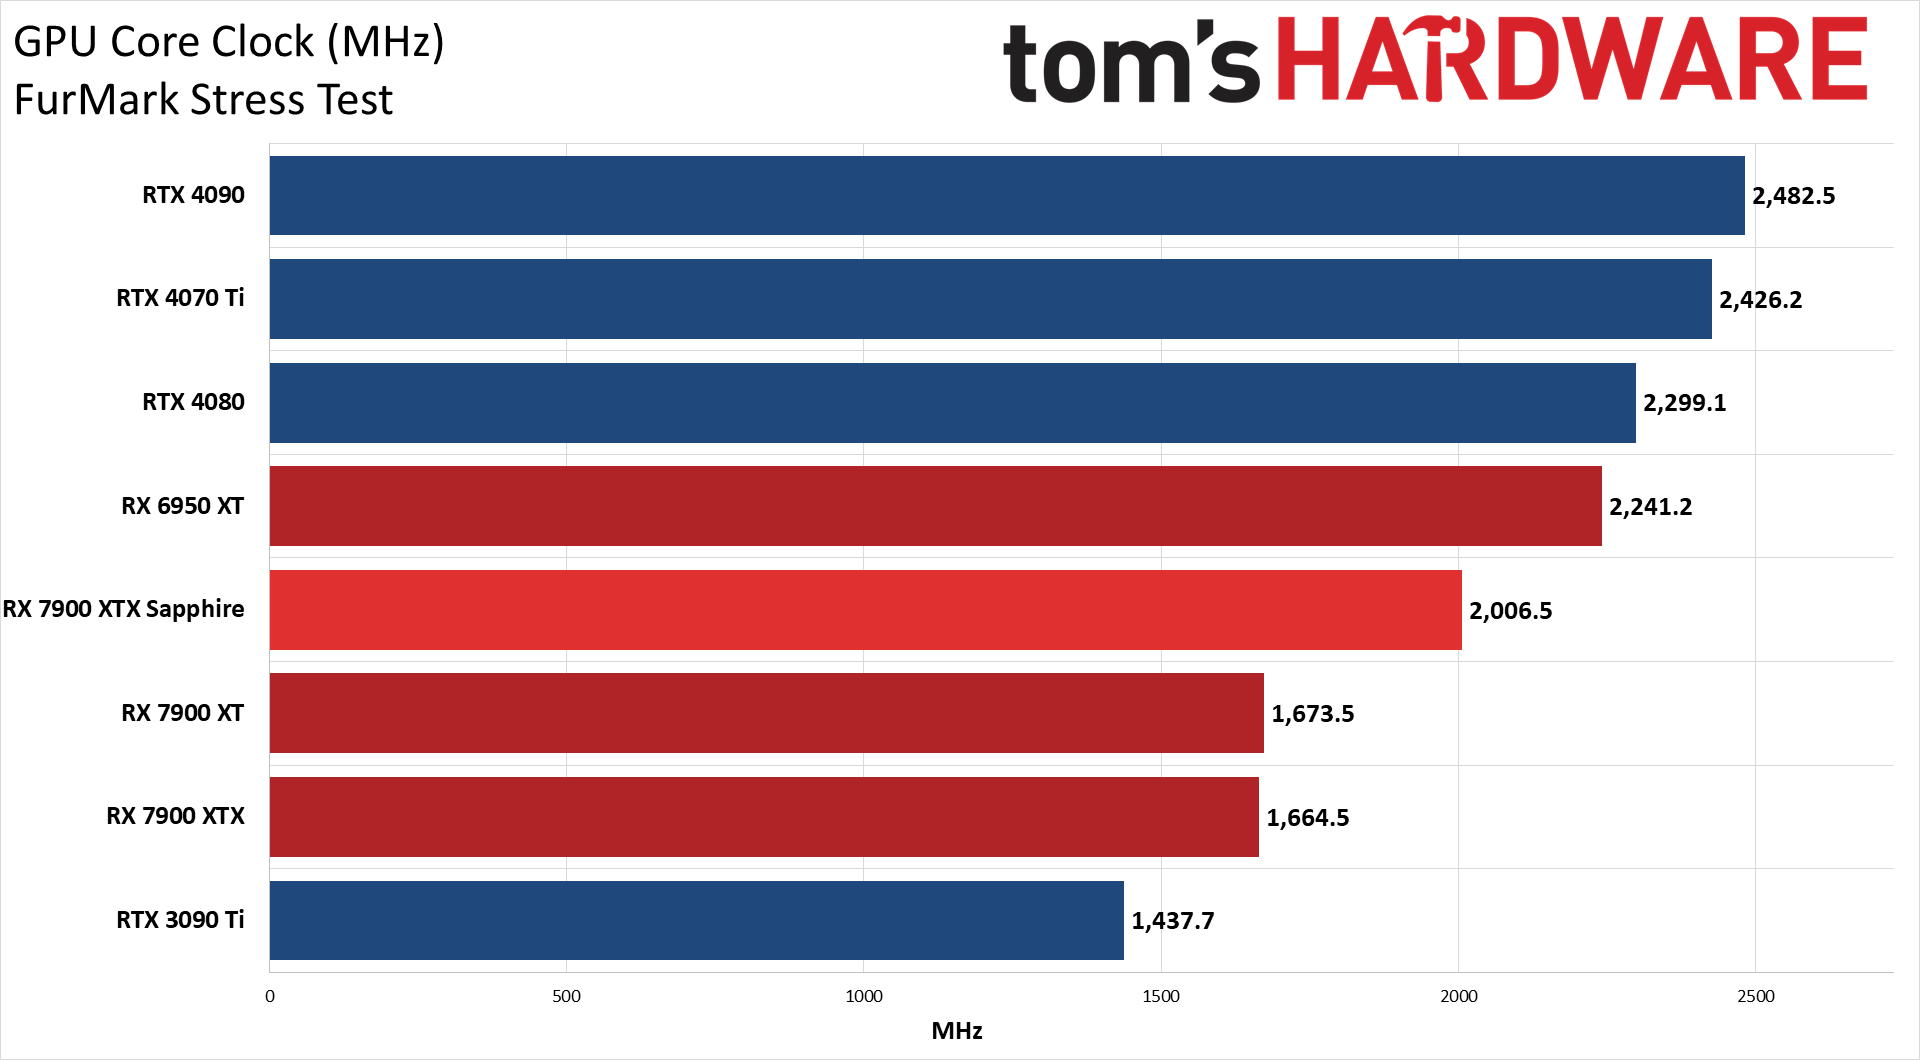
The clock speeds help to explain the higher power draw, as, in FurMark, Sapphire's card averaged just over 2 GHz, compared to 1.66 GHz on the reference model. While gaming, it also averaged 2.8 GHz compared to 2.56 GHz on the reference card.
We don't usually dig too much into the voltages, but it's worth mentioning that in our Metro testing, the reference card had an average VDDC of 0.895V while under load, compared to the Sapphire card's 0.988V for the same test sequence. That extra 0.93V makes a rather large difference in power use when combined with the higher clock speeds.
The good news is that temperatures are basically the same on the Sapphire card and on the reference XTX, despite the higher power draw. Both top out in the 65C range, with the reference XTX running its fans at up to ~1650 RPM compared to just 1450 RPM for the Sapphire card. That impacts the noise level as well.
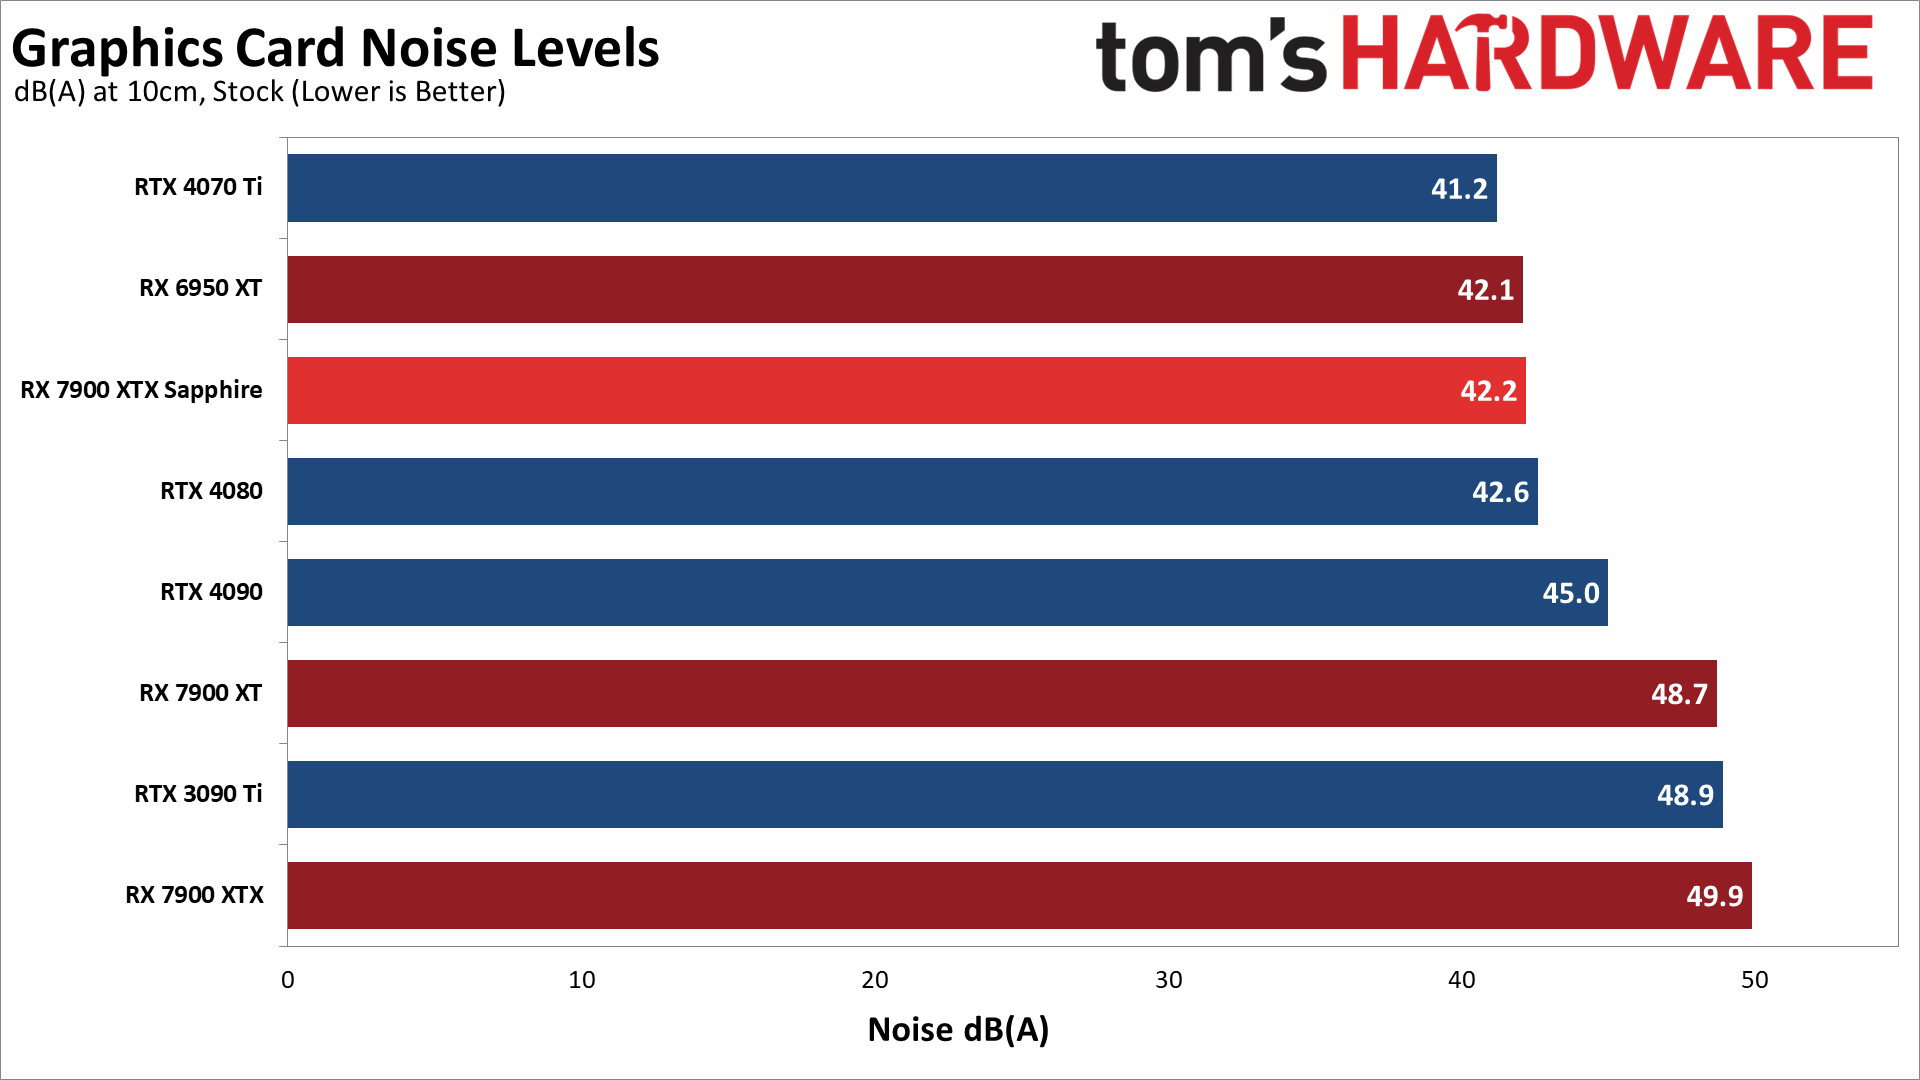
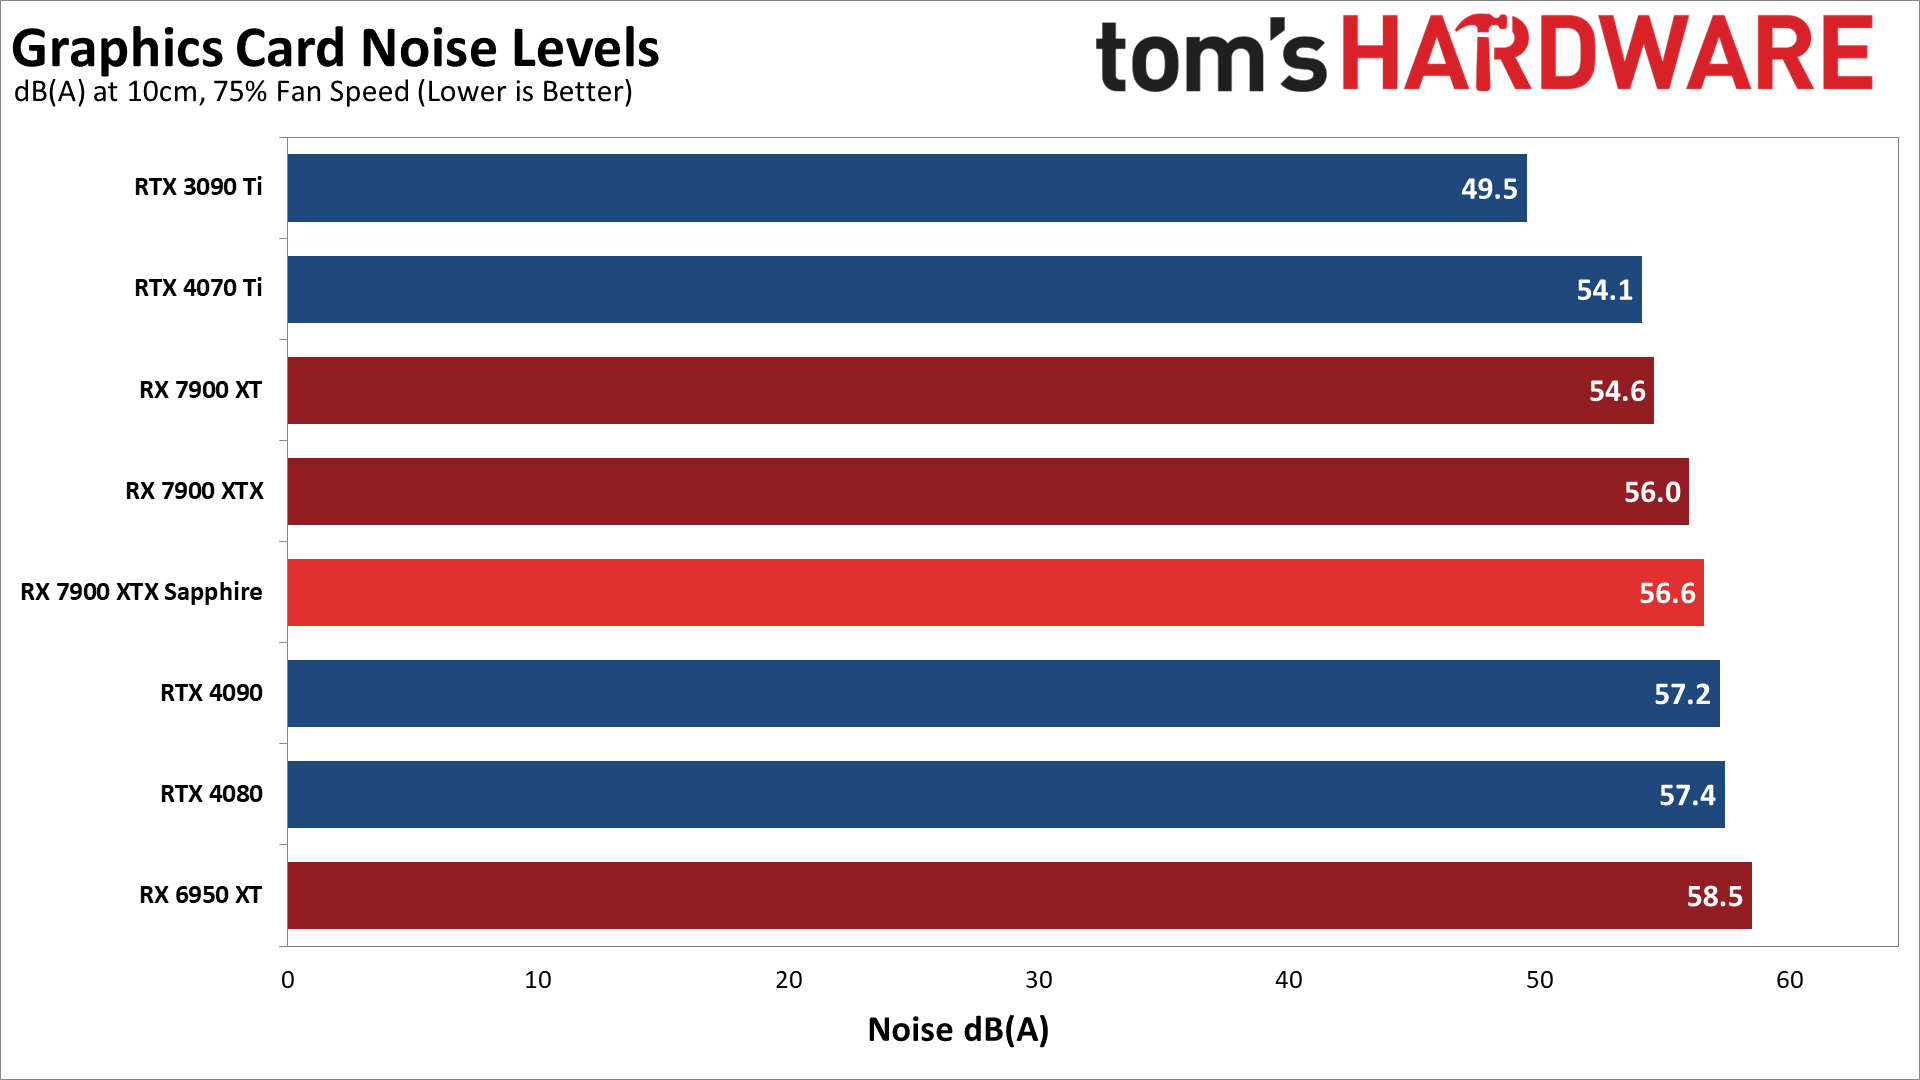
We check noise levels using an SPL (sound pressure level) meter placed 10cm from the card, with the mic aimed right at the center fan. This helps minimize the impact of other noise sources like the fans on the CPU cooler. The noise floor of our test environment and equipment is around 32 dB(A).
After running Metro for over 15 minutes, the Sapphire RX 7900 XTX settled in at a fan speed of 38% and a noise level of 42.2 dB(A). That's only slightly higher than some of the quietest cards we've tested, which land at around 39 dB(A). The reference card meanwhile measured 49.9 dB(A), which is clearly audible over the ambient room noise. We also tested with a static fan speed of 75%, where the Sapphire generated 56.6 dB(A) of noise, so there's plenty of room for additional airflow and cooling if the fans need to ramp up — not that you'd normally want that.
- MORE: Best Graphics Cards
- MORE: GPU Benchmarks and Hierarchy
- MORE: All Graphics Content
Get Tom's Hardware's best news and in-depth reviews, straight to your inbox.
Current page: Sapphire RX 7900 XTX Nitro+ Vapor-X: Power, Clocks, Temps, Fans, and Noise
Prev Page Sapphire RX 7900 XTX Nitro+ Vapor-X: 1440p Gaming Performance Next Page Sapphire RX 7900 XTX Nitro+ Vapor-X: Better Than Reference
Jarred Walton is a senior editor at Tom's Hardware focusing on everything GPU. He has been working as a tech journalist since 2004, writing for AnandTech, Maximum PC, and PC Gamer. From the first S3 Virge '3D decelerators' to today's GPUs, Jarred keeps up with all the latest graphics trends and is the one to ask about game performance.
-
zecoeco This one narrows the gap even more with the RTX 4090.Reply
It tells me that AMD can offer an RTX 4090 beating card with a lower price tag, but for some reason they're not interested in the beyond $1000 market. -
-Fran- Thank God Sapphire is actually cheaper in the EU than any other AMD partner XDReply
Vis a vis, this card is the same price as PowerColor and Asus models.
Such a great performer, but I don't like this design xP
Regards. -
DavidLejdar Over here, Vapor-X sells for 1,499 Euro, and 7900 XTX for 1,269 Euro (including 19% VAT in both cases). And sure is quite a price difference for such a FPS difference. And then there is the RX 7900 XT, going for less than 1,000 Euro now.Reply
For the time being, I am fine with the RX 6700 XT (OC) though. At 1440p and ultra settings, I do get at least around 70 FPS in a number of games I tried so far.
A better GPU would increase the FPS, but it won't improve the built-in graphical assets of many a game, which are ever so often designed to run on consoles, where even the PS5 comes "only" with a peak performance of 10.3 TFlops. And a PC port usually doesn't redesign all of it, which means that a RX 6700 XT with 12.4 TFlops is not easily falling behind in that regard, especially when alongside a resonable CPU and a Gen4 SSD (which the PS5 and Xbox already have, for the increased transfer rate as well for the lower latency). -
cknobman IMO Ray Tracing today is like 4k gaming was back in the 1080ti generation.Reply
Its possible but requires too many compromises and should only be used in specific cases.
We need 1-2 more generations before ray tracing will be mainstream.
So right now I could care less about ray tracing, especially at anything above 1080p. -
Elusive Ruse Good stuff Jarred, thanks. Great card but at anything above $1000 it's criminal. Not like a thousand dollars is a fair price mind you.Reply -
redgarl So AMD AIBs card are costing more than reference cards and it is a con, but Nvidia ones are as worst but it is fine....Reply
You wonder why we can take you guys seriously?
OCJYDJXDRHwView: https://youtu.be/OCJYDJXDRHw -
redgarl You cannot find a 4090 at MSRP. They orbit around 1800$. And in all honesty, the 7900XTX AIB card can OC and be between 10-15% from a 4090.Reply -
redgarl The performance of this card is impressive, however the aesthetic is horrible. Even if the XFX model perform worst, it is still provide enough headroom for a similar OC, and at least, it is one of the best looking GPU available.Reply -
Sleepy_Hollowed Damn, if this was at MSRP I'd think about it, but it's a lot.Reply
A little issue I have is that I don't know why game engine companies don't have an option to turn on Ray Tracing on cut scenes only and then none during gameplay, I'd be down for that, not that there's much difference on how games look most games anyways. -
Exploding PSU Always liked Sapphire cards, and this one is no exception. I personally buy GPUs mostly on aesthetic (after considering pricing obviously), as performance-wise GPUs of the same series from different brands probably aren't really that different between each other, especially for a casual user like me. I mean, maybe a couple degrees difference in temperature or a single-digit percent in FPS, but honestly not enough for me to feel it.Reply
I liked the last year's model better (the Nitro Pure one), albeit I'm extremely impartial to white parts and random geometric shapes. The RGB look tasteful to me, albeit I personally wouldn't set it to rainbow colours and would settle to strictly static colour, kind of elegant.
Hey, that's just my opinion. From my short experience hanging around the forums I know any mention of RGB would invite open combat on the comments so... just to be on the safe side, the "you do you" disclaimer.
If I were in the market for a new GPU, I might consider picking this one up. But nah, I'm waiting for Yeston's turn.
I made fun of the box art on Sapphire's RX 6950 XT Nitro+ Pure, and I'm happy to say the blue and black artwork on the 7900 XTX is less ugly. Not that it really matters once you unpack the card.
Full transparency, the product packaging was part of the reason why I chose my current GPU. Yeah I know, doesn't make sense and all, but hey glad you mentioned the box... Cheers
