Transcend SSD340 256 GB Review: Now With JMicron Inside
We have our first retail SSD with JMicron's JMF667H controller. Paying $115 for 256 GB of fast storage sure sounds attractive, but has the company ironed out the issues that plagued it in the early days of SSDs? We run its SSD340 through our grinder.
Results: Latency And Performance Consistency
Random Performance Over Time
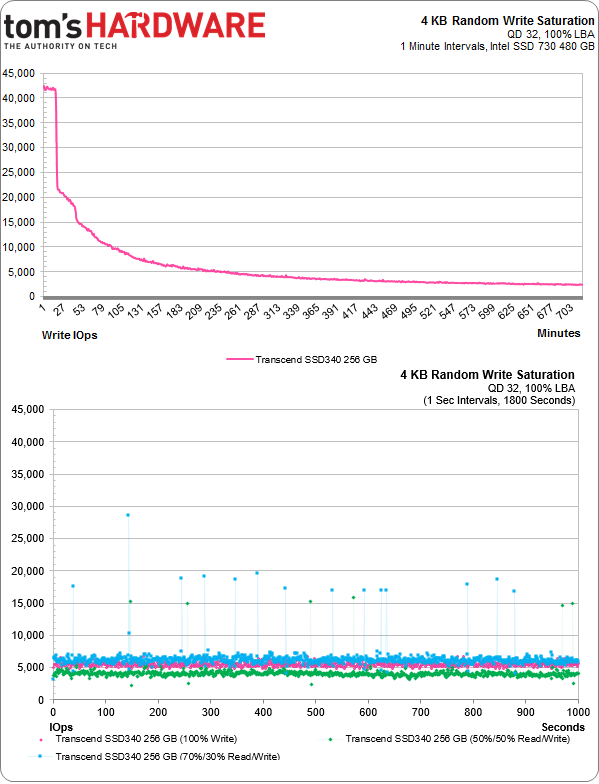
My saturation test consists of writing to each drive for 12 hours using 4 KB blocks with 32 outstanding commands. But first I secure erase each drive. Then, I apply the write load, illustrating average IOPS for each minute (except for the last 20 minutes, where I zoom in and show you one-second average increments).
The write saturation test has always been more about characterizing drive behavior than pure performance. In that way, it's necessary to push client SSDs harder at times. Once they start sweating, we get a better idea of what might be going on under the hood.
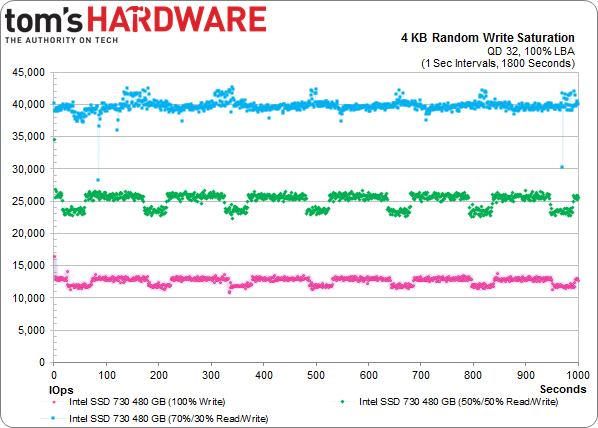
This chart comes from The SSD 730 Series Review: Intel Is Back With Its Own Controller. The 100% write (in pink), 50% write (in green), and 30% write (in blue) workloads are tightly grouped. More important, as the workload gets progressively more read-biased, speed improves. Writes are the limiting factor, so as we turn the dial up on those, distinct performance bands emerge with the 100% write workload on the bottom.
As you're about to see, most drives don't look as neat and orderly as Intel's exception SSD 730. But you get the idea.
After hammering on the SSD340 for a while, we start seeing some unusual activity. The drive creates the tightly-grouped bands seen in the chart above, with little separation between minimum and maximum performance. We just don't get much of an improvement as the workload shift from write-only (most demanding) to 50% writes to 30% writes. The SSD340 is value-oriented, so it's understandable that Transcend doesn't sacrifice usable capacity for more over-provisioning, which would have helped improve degraded performance. Instead, you get 7% spare area, and that's probably going to hurt the SSD340 through our testing.
Get Tom's Hardware's best news and in-depth reviews, straight to your inbox.
Current page: Results: Latency And Performance Consistency
Prev Page Results: Random Performance Next Page Results: Tom's Hardware Storage Bench v1.0-
anthony8989 Great article, much appreciated!Reply
In the conclusion you put:the M500 has one feature the SSD340 lacks: TCG Opal 2.0 and Microsoft eDrive support
That would be two features! -
Tanquen "There's a good chance you won't notice the difference between a fast SATA 6Gb/s SSD and something plugged into M.2. And this is from a guy who tests SSDs all day, every day."Reply
There is a good chance you won’t notice the difference between a “fast” SSD and a hard disk in the day to day life of a PC. -
user 18 Reply13822529 said:"There's a good chance you won't notice the difference between a fast SATA 6Gb/s SSD and something plugged into M.2. And this is from a guy who tests SSDs all day, every day."
There is a good chance you won’t notice the difference between a “fast” SSD and a hard disk in the day to day life of a PC.
I don't think that's accurate. I have two otherwise-identical laptops, one with an SSD for its boot drive and one with a HDD. The one with the SSD is hands down faster in program launches, file opening, and other read/write tasks.
I've also compared fresh installs of multiple OSs (Windows 7, Linux Mint 16, Ubuntu 14.04) between hard drive and SSD, as well as comparing them to my old Windows 7 install on a relatively slow SSD, and none of the fresh installs on hard drives even came close in speed to the old and bloated install on the SSD.
I'm sorry that you haven't experienced the difference between a SSD and a HDD, I do truly believe it is the single most important upgrade one can make to their PC. -
Tanquen Reply13822633 said:13822529 said:"There's a good chance you won't notice the difference between a fast SATA 6Gb/s SSD and something plugged into M.2. And this is from a guy who tests SSDs all day, every day."
There is a good chance you won’t notice the difference between a “fast” SSD and a hard disk in the day to day life of a PC.
I don't think that's accurate. I have two otherwise-identical laptops, one with an SSD for its boot drive and one with a HDD. The one with the SSD is hands down faster in program launches, file opening, and other read/write tasks.
I've also compared fresh installs of multiple OSs (Windows 7, Linux Mint 16, Ubuntu 14.04) between hard drive and SSD, as well as comparing them to my old Windows 7 install on a relatively slow SSD, and none of the fresh installs on hard drives even came close in speed to the old and bloated install on the SSD.
I'm sorry that you haven't experienced the difference between a SSD and a HDD, I do truly believe it is the single most important upgrade one can make to their PC.
Lots of upgrades can be important depending where you are at with each component. If you have a slow low power 2.5” hard disk in your laptop then an SSD can help. But I’m looking at all other things being equal and SSDs just don’t help that much when you have a fast 3.5” HD. When I compare the same tasks on my old PC with a HD that has a good 150MB+ read write speed and other than benchmarking the Windows boot time and a few large apps starting up it just not a big deal. Even then you have to clock it and see that it took 30 seconds and not 38. In my day to day work I just don’t notice. You have to set there and clock the Windows startup time. Are my work VMware sessions any faster, do my games start any faster? No, not really. I have even played around with a 50GB RAM drive with 3000MB+ read/write speeds and my games and VMware sessions are just about the same. Windows and the apps are waiting on other things and the bottleneck is just moved elsewhere. All my games are on my supper fast 400MB+ SSD and when my friend comes over he plays on my poor old HD base PC with slower RAM and slower CPU and a slower GPU and all the different games we play together I load the games maybe a few seconds before he does and with some games there is no difference. -
nekromobo Tanguen thats because your slow machine isn't loading the full size textures, meches and running the game on maxed settings. Can't you just think about it before talking from your *!#.Reply
Your almost never going to be doing sequential write/read for 150MB+ on a HDD and that random read/write will just kill that speed.

