Transcend SSD340 256 GB Review: Now With JMicron Inside
We have our first retail SSD with JMicron's JMF667H controller. Paying $115 for 256 GB of fast storage sure sounds attractive, but has the company ironed out the issues that plagued it in the early days of SSDs? We run its SSD340 through our grinder.
Results: TRIM Testing With DriveMaster 2012
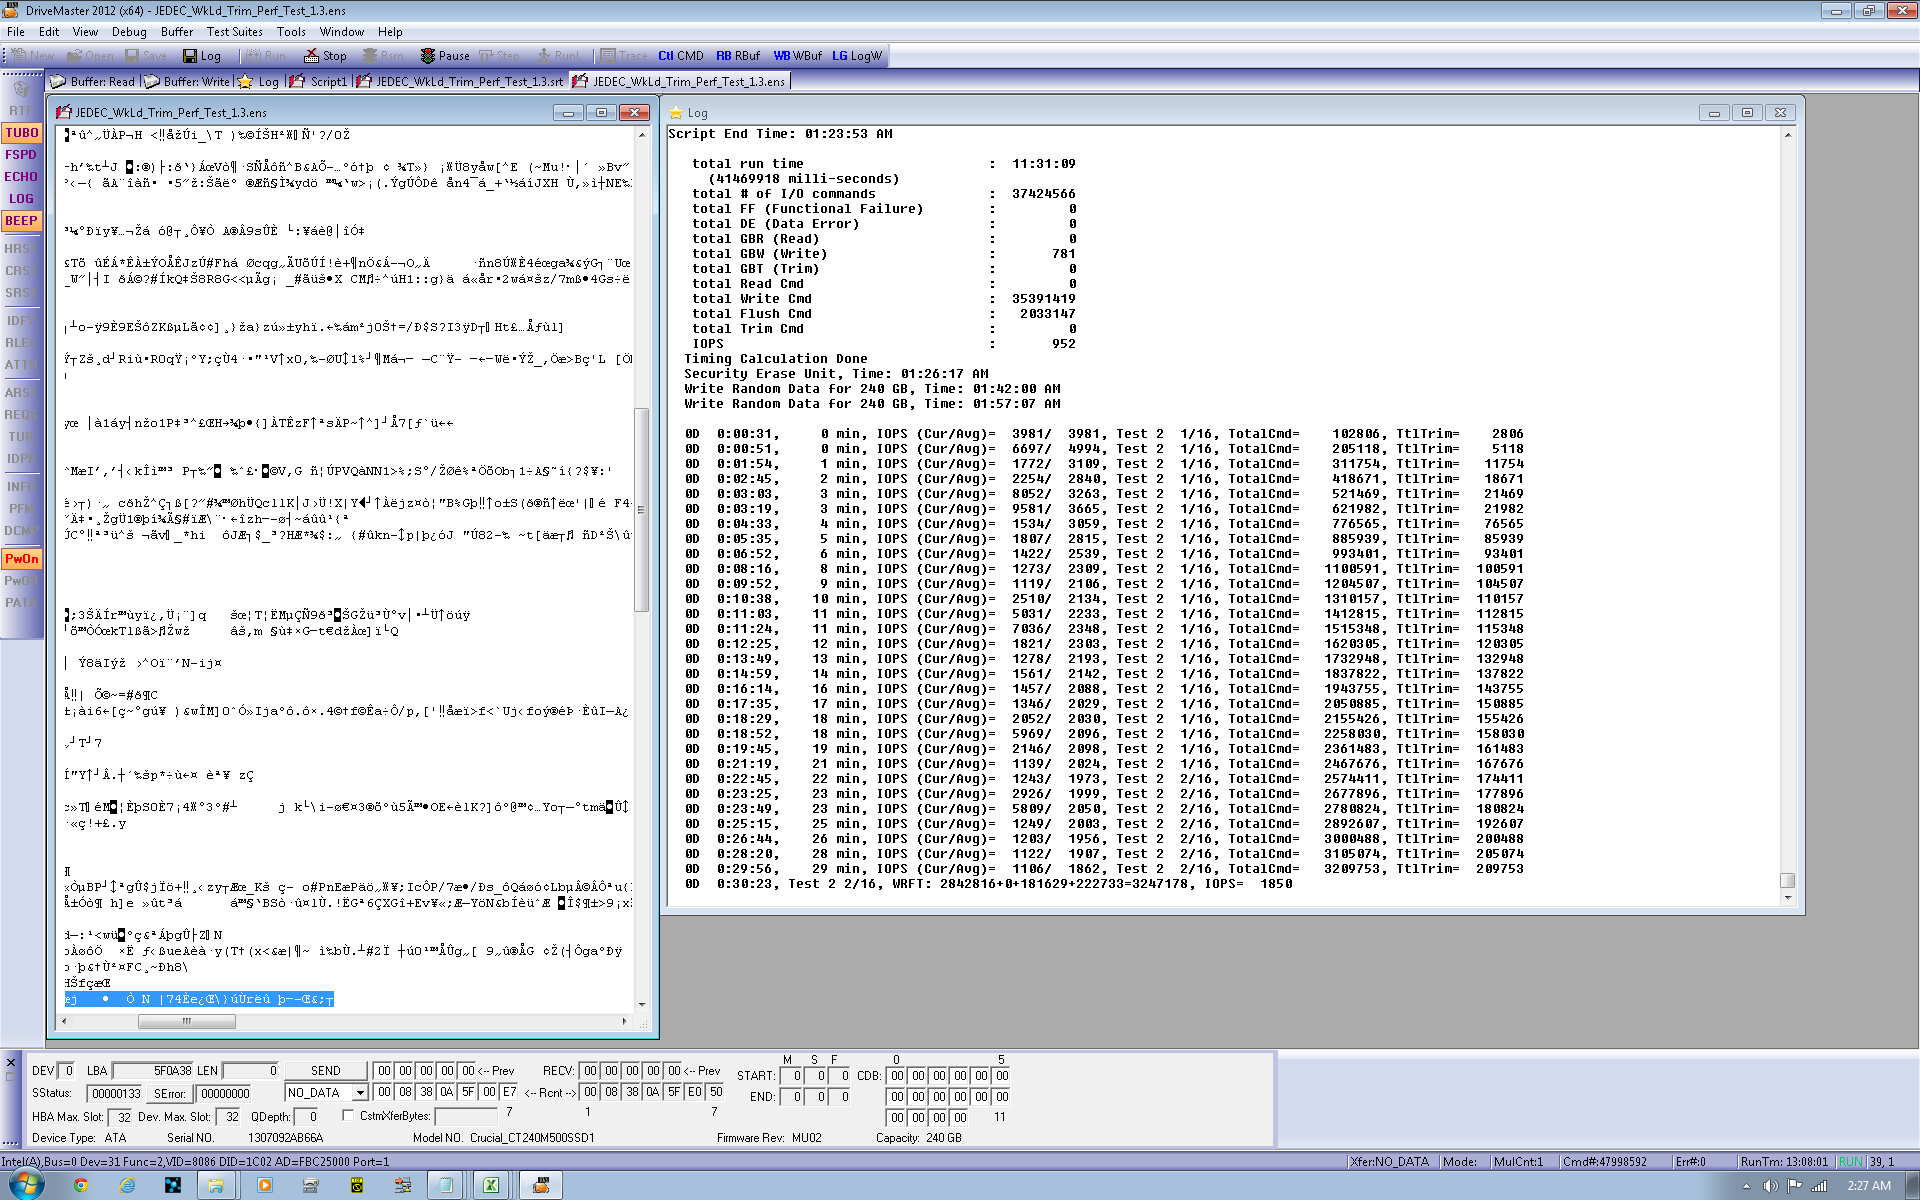
We've been utilizing ULINK's DriveMaster 2012 software and hardware suite to introduce a new test for client drives. Using JEDEC's standardized 218A Master Trace, DriveMaster can turn a sequence of I/O (similar to our Tom's Hardware Storage Bench) into a TRIM test. JEDEC's trace is months and months of drive activity, day-to-day activities, and background operating system tasks.
ULINK strips out the read commands for this benchmark, leaving us with the write, flush, and TRIM commands to work with. Execute the same workload with TRIM support and without, and you end up with a killer metric for further characterizing drive behavior.
DriveMaster is used by most SSD manufacturers to create and perform specific measurements. It's currently the only commercial product that can create the scenarios needed to validate TCG Opal 2.0 security, though it's almost unlimited in potential applications. Much of the benefit tied to a solution like DriveMaster is its ability to diagnose bugs, ensure compatibility, and issue low-level commands. In short, it's very handy for the companies actually building SSDs. And if off-the-shelf scripts don't do it for you, make your own. There's a steep learning curve, but the C-like environment and command documentation give you a fighting chance.
This product also gives us some new ways to explore performance. Testing the TRIM command is just the first example of how we'll be using ULINK's contribution to the Tom's Hardware benchmark suite.
On a 256 GB drive, each iteration writes close to 800 GB of data, so running the JEDEC TRIM test suite once generates almost 3.2 TB of mostly random writes (it's 75% random and 25% sequential). By the end of each run, over 37 million write commands are issued.
The first two tests employ DMA to access the storage, while the last two use Native Command Queuing. Since most folks don't use DMA with SSDs (aside from some legacy or industrial applications) we don't concern ourselves with those. It can take up to 96 hours to run one drive through all four runs, though faster SSDs can roughly cut the time in half. Because so much information is being written to an already-full SSD (the drive is filled before each test), devices that perform better under heavy load fare best. Without TRIM, on-the-fly garbage collection becomes a big contributor to high IOPS. With TRIM, 13% of space gets TRIM'ed, leaving more room for the controller to use for maintenance operations.
TRIM Testing
Average
Get Tom's Hardware's best news and in-depth reviews, straight to your inbox.
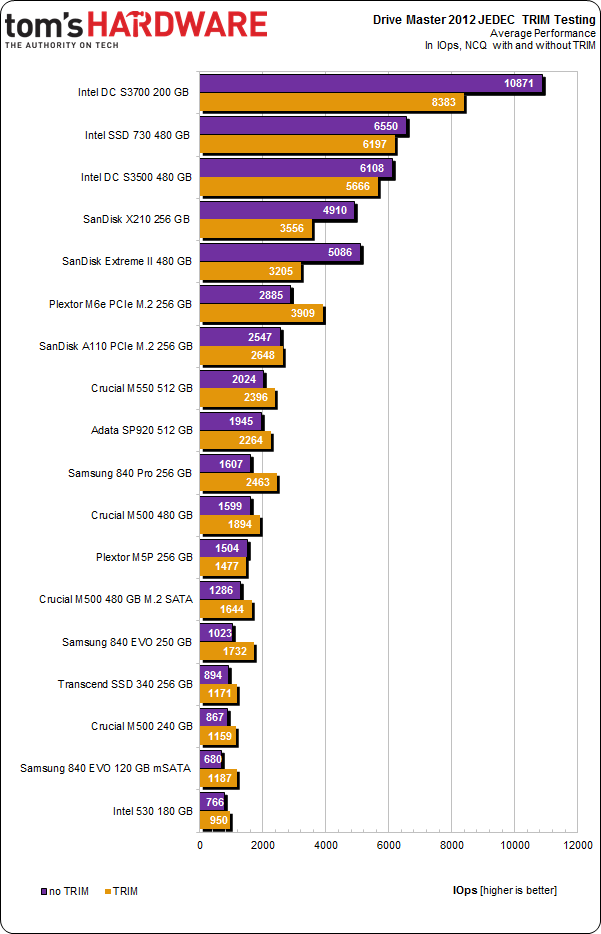
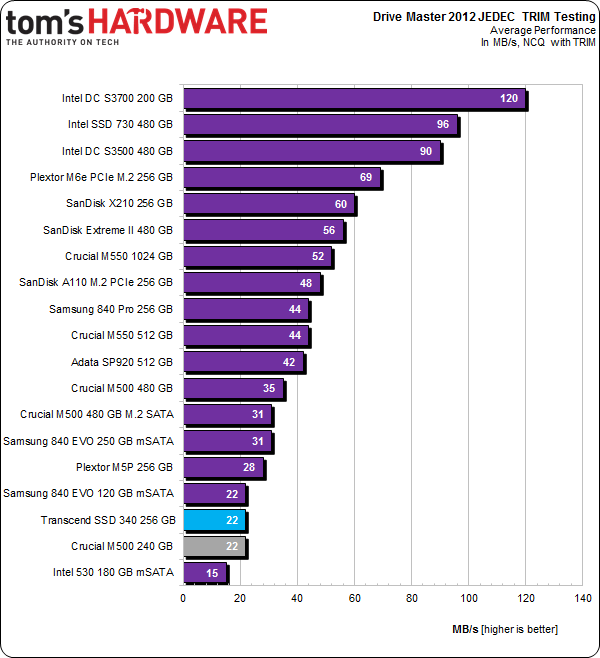
To avoid adding too much data, I have the average performance for each benchmarked SSD with and without TRIM support enabled. Displayed in IOPS, this helps us make comparisons more quickly.
The SSD340 does benefit from TRIM. And although overall performance is not spectacular, the difference between using and not using the command is palpable. In fact, again, Transcend's submission is a dead ringer for the Crucial M500 that appears right below it. Unsurprisingly, both drives are equipped with 256 GB of L85A flash from IMFT.
Instantaneous
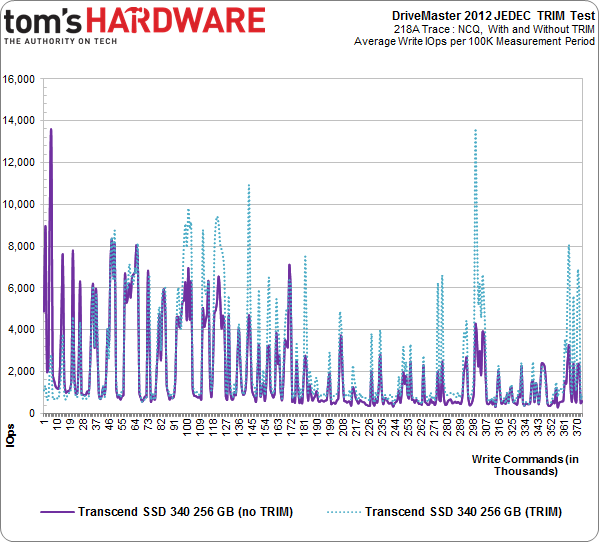
But I also want results for the instantaneous average of my TRIM test. How does the drive fare servicing writes with and without TRIM during each 100,000-command window? The purple line represents IOPS across the entire trace, without TRIM. The teal line is with TRIM. Each data point represents write IOPS per 100,000-command test reporting period.
This chart tells the whole story. The run with TRIM enabled demonstrates higher performance as the test progresses, pulling several hundred percent over the run without TRIM at times.
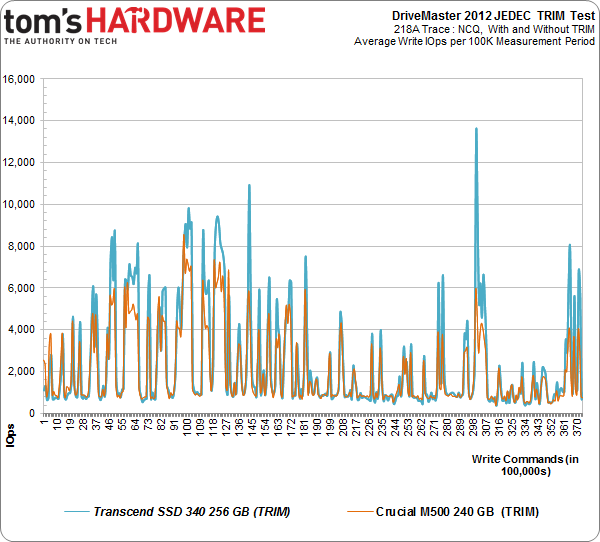
I'm curious about the relationship between Transcend's SSD340 and Crucial's 240 GB M500. Previously, we saw that the averages at the end of the run with TRIM enabled were basically identical. But when we overlay the two graphs, the story appears different. That average belies periods where the M500 just can't hang with the SSD340, despite using the same flash and sporting an eight-channel controller.
Throughput
We collect and report the total throughput of each drive in the NCQ with TRIM test. It's one number that helps capture overall performance in the test.
The M500 and SSD340 land next to each other in our average throughput benchmark. It takes a chart like the one we just looked at to tell the real differences.
Current page: Results: TRIM Testing With DriveMaster 2012
Prev Page Results: PCMark 8 Storage Consistency Testing Next Page Power Consumption: Now With DevSlp Testing-
anthony8989 Great article, much appreciated!Reply
In the conclusion you put:the M500 has one feature the SSD340 lacks: TCG Opal 2.0 and Microsoft eDrive support
That would be two features! -
Tanquen "There's a good chance you won't notice the difference between a fast SATA 6Gb/s SSD and something plugged into M.2. And this is from a guy who tests SSDs all day, every day."Reply
There is a good chance you won’t notice the difference between a “fast” SSD and a hard disk in the day to day life of a PC. -
user 18 Reply13822529 said:"There's a good chance you won't notice the difference between a fast SATA 6Gb/s SSD and something plugged into M.2. And this is from a guy who tests SSDs all day, every day."
There is a good chance you won’t notice the difference between a “fast” SSD and a hard disk in the day to day life of a PC.
I don't think that's accurate. I have two otherwise-identical laptops, one with an SSD for its boot drive and one with a HDD. The one with the SSD is hands down faster in program launches, file opening, and other read/write tasks.
I've also compared fresh installs of multiple OSs (Windows 7, Linux Mint 16, Ubuntu 14.04) between hard drive and SSD, as well as comparing them to my old Windows 7 install on a relatively slow SSD, and none of the fresh installs on hard drives even came close in speed to the old and bloated install on the SSD.
I'm sorry that you haven't experienced the difference between a SSD and a HDD, I do truly believe it is the single most important upgrade one can make to their PC. -
Tanquen Reply13822633 said:13822529 said:"There's a good chance you won't notice the difference between a fast SATA 6Gb/s SSD and something plugged into M.2. And this is from a guy who tests SSDs all day, every day."
There is a good chance you won’t notice the difference between a “fast” SSD and a hard disk in the day to day life of a PC.
I don't think that's accurate. I have two otherwise-identical laptops, one with an SSD for its boot drive and one with a HDD. The one with the SSD is hands down faster in program launches, file opening, and other read/write tasks.
I've also compared fresh installs of multiple OSs (Windows 7, Linux Mint 16, Ubuntu 14.04) between hard drive and SSD, as well as comparing them to my old Windows 7 install on a relatively slow SSD, and none of the fresh installs on hard drives even came close in speed to the old and bloated install on the SSD.
I'm sorry that you haven't experienced the difference between a SSD and a HDD, I do truly believe it is the single most important upgrade one can make to their PC.
Lots of upgrades can be important depending where you are at with each component. If you have a slow low power 2.5” hard disk in your laptop then an SSD can help. But I’m looking at all other things being equal and SSDs just don’t help that much when you have a fast 3.5” HD. When I compare the same tasks on my old PC with a HD that has a good 150MB+ read write speed and other than benchmarking the Windows boot time and a few large apps starting up it just not a big deal. Even then you have to clock it and see that it took 30 seconds and not 38. In my day to day work I just don’t notice. You have to set there and clock the Windows startup time. Are my work VMware sessions any faster, do my games start any faster? No, not really. I have even played around with a 50GB RAM drive with 3000MB+ read/write speeds and my games and VMware sessions are just about the same. Windows and the apps are waiting on other things and the bottleneck is just moved elsewhere. All my games are on my supper fast 400MB+ SSD and when my friend comes over he plays on my poor old HD base PC with slower RAM and slower CPU and a slower GPU and all the different games we play together I load the games maybe a few seconds before he does and with some games there is no difference. -
nekromobo Tanguen thats because your slow machine isn't loading the full size textures, meches and running the game on maxed settings. Can't you just think about it before talking from your *!#.Reply
Your almost never going to be doing sequential write/read for 150MB+ on a HDD and that random read/write will just kill that speed.
