Transcend SSD340 256 GB Review: Now With JMicron Inside
We have our first retail SSD with JMicron's JMF667H controller. Paying $115 for 256 GB of fast storage sure sounds attractive, but has the company ironed out the issues that plagued it in the early days of SSDs? We run its SSD340 through our grinder.
Results: Tom's Hardware Storage Bench v1.0, Continued
Service Times
Beyond the average data rate reported on the previous page, there's even more information we can collect from Tom's Hardware's Storage Bench. For instance, mean (average) service times show what responsiveness is like on an average I/O during the trace.
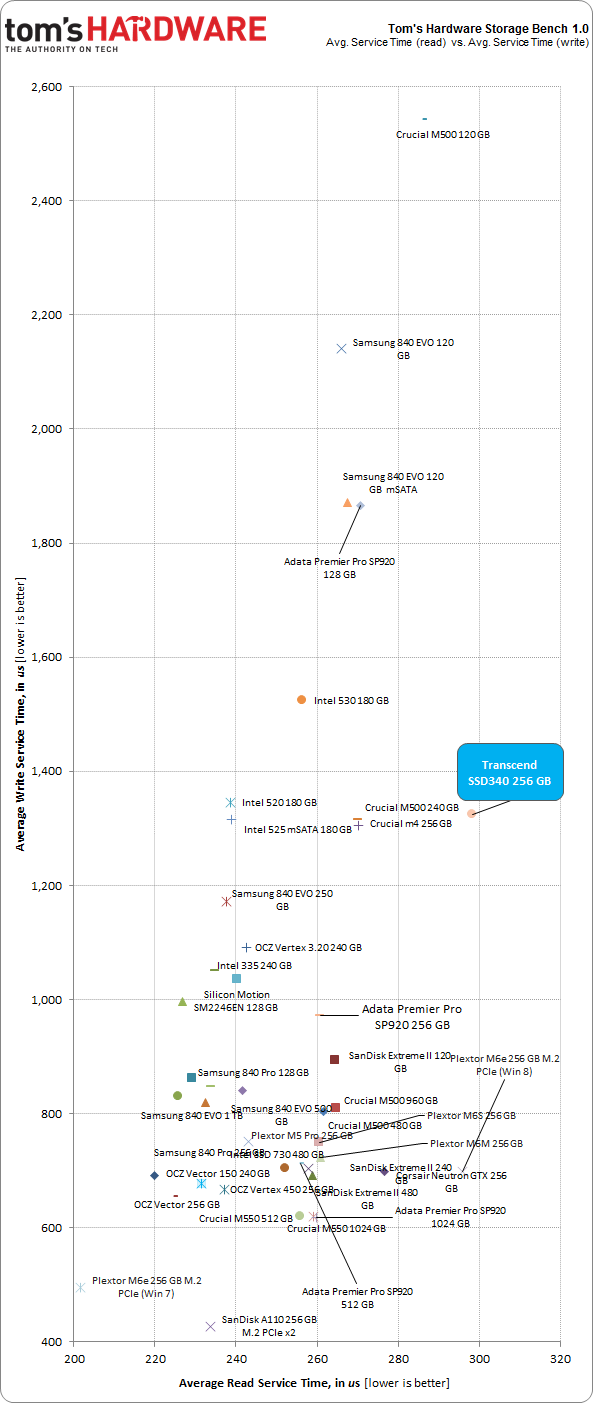
It would be difficult to graph the 10+ million I/Os that make up our test, so looking at the average time to service an I/O makes more sense. For a more nuanced idea of what's transpiring during the trace, we plot mean service times for reads against writes. That way, drives with better latency show up closer to the origin; lower numbers are better.
Write service time is simply the total time it takes an input or output operation to be issued by the host operating system, travel to the storage subsystem, commit to the storage device, and have the drive acknowledge the operation. Read service is similar. The operating system asks the storage device for data in a certain location, the SSD reads that information, and then it's sent to the host. Modern computers are fast and SSDs are zippy, but there's still a significant amount of latency involved in a storage transaction.
Transcend pushes past some of the less attractive drives we've benchmarked to its own spot adjacent to some 180 GB Intel SSDs, the 256 GB m4, and Crucial's newer M500 at 240 GB.
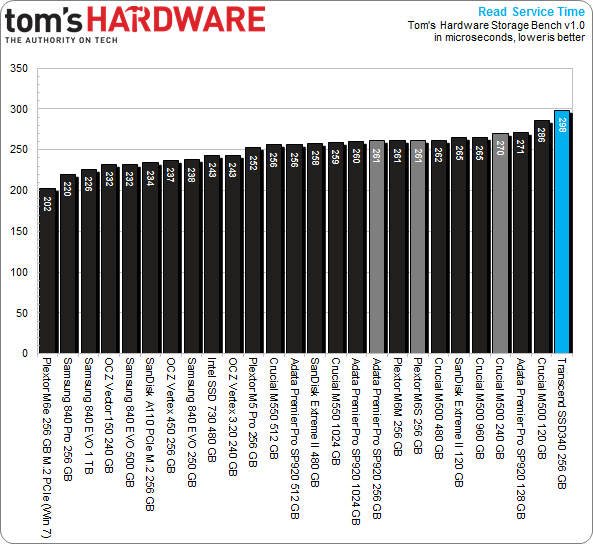
Mean Read Service Time
The other three highlighted drives punish Transcend's SSD340. Clearly, it's just not as good at servicing burst I/O in our trace, though we'd stop short of calling its failure something to worry about. The delta isn't large, and the outcome doesn't fall out of bounds.
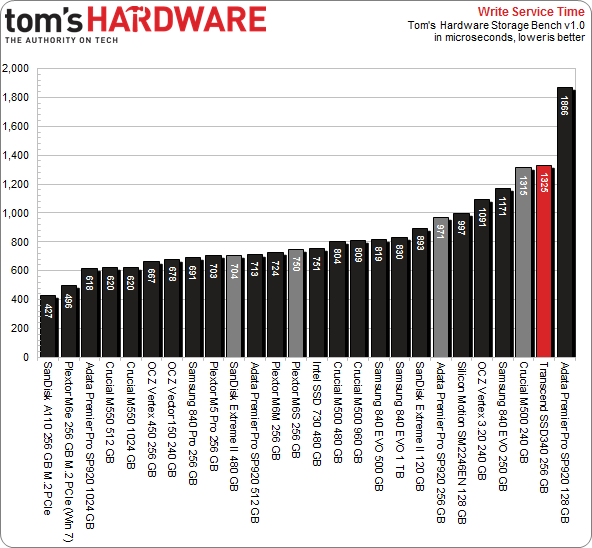
The same story is written by this chart, more or less. When it comes to burst write activity, the 256 GB SSD340 registers the same service time as Crucial's 240 GB M500.
Get Tom's Hardware's best news and in-depth reviews, straight to your inbox.
Current page: Results: Tom's Hardware Storage Bench v1.0, Continued
Prev Page Results: Tom's Hardware Storage Bench v1.0 Next Page Results: PCMark 8 Storage Consistency Testing-
anthony8989 Great article, much appreciated!Reply
In the conclusion you put:the M500 has one feature the SSD340 lacks: TCG Opal 2.0 and Microsoft eDrive support
That would be two features! -
Tanquen "There's a good chance you won't notice the difference between a fast SATA 6Gb/s SSD and something plugged into M.2. And this is from a guy who tests SSDs all day, every day."Reply
There is a good chance you won’t notice the difference between a “fast” SSD and a hard disk in the day to day life of a PC. -
user 18 Reply13822529 said:"There's a good chance you won't notice the difference between a fast SATA 6Gb/s SSD and something plugged into M.2. And this is from a guy who tests SSDs all day, every day."
There is a good chance you won’t notice the difference between a “fast” SSD and a hard disk in the day to day life of a PC.
I don't think that's accurate. I have two otherwise-identical laptops, one with an SSD for its boot drive and one with a HDD. The one with the SSD is hands down faster in program launches, file opening, and other read/write tasks.
I've also compared fresh installs of multiple OSs (Windows 7, Linux Mint 16, Ubuntu 14.04) between hard drive and SSD, as well as comparing them to my old Windows 7 install on a relatively slow SSD, and none of the fresh installs on hard drives even came close in speed to the old and bloated install on the SSD.
I'm sorry that you haven't experienced the difference between a SSD and a HDD, I do truly believe it is the single most important upgrade one can make to their PC. -
Tanquen Reply13822633 said:13822529 said:"There's a good chance you won't notice the difference between a fast SATA 6Gb/s SSD and something plugged into M.2. And this is from a guy who tests SSDs all day, every day."
There is a good chance you won’t notice the difference between a “fast” SSD and a hard disk in the day to day life of a PC.
I don't think that's accurate. I have two otherwise-identical laptops, one with an SSD for its boot drive and one with a HDD. The one with the SSD is hands down faster in program launches, file opening, and other read/write tasks.
I've also compared fresh installs of multiple OSs (Windows 7, Linux Mint 16, Ubuntu 14.04) between hard drive and SSD, as well as comparing them to my old Windows 7 install on a relatively slow SSD, and none of the fresh installs on hard drives even came close in speed to the old and bloated install on the SSD.
I'm sorry that you haven't experienced the difference between a SSD and a HDD, I do truly believe it is the single most important upgrade one can make to their PC.
Lots of upgrades can be important depending where you are at with each component. If you have a slow low power 2.5” hard disk in your laptop then an SSD can help. But I’m looking at all other things being equal and SSDs just don’t help that much when you have a fast 3.5” HD. When I compare the same tasks on my old PC with a HD that has a good 150MB+ read write speed and other than benchmarking the Windows boot time and a few large apps starting up it just not a big deal. Even then you have to clock it and see that it took 30 seconds and not 38. In my day to day work I just don’t notice. You have to set there and clock the Windows startup time. Are my work VMware sessions any faster, do my games start any faster? No, not really. I have even played around with a 50GB RAM drive with 3000MB+ read/write speeds and my games and VMware sessions are just about the same. Windows and the apps are waiting on other things and the bottleneck is just moved elsewhere. All my games are on my supper fast 400MB+ SSD and when my friend comes over he plays on my poor old HD base PC with slower RAM and slower CPU and a slower GPU and all the different games we play together I load the games maybe a few seconds before he does and with some games there is no difference. -
nekromobo Tanguen thats because your slow machine isn't loading the full size textures, meches and running the game on maxed settings. Can't you just think about it before talking from your *!#.Reply
Your almost never going to be doing sequential write/read for 150MB+ on a HDD and that random read/write will just kill that speed.


