SanDisk Ultra Plus SSD Reviewed At 64, 128, And 256 GB
SanDisk's Ultra Plus replaces the company's older SATA 3Gb/s SandForce-based Ultra with something a bit more modern, and with a budget-oriented price tag. We test all three capacities to see if the entry-level pricing belies a pocket rocket in disguise.
Results: Tom's Hardware Storage Bench v1.0
Storage Bench v1.0 (Background Info)
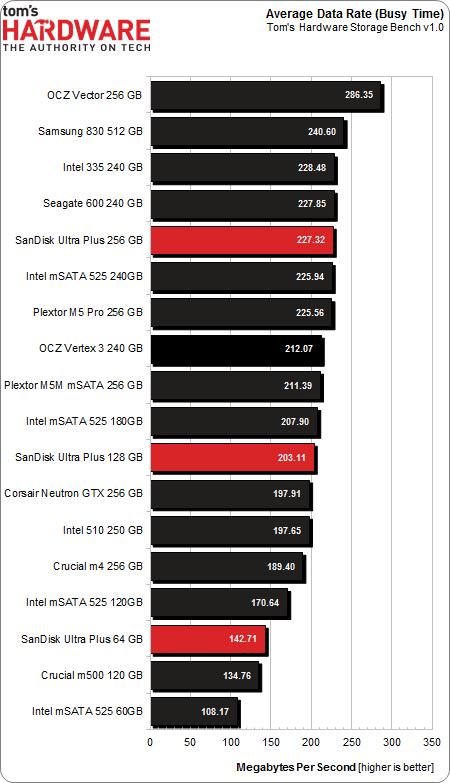
Our Storage Bench incorporates all of the I/O from a trace recorded over two weeks. The process of replaying this sequence to capture performance gives us a bunch of numbers that aren't really intuitive at first glance. Most idle time gets expunged, leaving only the time that each benchmarked drive was actually busy working on host commands. So, by taking the ratio of that busy time and the the amount of data exchanged during the trace, we arrive at an average data rate (in MB/s) metric we can use to compare drives.
It's not quite a perfect system. The original trace captures the TRIM command in transit, but since the trace is played on a drive without a file system, TRIM wouldn't work even if it were sent during the trace replay (which, sadly, it isn't). Still, trace testing is a great way to capture periods of actual storage activity, a great companion to synthetic testing like Iometer.
Incompressible Data and Storage Bench v1.0
Also worth noting is the fact that our trace testing pushes incompressible data through the system's buffers to the drive getting benchmarked. So, when the trace replay plays back write activity, it's writing largely incompressible data. If we run our storage bench on a SandForce-based SSD, we can monitor the SMART attributes for a bit more insight.
| Mushkin Chronos Deluxe 120 GBSMART Attributes | RAW Value Increase |
|---|---|
| #242 Host Reads (in GB) | 84 GB |
| #241 Host Writes (in GB) | 142 GB |
| #233 Compressed NAND Writes (in GB) | 149 GB |
Host reads are greatly outstripped by host writes to be sure. That's all baked into the trace. But with SandForce's inline deduplication/compression, you'd expect that the amount of information written to flash would be less than the host writes (unless the data is mostly incompressible, of course). For every 1 GB the host asked to be written, Mushkin's drive is forced to write 1.05 GB.
If our trace replay was just writing easy-to-compress zeros out of the buffer, we'd see writes to NAND as a fraction of host writes. This puts the tested drives on a more equal footing, regardless of the controller's ability to compress data on the fly.
Get Tom's Hardware's best news and in-depth reviews, straight to your inbox.
Average Data Rate
The Storage Bench trace generates more than 140 GB worth of writes during testing. Obviously, this tends to penalize drives smaller than 180 GB and reward those with more than 256 GB of capacity.
The Ultra Plus drives don't mess around in this metric. A combination of fast flash and nCache help the 64 and 128 GB models tremendously. Given the basic performance data implications, we know these drives are really flying at lower queue depths. While the trace does spike up to higher queue depths at times, the outstanding commands fall between one and three on average.
Had this trace comprised fewer writes, the 64 GB Ultra Plus would look even better. But almost 150 GB of writes quickly put smaller drives into a coma, forcing them to struggle with garbage collection routines early on in the benchmark. You can see this in the average service times, where write requests require additional overhead in this state.
Unfortunately, busy time and the MB/s stat you generate with it aren't adept at measuring higher queue depth performance. Despite the corner case testing that shows one drive far ahead of another at low queue depths, all of the SSDs we're testing are basically the same in the background I/O generated by Windows, your Web browser, or most other mainstream applications. Only when we're presented with lots of data throughput (reads and writes) in a short time do we see separation between high-end and mid-range drives. For that, we need another metric.
Service Times and Standard Deviation
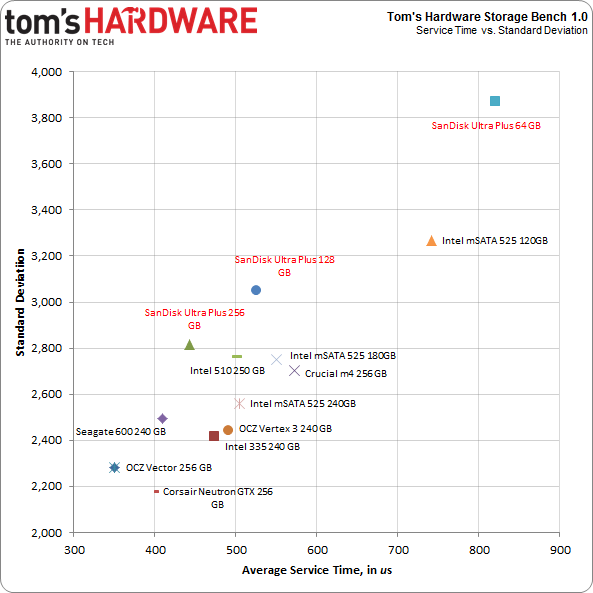
There is a wealth of information we can collect with Tom's Storage Bench above and beyond the average data rate. Mean (average) service times show what responsiveness is like on an average I/O during the trace. It would be difficult to plot the 10 million I/Os that make up our test, so looking at the average time to service an I/O makes more sense. We can also plot the standard deviation against mean service time. That way, drives with quicker and more consistent service plot toward the origin (lower numbers are better here).
The three Ultra Pluses demonstrate admirable service times. On average, they handle I/O requests without much latency. The 256 GB model averages just 440 microseconds over the 10 million I/O requests that make up our trace. Most of those are 4 KB transactions, but a significant number are larger transfers. The 128 GB drive isn't far behind. The 64 GB Ultra Plus looks pretty rough in comparison, but its average service times are just slightly behind Intel's 120 GB SSD 525. The 60 GB SSD 525 is so far out of this chart's range that we'd have to expand its scale to ridiculous proportions.
The statistical measurement of standard deviation can indicate a drive's consistency throughout the trace playback. SanDisk's Ultra Pluses are ever so slightly less consistent than the competition, which isn't unreasonable to assume since the 88SS9175 controller is working with half as many channels. The thing is, our trace pounds 64/128 GB-class drives into submission. Even if that wasn't true, the smaller capacities would still be at a disadvantage. The fact that we're still seeing not just passable, but excellent performance is most welcome indeed.
Current page: Results: Tom's Hardware Storage Bench v1.0
Prev Page Results: 4 KB Random Performance Next Page Results: PCMark 7 And PCMark Vantage-
kevith I have had the former SanDisk Extreme 128 GB for a year now, and it´s definitely fast enough. But what´s more impressive is, that after a year, the write amplification still hovers between 0,800 and 0,805. I´m using it in my laptop for quite "normal" use, FB, YouTube, mail, wordprocessing etc.on Windows 8 64-bit. So far it has served me very well, my next SSD is going to be another SanDiskReply -
Soda-88 I recommended this SSD (256GB) to my friend just a week ago since it was nearly as cheap as top of the line 128GB SSDs, glad to read positive review.Reply -
alidan im honestly looking into ssd drives for games and mass small file storage.Reply
these are cheap, and they are large, would definitely help with load times/game performance, and browsing images stored enmass. -
Brian Fulmer I ordered 5 Extreme 128GB drives in March (model SDSSDHP-128G). I've been using OCZ, Kingston, Samsung and Crucial drives in every desktop and notebook I've deployed since August 2013. Out of ~75 drives, I've had 1 bad Vertex 4 and 6 defective by design Crucial V4's. Of the 5 SanDisks, 2 failed before deployment. Support was laughably incompetent in demanding the drives be updated with the latest firmware. Their character mode updater couldn't see the drives, because they DIED. SanDisk is no longer on my buy list.Reply
Incidentally, of the 8 SSD model SSD P5 128GB, I've had one die. The context should be of 35 Vertex 4's, I've had one die. I've had zero failures with 15 840's despite their supposedly fragile design. -
ssdpro Brian Fulmer's comments are very reasonable (except the "deployed since Aug 2013" part lol). Way too many people experience a failure then scream all drives from that mfg are junk. I have owned 2 840 Pro drives and had one fault out. Does that mean Samsung drives have a 50 percent failure rate? For me, yes, but overall no and I am definitely not that naive. The 840 Pro can and do fail like anything electrical can. I have owned probably a dozen OCZ drives and had one Vertex 2 failure - does that mean OCZ/SandForce firmware stinks and they aren't reliable? No, it just means a drive died and who knows why. I have owned a couple SanDisk products and none failed. Does that mean SanDisk is the best? No... it just means I didn't have one die but I also only sampled 2.Reply -
Combat Wombat These and the OCZ drives from newegg are looking mighty close in price!Reply
BF4 Rebuild is about to take place :D -
@ssdpro: spot on. sure, if i buy from vendor a and his product fails, i will probably not buy from him again. if it fails more than once, there is no chance i'll buy his stuff again and i also will warn others about it. but understandable as this is, in the end even that doesn't mean much about the reliability of the manufacturer.Reply
that's also why i'm a bit sceptical about product ratings on amazon and the likes, since people are more inclined to complain about a bad experience, than share their view on a product that simply does what it should do: work.
what we would need more often are statistics from bigger companies, or even repair services, so we don't have to base our purchases on samples of a few dozen to a few hundreds, but on thousands upon thousands of cases. -
flong777 The 840 Pro still appears to be the fastest overall SSD on the planet - but the difference between the top 5 is pretty much negligible. Among the top five, reliability and cost become the determining factors.Reply -
anything4this I don't understand the ~500MBs read limit on the drives. Is it an interface bottleneck?Reply

