Tom's Hardware Verdict
While WD Blue 500GB SN550 has slower sustained write performance than its predecessor, it still offers very competitive performance for very low pricing. It comes backed with a 5-year warranty, too.
Pros
- +
Competitive performance
- +
Affordable and efficient
- +
5-year warranty
- +
Single-sided PCB at all capacities
Cons
- -
Small SLC cache
- -
Slower direct-to-TLC write speeds than its predecessor
- -
Unflattering aesthetic
- -
Power optimization on desktops could be better
Why you can trust Tom's Hardware
Maybe you want to upgrade the cramped SSD in your ultra-light notebook. Or maybe you just want a reliable and affordable NVMe SSD for your new gaming rig. In either case, WD’s mainstream NVMe SSD that will fit the bill nicely. With performance figures that peak at 2.4 GBps and very low MSRPs, the Blue SN550 offers tremendous value.
Back when we first reviewed the WD Blue SN500, we were disappointed that it wasn’t offered in a 1TB capacity. This may have been to drive up sales on the 1TB and 2TB WD Black SN750. But now the company has released a new Blue SN550 with a 1TB maximum capacity. Aside from a capacity bump, the Blue SN550 packs a few upgrades under the hood, including a faster controller and some of the latest 96-layer TLC NAND flash available.
Specifications
| Header Cell - Column 0 | WD Blue SN550 250GB | WD Blue SN550 500GB | WD Blue SN550 1TB |
|---|---|---|---|
| Pricing | $54.99 | $64.99 | $99.99 |
| Capacity (User / Raw) | 250GB / 256GB | 500GB / 512GB | 1000GB / 1024GB |
| Form Factor | M.2 2280 | M.2 2280 | M.2 2280 |
| Interface / Protocol | PCIe 3.0 x4 / NVMe 1.4 | PCIe 3.0 x4 / NVMe 1.4 | PCIe 3.0 x4 / NVMe 1.4 |
| Controller | WD Architecture | WD Architecture | WD Architecture |
| DRAM | DRAMless | DRAMless | DRAMless |
| Memory | SanDisk 96L TLC | SanDisk 96L TLC | SanDisk 96L TLC |
| Sequential Read | 2,400 MBps | 2,400 MBps | 2,400 MBps |
| Sequential Write | 950 MBps | 1,750 MBps | 1,750 MBps |
| Random Read | 170,000 IOPS | 300,000 IOPS | 410,000 IOPS |
| Random Write | 135,000 IOPS | 240,000 IOPS | 405,000 IOPS |
| Security | N/A | N/A | N/A |
| Endurance (TBW) | 150 TB | 300 TB | 600 TB |
| Part Number | WDS250G2B0C | WDS500G2B0C | WDS100T2B0C |
| Warranty | 5-Years | 5-Years | 5-Years |
WD’s Blue SN550 is available in 250GB, 500GB, and 1TB capacities to suit the mainstream crowd. Pricing is low, with MSRPs of $54.99, $64.99, and $99.99 respectively. WD rates the SSD to deliver sequential read speeds of up to 2,400 MBps and write speeds of up to 1,750 MBps, although the smallest 250GB capacity can only hit 950 MBps on the write side of things.
Furthermore, the write speed is based on the SSD’s write cache. Like most SSDs these days, the WD Blue SN550’s write performance degrades after the write cache fills -- more on that shortly. In terms of random performance, the company rates the SN550 to hit upwards of 410,000/405,000 IOPS read/write.
You can easily secure erase the SN550 if you have a motherboard with the feature to do so built-in. Trim and S.M.A.R.T. data reporting are supported. And with a multi-gear ECC scheme as well as various other standard flash management technologies to aid the NAND flash’s longevity, the SSD is rated to endure up to 600TB of writes at the largest capacity -- if the drive is within its five-year warranty, that is.
Software and Accessories
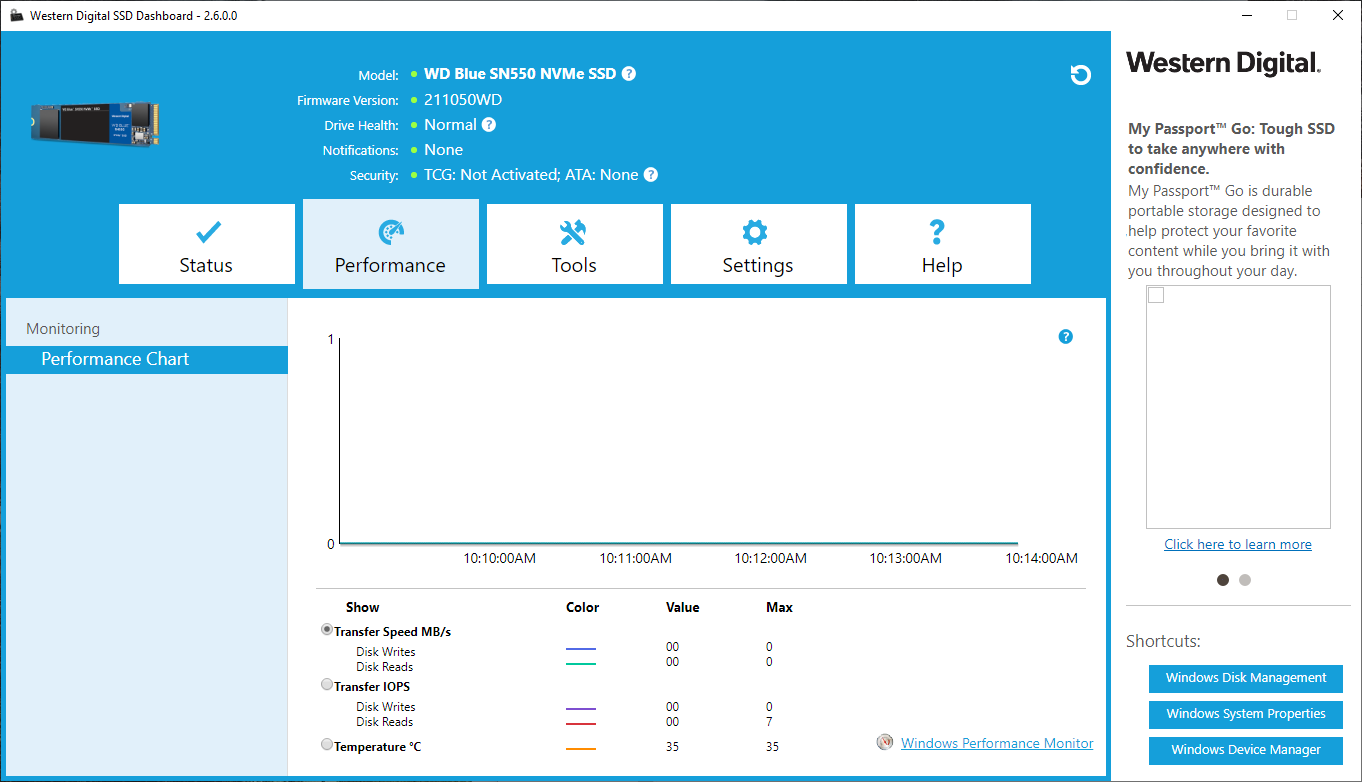
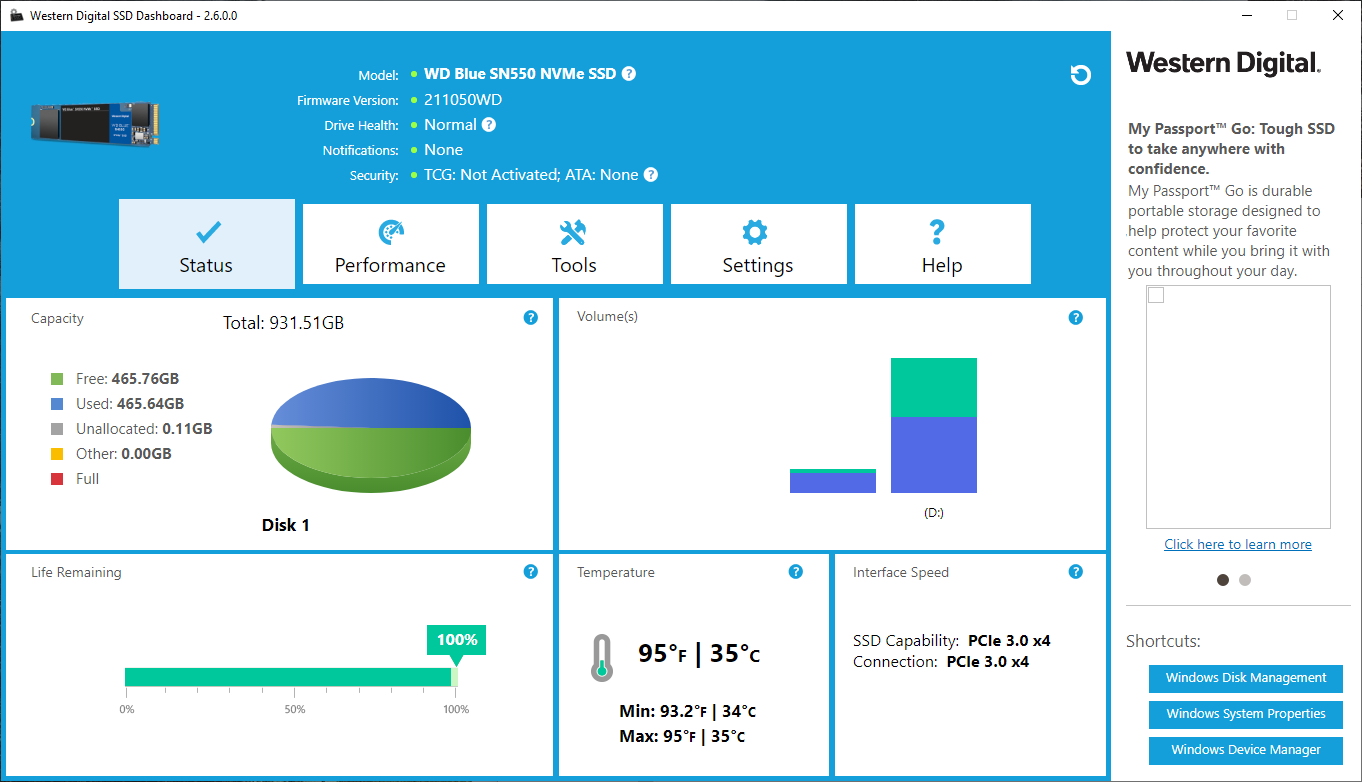
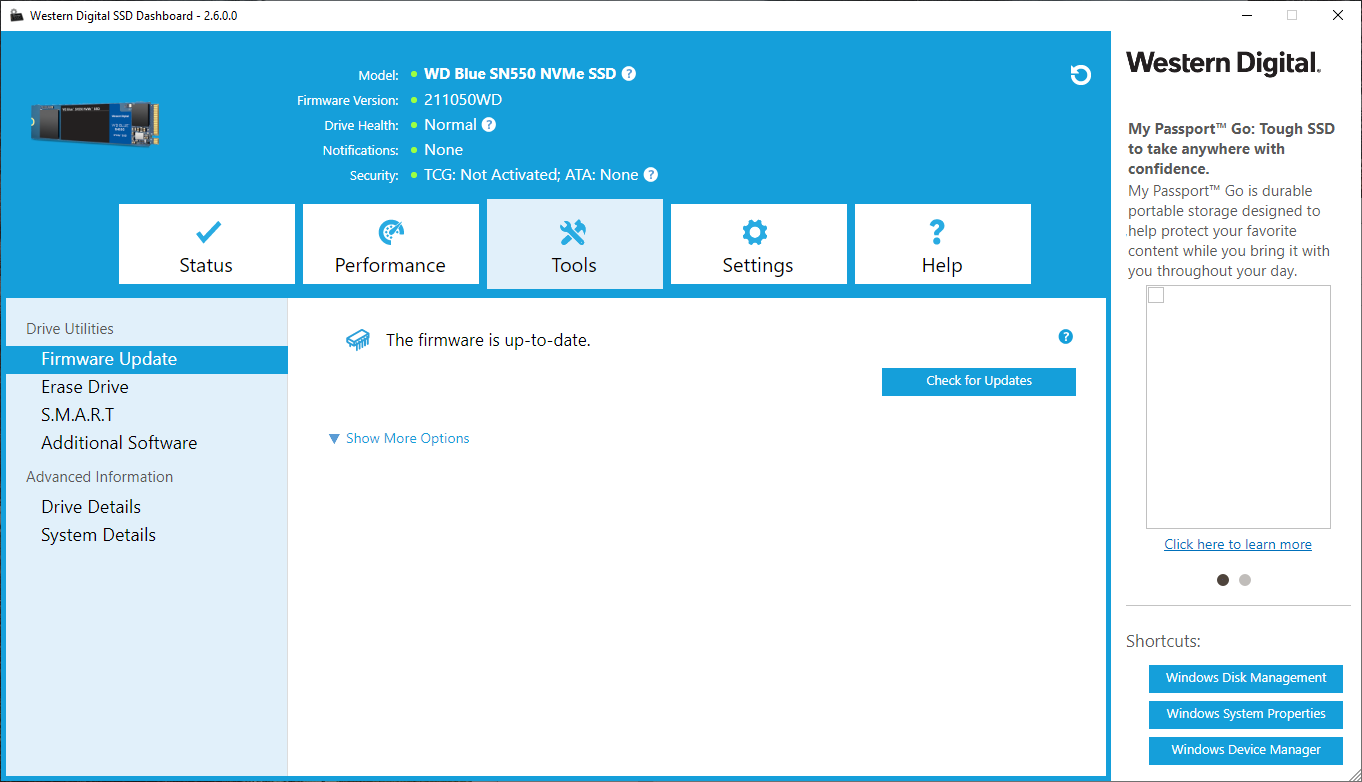
WD supports the company’s SSDs by providing end-users SSD toolbox, as well as cloning software. WD’s SSD Dashboard is a well-designed Windows-based SSD Toolbox. It allows you to monitor and analyze your SSD’s health, performance, as well as update the firmware if the company releases one in the future.
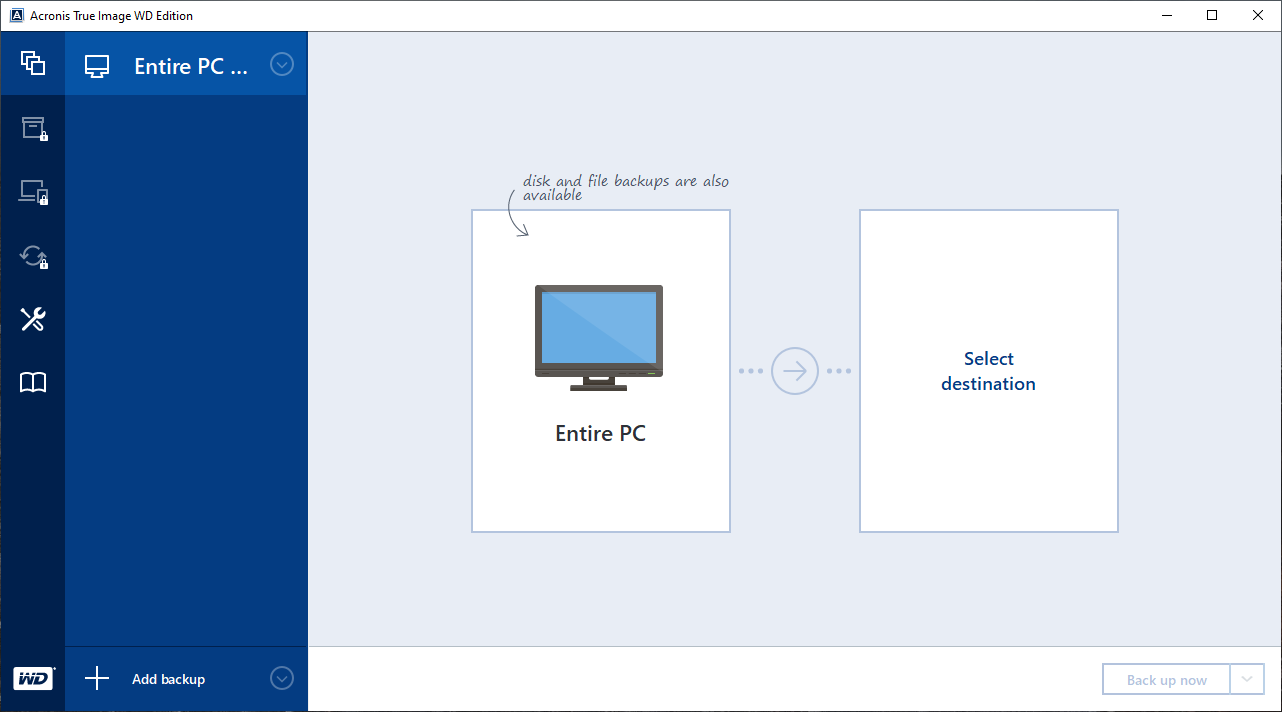

Along with the toolbox, Acronis True Image WD Edition is a simple-to-use cloning program that allows you to quickly and easily migrate your data from your old drive to your new WD SSD. It can also be used for creating system images for back up, which can be quite helpful if/when Windows decides to break after a system update.
Get Tom's Hardware's best news and in-depth reviews, straight to your inbox.
A Closer Look
True to its name, WD’s Blue SN550 comes with a blue PCB, in a single-sided M.2 2280 form factor, so it can fit in even the thinnest of devices. WD’s product team are fairly tight-lipped on disclosing hardware specifics enabling the Blue SN550 to perform how it does, but we managed to narrow things down a bit on our own.
WD designed the controller and firmware that powers the SSD. The Blue SN550’s NVMe 1.4-compliant controller interfaces with the host over a PCIe 3.0 x4 link, a step up from the x2 link the previous SN500 had, which helps performance a bit.
Architecturally, we think the new controller is close to WD's 28nm tri-core NVMe controller on the SN750. But the company cut it down a bit from an 8-channel design to 4-channels, and possibly lowered the core count or are using a smaller manufacturing process node due to its very compact size and low power consumption figures. This translates into a bit less peak performance, but better power efficiency. Plus, a simpler design can help lower the cost to manufacture.
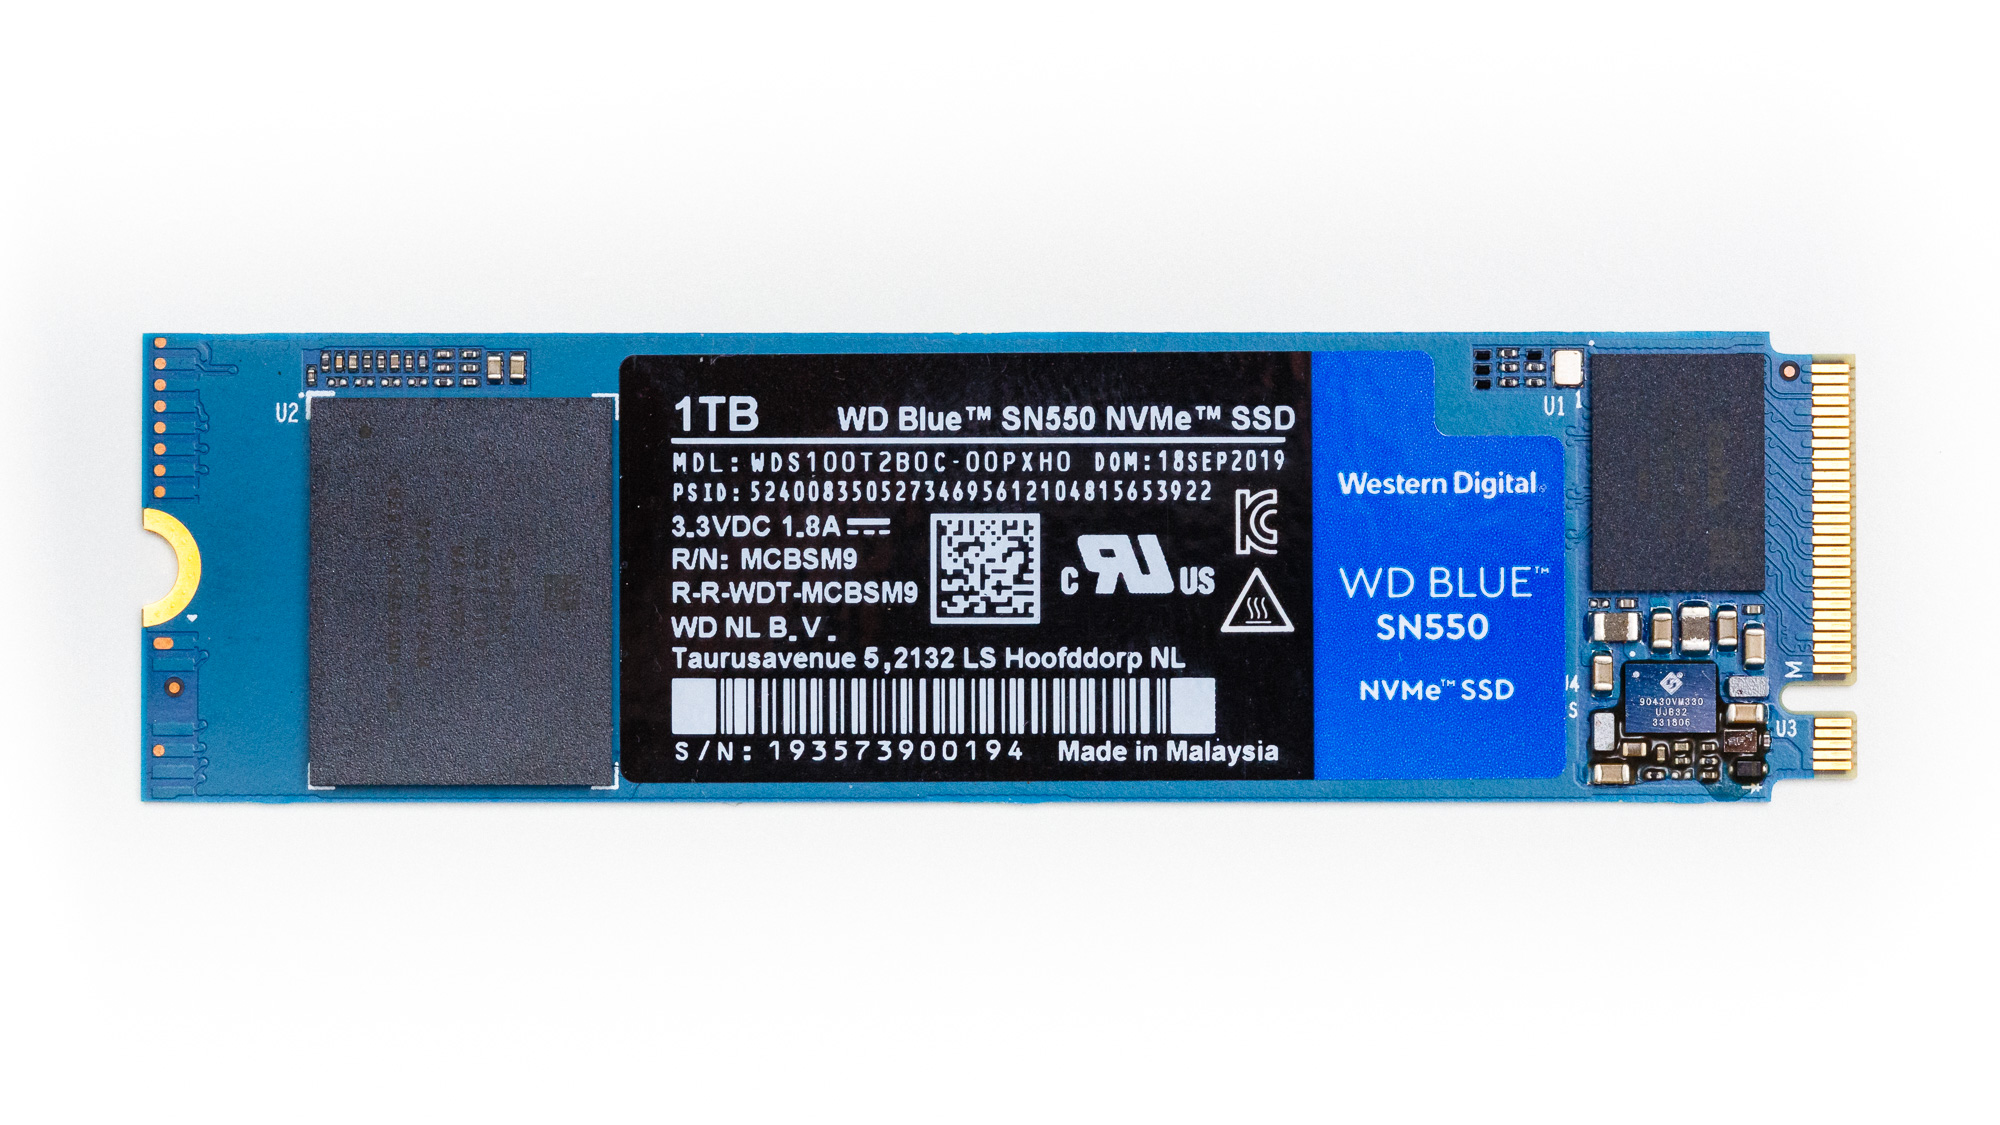
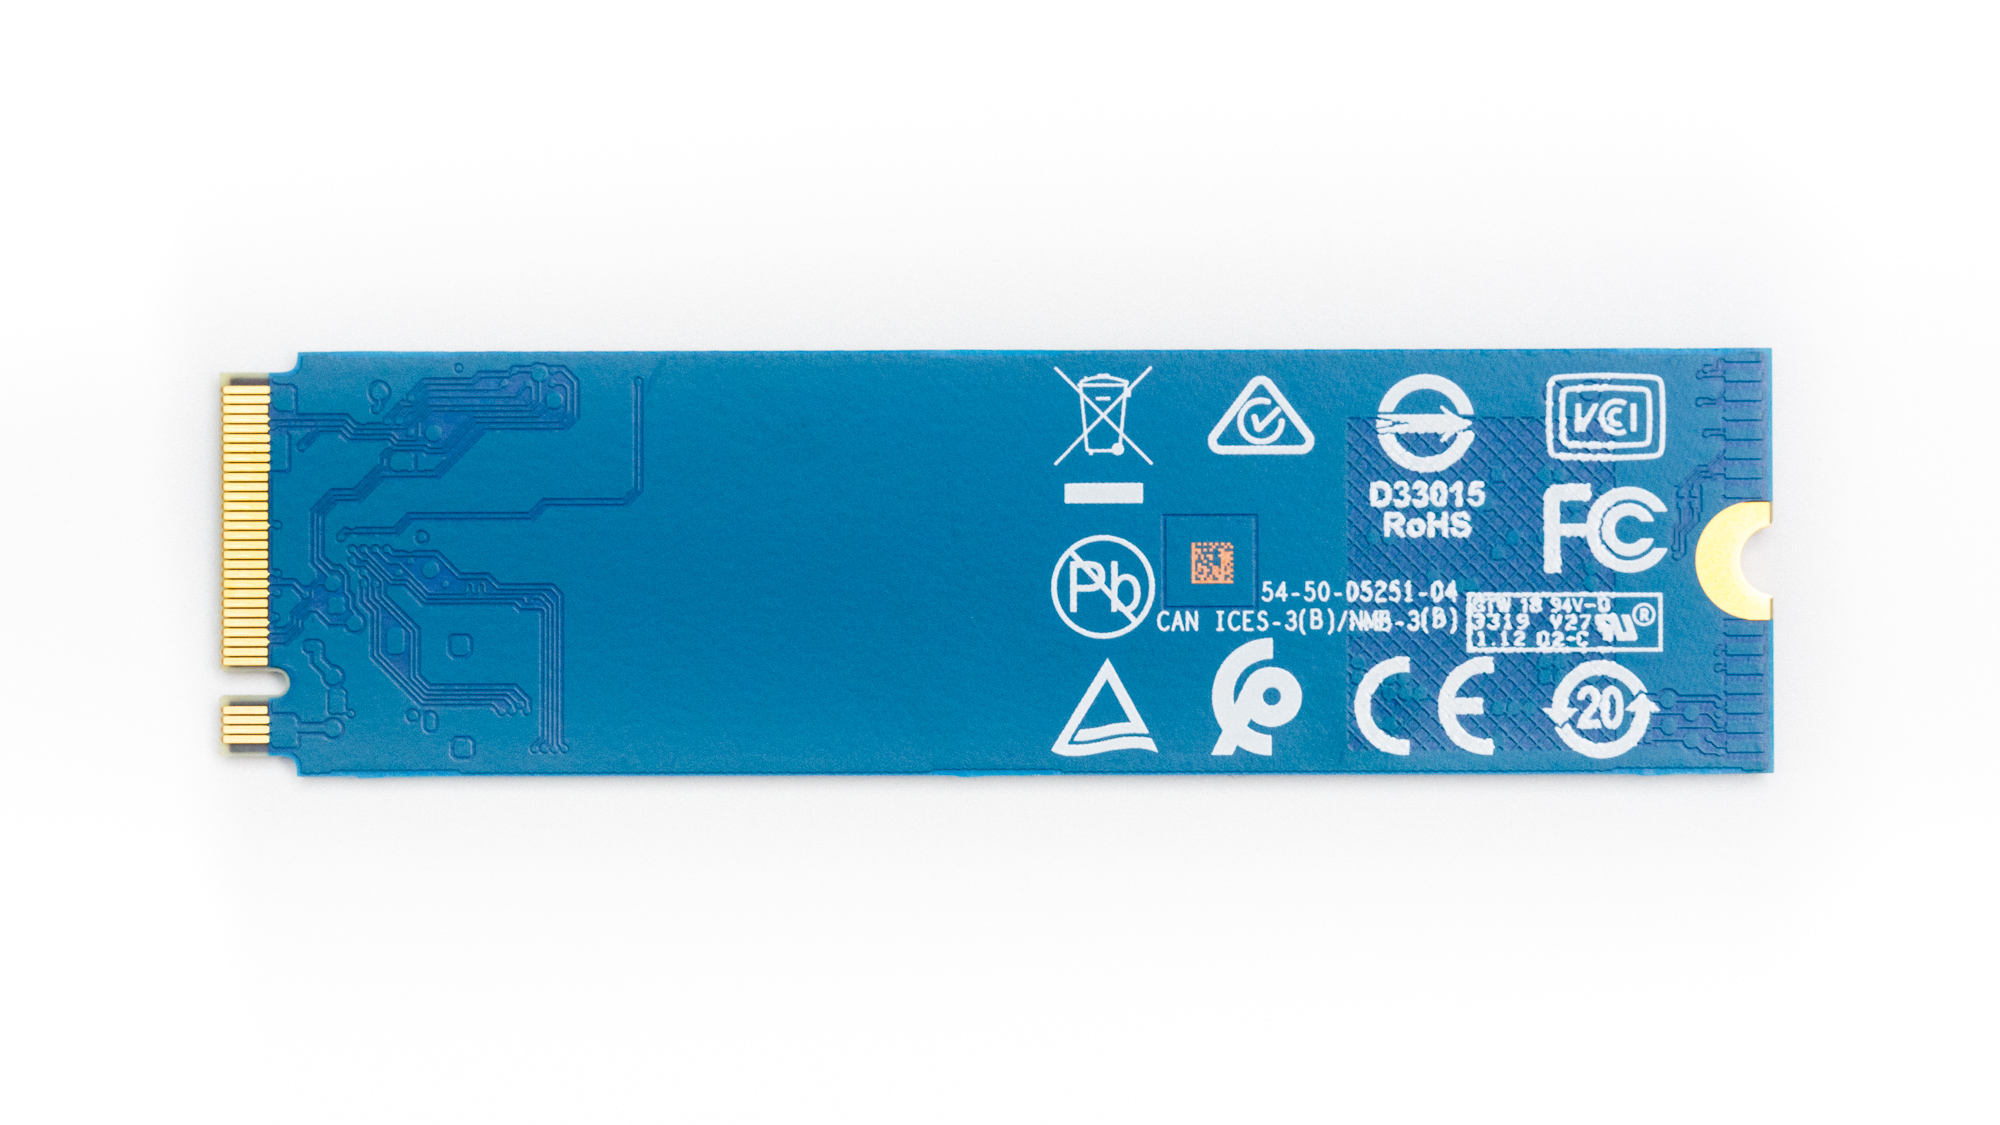
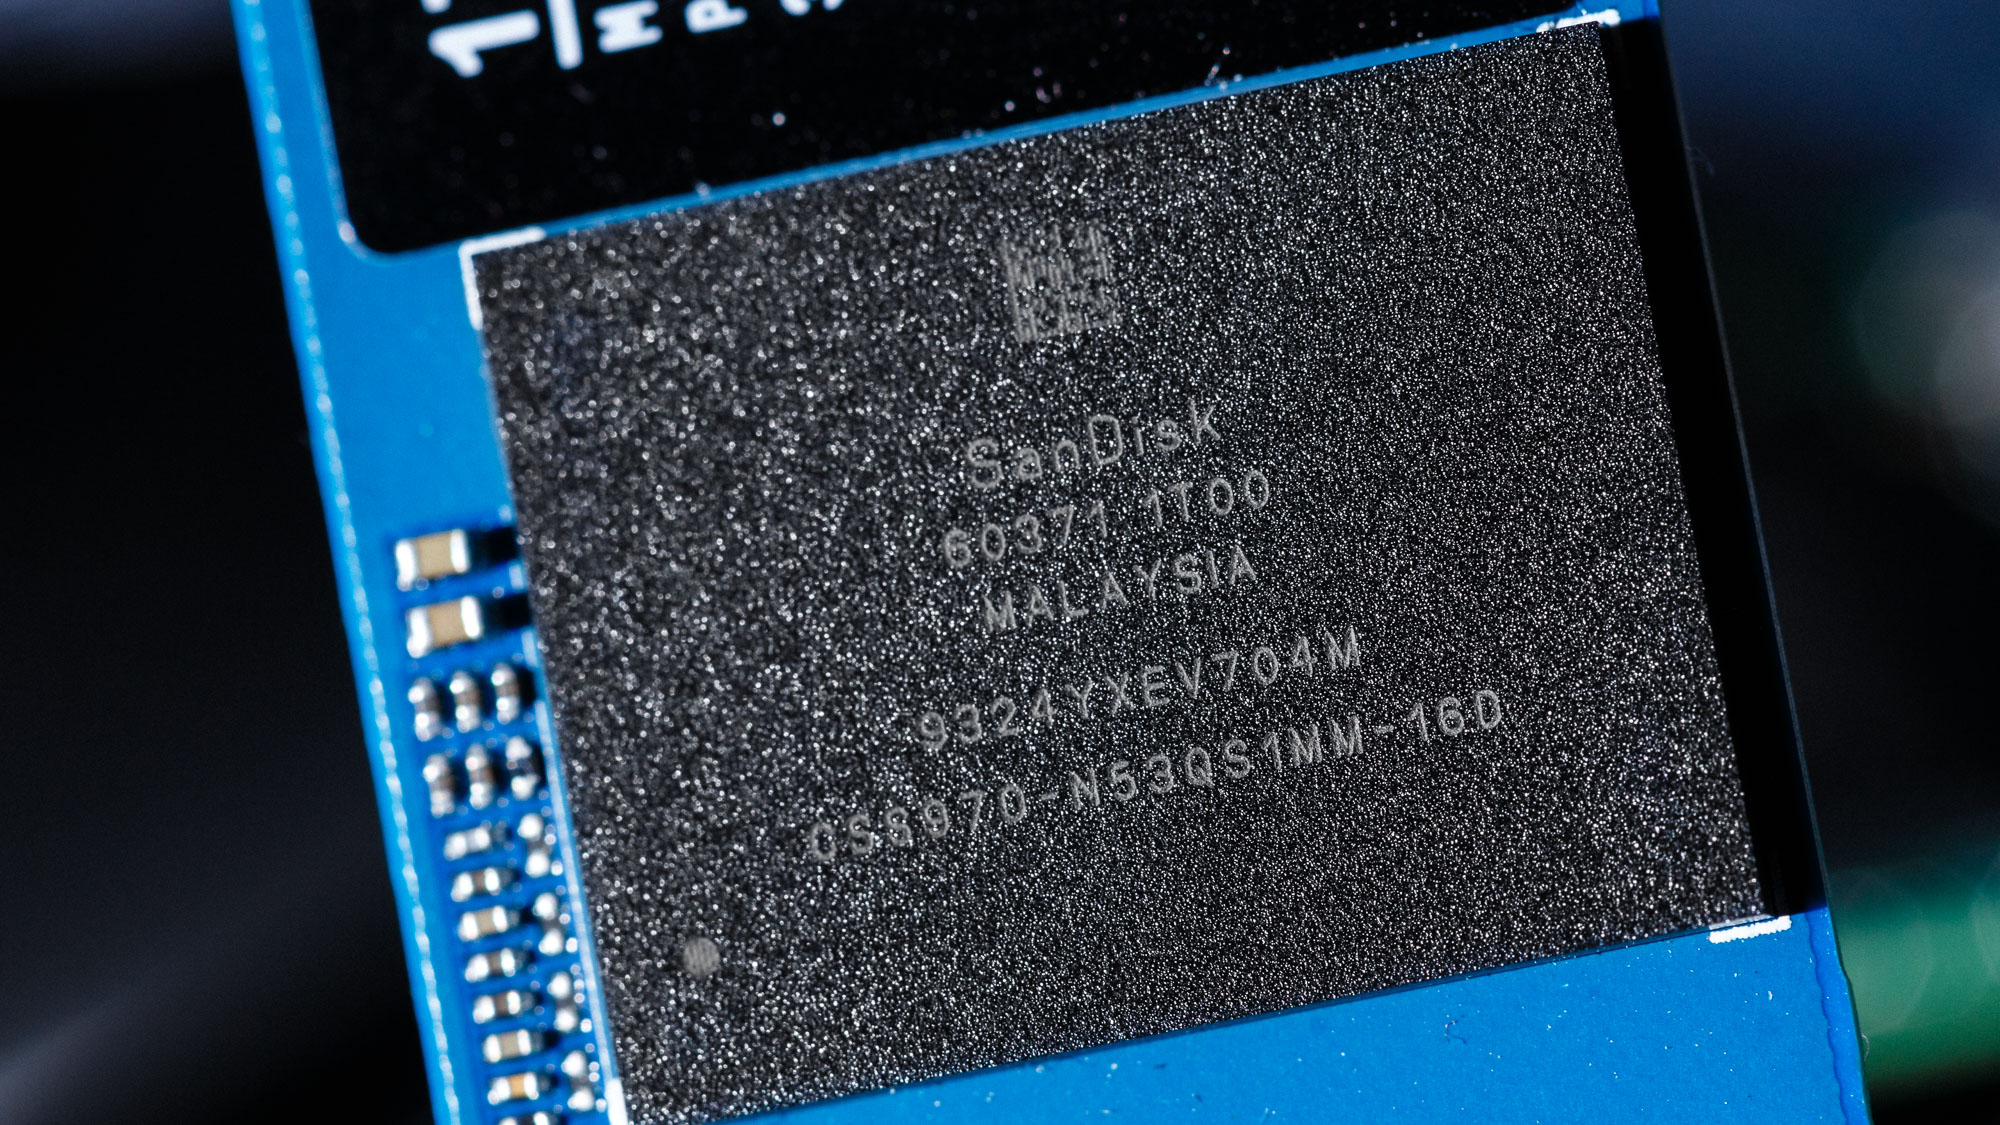
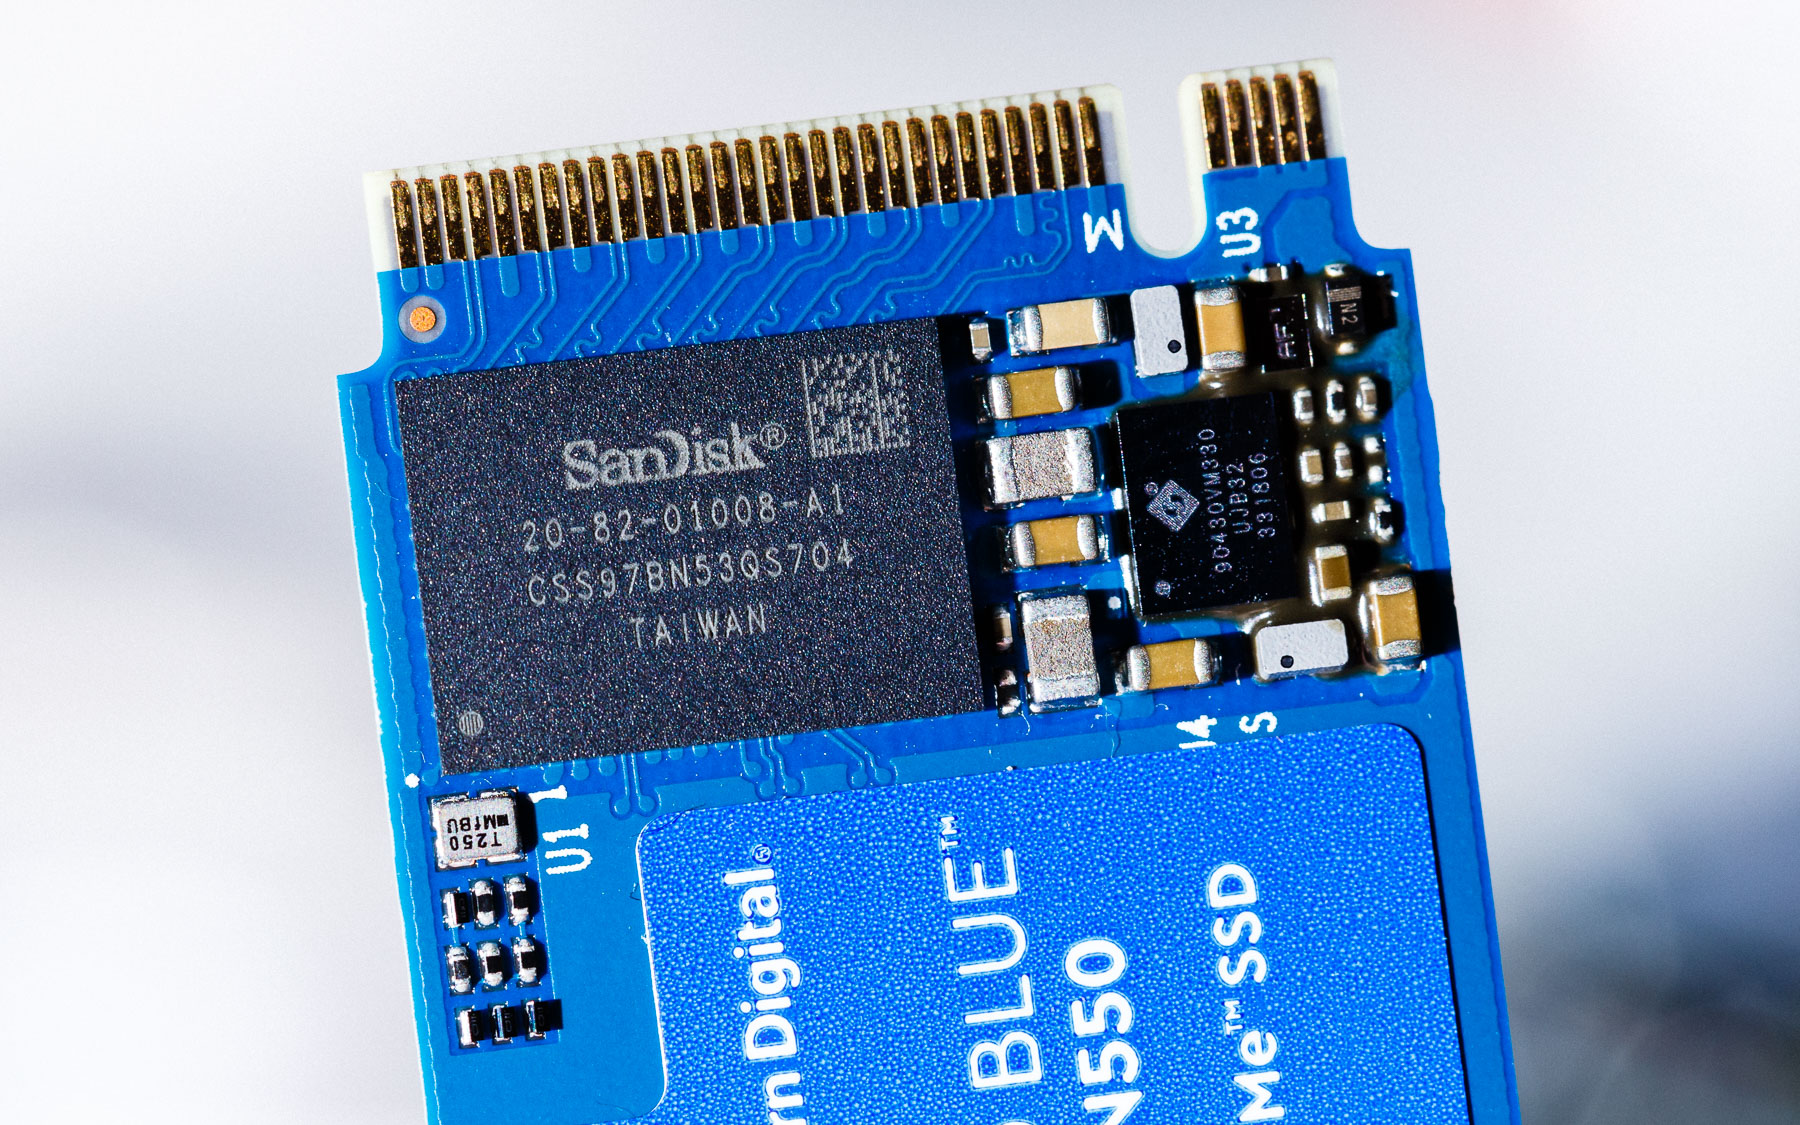
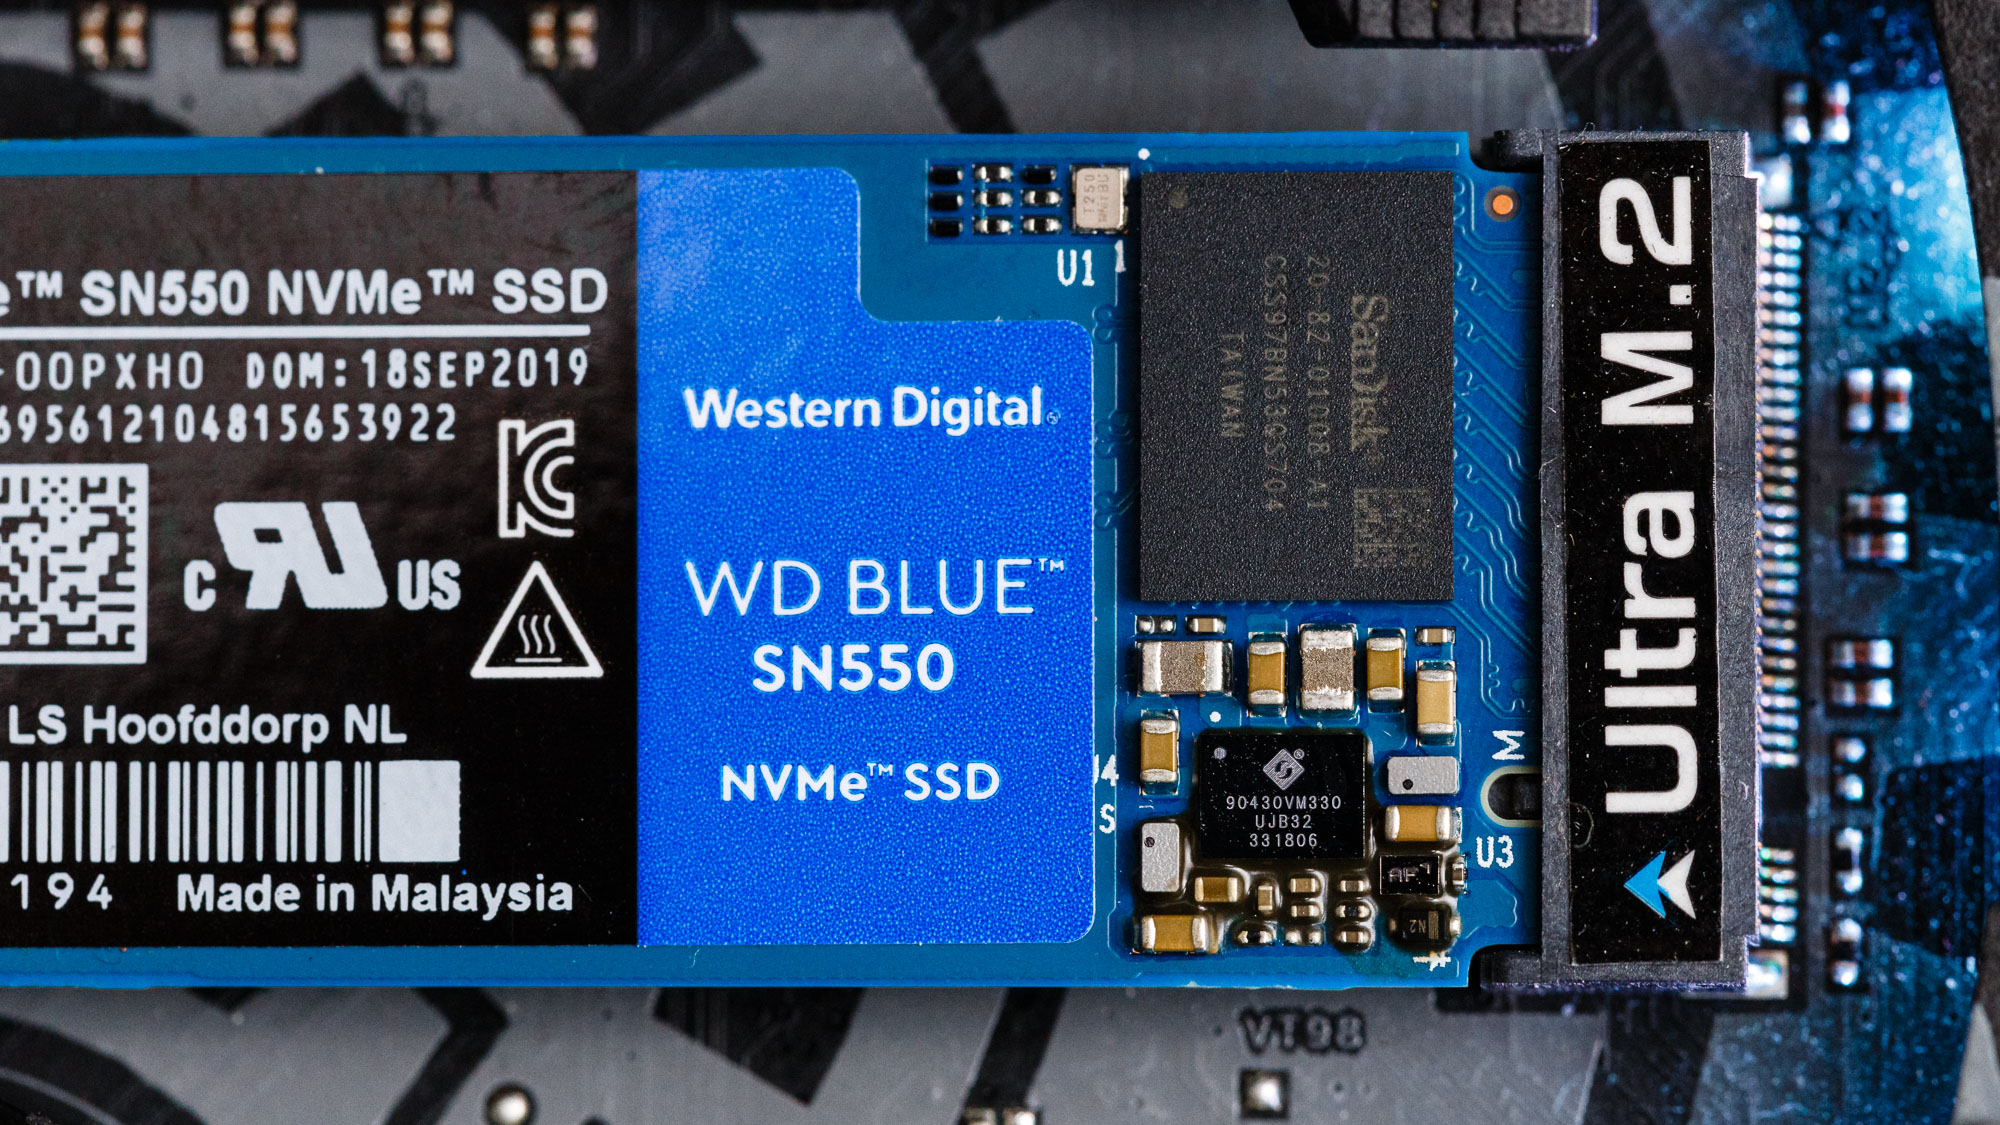
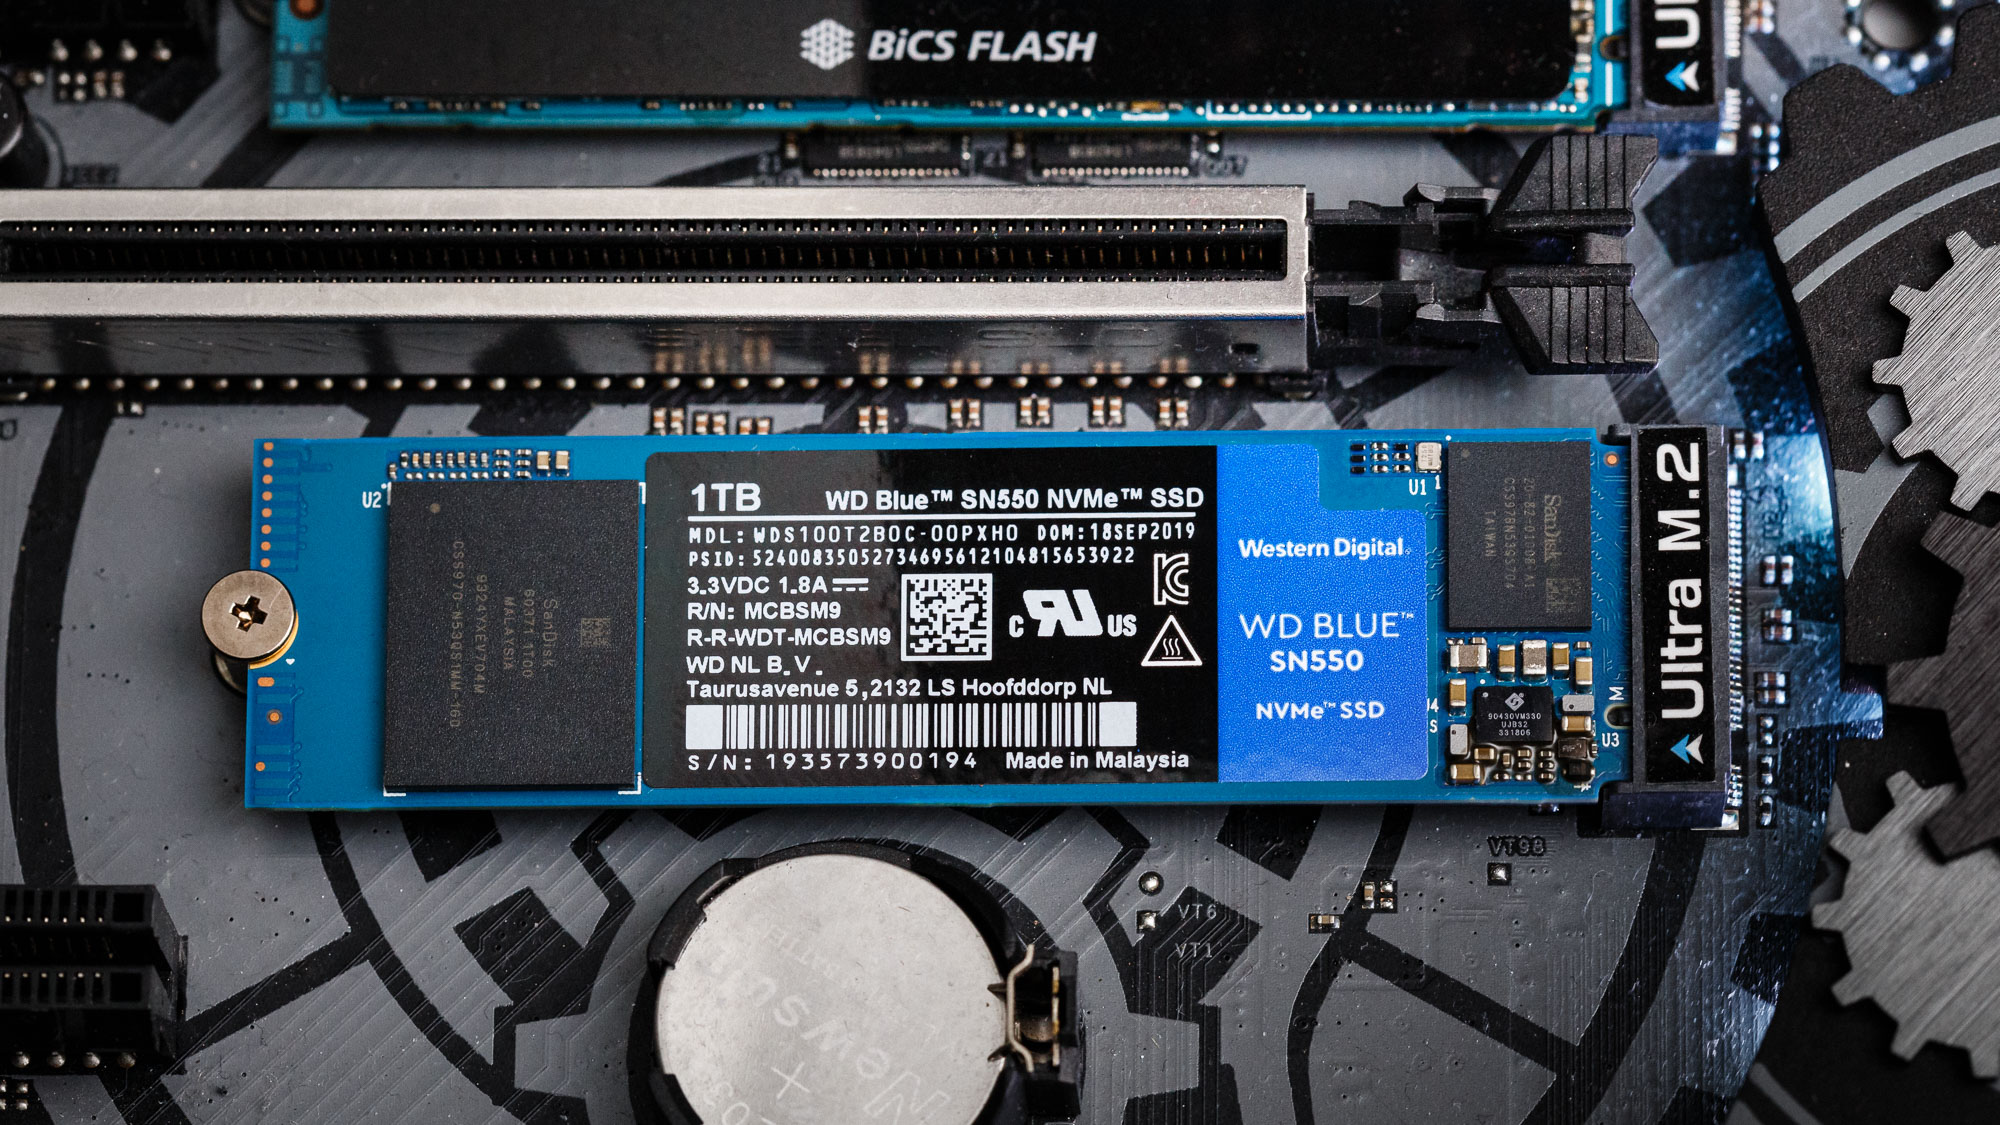
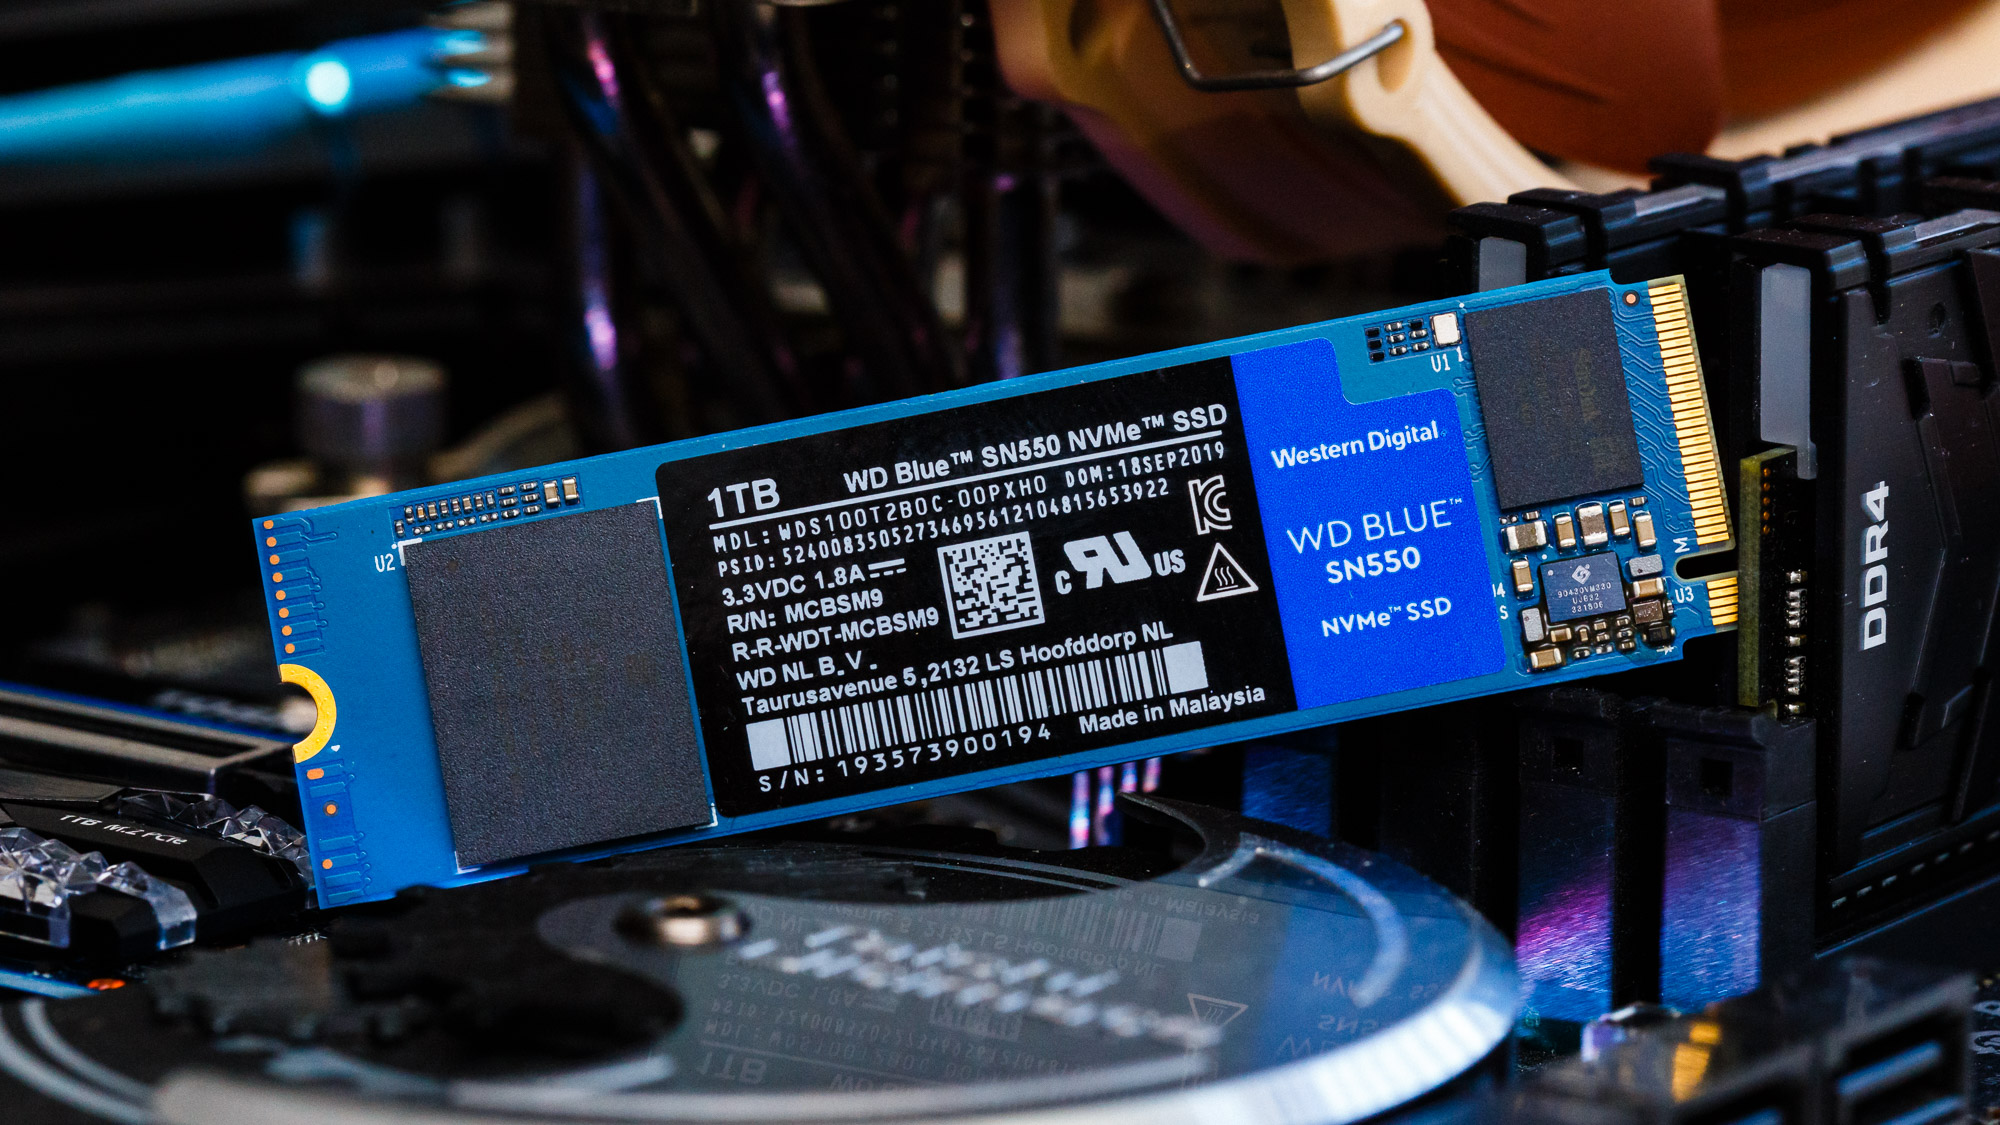
Most SSDs utilize DRAM or leverage NVMe’s Host Memory Buffer (HMB) feature to help accelerate Flash Translation Layer (FTL) tasks to ensure responsive performance. While the WD Blue SN500 went without DRAM or HMB and instead relied solely on a small portion of SRAM for the task, WD’s Blue SN550 adopts the feature. Windows reports a default allocation amount of 64MB of the host system’s DRAM.
Speaking of flash, WD is shipping the SN550 with SanDisk branded 96L BiCS4 TLC NAND flash. On our 1TB model, there is just one NAND package, filled with sixteen 512Gb dies, located on the opposite end of the PCB of the controller. This is WD’s way of upgrading the thermal design of the Blue for better-sustained performance, as separating the components like this helps to distribute and dissipate heat and prevents heat from one component soaking into the other.

Sean is a Contributing Editor at Tom’s Hardware US, covering storage hardware.
-
techgeek Looks like they need a little quality control over at WD. Look at all the flux left on the bottom right-hand corner (from the perspective of the picture) around all the SMD caps and diode near what I believe is the controller. Amazing that made it out of the factory like that.Reply -
Rdslw Reply
that's the point of "rock bottom cheapest ssd's anything that works is good ....techgeek said:Looks like they need a little quality control over at WD. Look at all the flux left on the bottom right-hand corner (from the perspective of the picture) around all the SMD caps and diode near what I believe is the controller. Amazing that made it out of the factory like that.
as most of cheap laptops are sold with sata ones, this is nice upgrade on the budget.
If it works that is, If such pieces end up on reviews I am afraid of what will arrive to normal consumers ... -
techgeek ReplyRdslw said:that's the point of "rock bottom cheapest ssd's anything that works is good ....
as most of cheap laptops are sold with sata ones, this is nice upgrade on the budget.
If it works that is, If such pieces end up on reviews I am afraid of what will arrive to normal consumers ...
Almost looked like there was solder rework done by a rookie. I would have gotten more than my wrist slapped if I'd left something like that in one of our downhole tools. Flux can cause electrical leakage at higher temperatures. -
bit_user Replywith a multi-gear ECC scheme
Huh? That's the first I've ever heard of such a thing. I think that warrants an explanation.
Also, what's going on with the "Sustained Write" graphs (slide 3+, in the second group from the bottom of page 2)? I don't understand why the write speed would apparently increase, over time. I expected the graphs to bend flatter, as the drives' SLC buffers filled up. Could this be an error in the measurement methodology? -
mchldpy Reply
===========================================techgeek said:Looks like they need a little quality control over at WD. Look at all the flux left on the bottom right-hand corner (from the perspective of the picture) around all the SMD caps and diode near what I believe is the controller. Amazing that made it out of the factory like that.
Can someone point out top a near-blind person which of the (7) pics it is.
Thanks -
seanwebster Replybit_user said:Huh? That's the first I've ever heard of such a thing. I think that warrants an explanation.
It's the same approach as since the WD Black NVMe (SN720 from 2018). Basically, WD's firmware optimizes the usage of multiple LDPC ECC algorithms. LDPC can take a long time to calculate when read errors are high later in the SSD's lifespan. When less ECC is needed (usually when newer/less worn), data will be retrieved using the first gear - an LDPC that aims for low power and high throughput. If the NAND is worn, then it may switch into second or third gear which increases the ECC and thus consume more power. These SSDs will utilize gear 1 most of their life.
I have it exponentially scale, somewhat. Double-check the time scale/x-axis. It's the same data. I chart it this way to view how much data can be written over time from another perspective. Kind of like pattern recognition for myself, too.bit_user said:Also, what's going on with the "Sustained Write" graphs (slide 3+, in the second group from the bottom of page 2)? I don't understand why the write speed would apparently increase, over time. I expected the graphs to bend flatter, as the drives' SLC buffers filled up. Could this be an error in the measurement methodology? -
bit_user Reply
I hadn't noticed. I feel like it'd give a more intuitive sense of what happens to transfer speeds over time, if it were linear in both X & Y. Just my opinion.seanwebster said:I have it exponentially scale, somewhat. Double-check the time scale/x-axis. It's the same data.
Thanks for the reply. A lot of authors on here don't seem to read the comments - not even the first few.
Also, nice review. I was worried it might not have the synthetic benchmarks, but I was glad when I finally got to them. Personally, I care mostly about synthetics. I like when random read IOPS are tested at queue depths 1, 2, and 4, FWIW. But QD1 is what matters most. -
Dreamslacker Replytechgeek said:Looks like they need a little quality control over at WD. Look at all the flux left on the bottom right-hand corner (from the perspective of the picture) around all the SMD caps and diode near what I believe is the controller. Amazing that made it out of the factory like that.
Actually, that is probably underfill for the controller which is a small CSP chip. Considering the position (close to the connector) and the size/ type of the chip, the underfill is probably laid to protect against stress (thermally induced and mechanically from insertion). -
seanwebster Reply
I'll look into it. I have it compressed this way because it creates a tail whip pattern to allow me to quickly differentiate good vs bad write performance over sustained writes.bit_user said:I hadn't noticed. I feel like it'd give a more intuitive sense of what happens to transfer speeds over time, if it were linear in both X & Y. Just my opinion.
Thanks for the reply. A lot of authors on here don't seem to read the comments - not even the first few.
Also, nice review. I was worried it might not have the synthetic benchmarks, but I was glad when I finally got to them. Personally, I care mostly about synthetics. I like when random read IOPS are tested at queue depths 1, 2, and 4, FWIW. But QD1 is what matters most.
I have QD 1-128 on 4K random and 128 seq results data for manufacturer comparison. Optimally, for synthetic testing, I'd do a filesize and QD sweep like I do with enterprise stuff, but for consumers, that would be a lot of data for little value. I used to plot QD1-4 and the average before, but I just don't think it is worth plotting beyond QD1 on random because one file size doesn't always relate to what real-world performance will be like. And, performance isn't hugely different between drives in QD2-4 that it matters to show. That, and I think because the application test results speak for themselves more than anything. At the end of the day, responsiveness to real-world like use is most important.
Let me know if you would like to see any other tests/data. I'm always looking for something new and worthwhile to add. :)