Why you can trust Tom's Hardware
Performance Results for WD Blue SN550 1TB
Rating: 4.5 (Editor's Choice)
Verdict: WD’s Blue SN550 is a substantial update to the Blue line-up. It is fast, efficient, and comes into the market at a low cost per GB. We highly recommend it to those looking for a low-cost M.2 drive.
+ FOR
- Competitive performance
- Affordable and efficient
- 5-year warranty
- AGAINST
- 1TB maximum capacity
- Not pretty
- Small SLC cache
- Power optimization on desktops could be better
Comparison Products for WD Blue SN550 1TB
Today, we pit the WD Blue SN550 up against a variety of worthy competitors as well as a few alternatives to better reveal value. From WD, we threw in the Black SN750, the company’s high-end NVMe SSD, and a 6TB WD Black 7200RPM HDD. From Crucial, we've included the P1, a QLC based NVMe SSD and the MX500, a very popular SATA SSD. Also, we dropped in the Kingston A2000, Intel SSD 665p, and Team Group's MP33 as alternative value options. Finally, we added in one of our favorite SSDs, the Adata XPG SX8200 Pro, and one of the fastest SSDs PCIe 4.0 SSDs available, the Corsair Force MP600. Let's take a look at where the WD Blue SN550 lands in this diverse group of drives.
Game Scene Loading - Final Fantasy XIV
The Final Fantasy XIV StormBlood and Stormbringer are two free real-world game benchmarks that easily and accurately compare game load times without the inaccuracy of using a stopwatch.
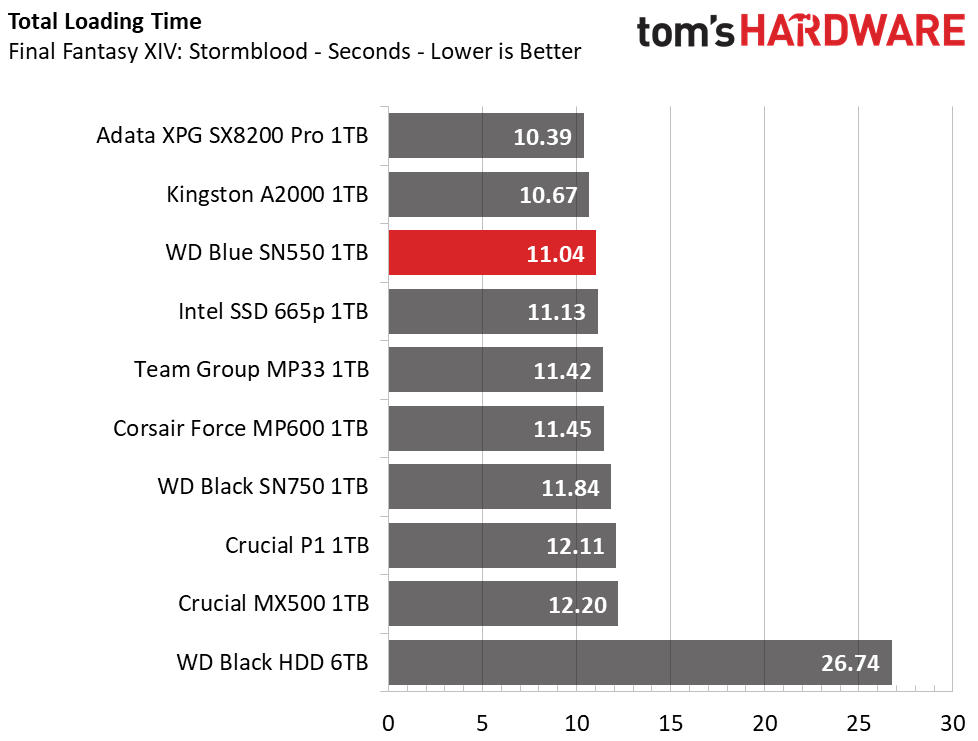
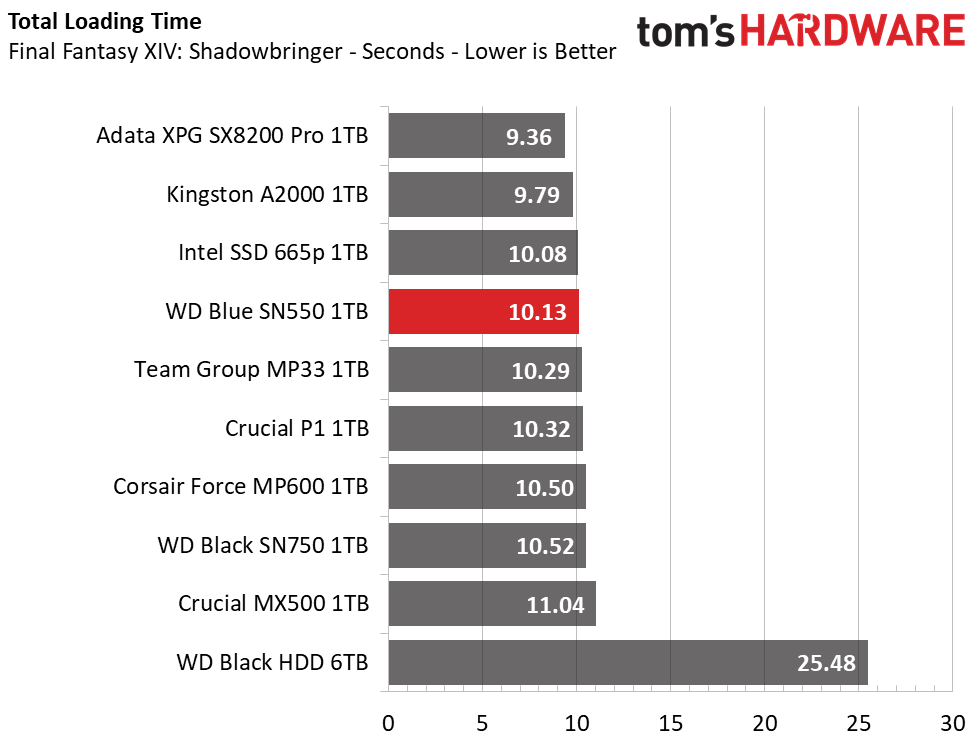
WD’s Blue SN550 ranks well overall here, scoring third and fourth place in the Stormblood and Shadowbringer benchmarks, respectively. It also manages to outperform the more-expensive WD Black SN750 ad well as the Corsair Force MP600. It's also more than twice as fast as the HDD at loading the game files.
Get Tom's Hardware's best news and in-depth reviews, straight to your inbox.
Transfer Rates – DiskBench
We use the DiskBench storage benchmarking tool to test file transfer performance with our own custom blocks of data. Our 50GB data set includes 31,227 files of various types, like pictures, PDFs, and videos. Our 100GB includes 22,579 files with 50GB of them being large movies. We copy the data sets to new folders and then follow-up with a reading test of a newly written 6.5GB zip file, 8GB test file, and a 15GB movie file.
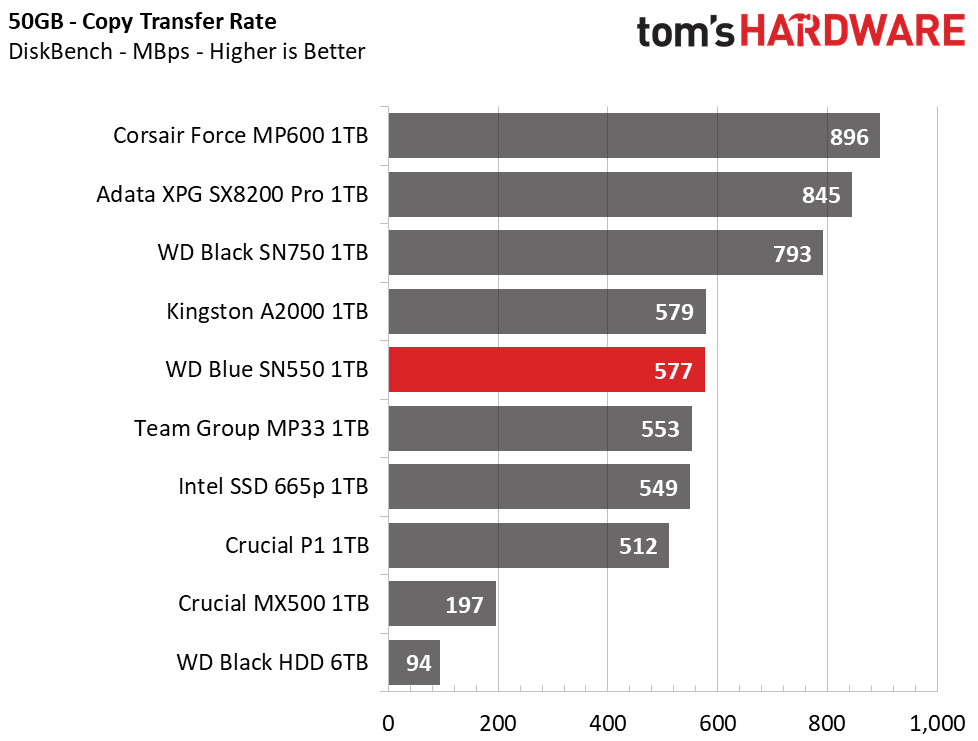
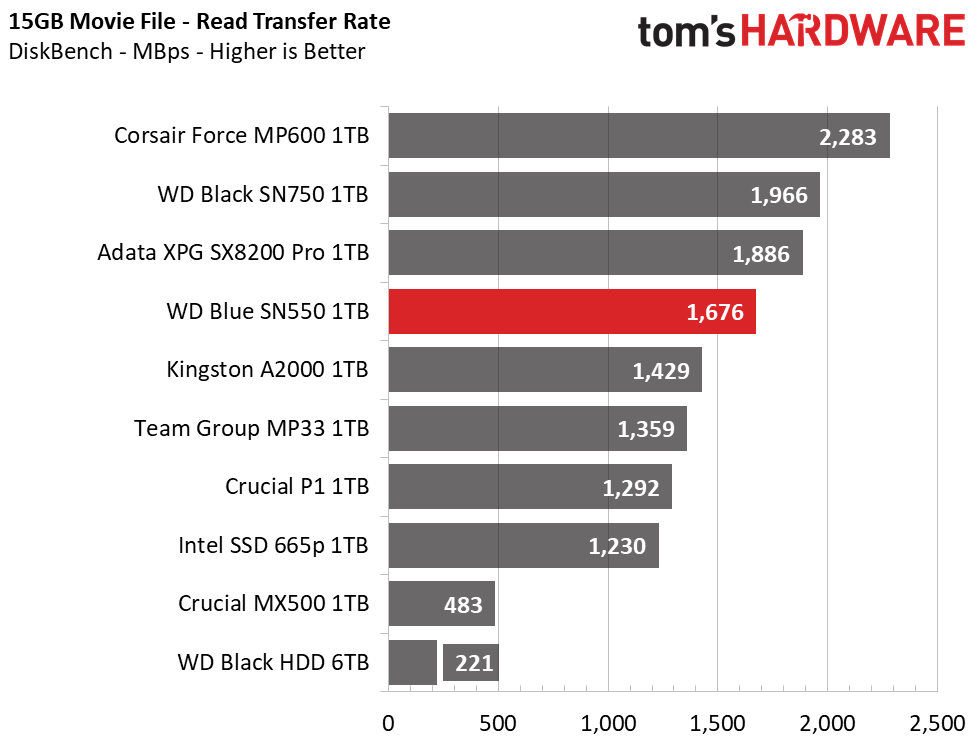
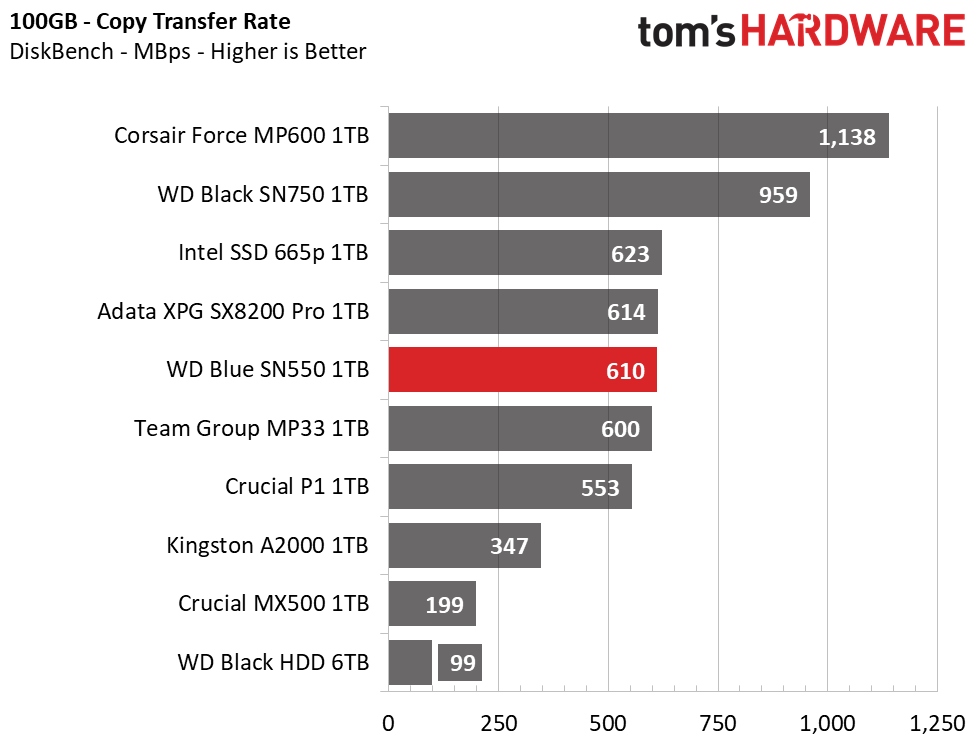
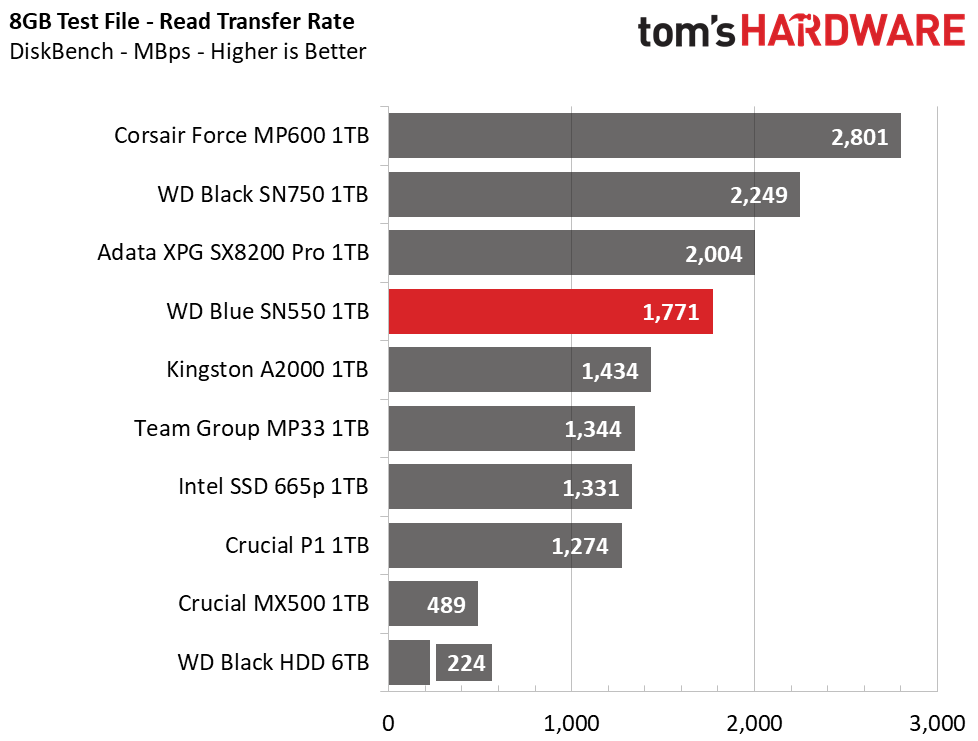
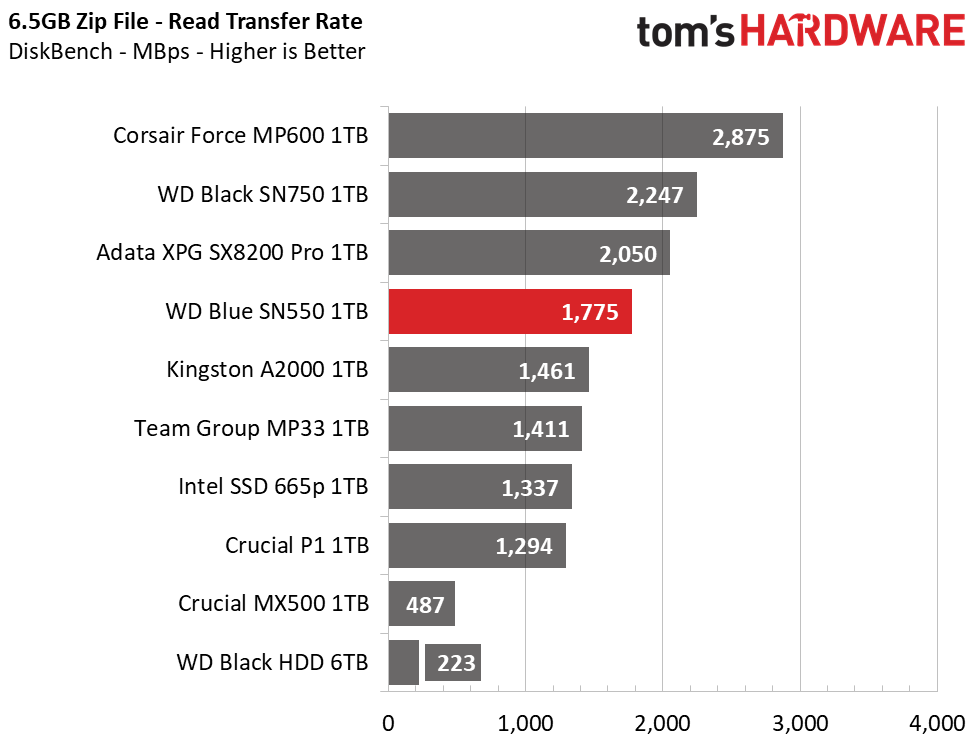
If you often deal with massive file transfers, clearly WD’s Black SN750 or Corsair’s Force MP600 are the way to go with their more robust controllers. However, WD’s Blue SN550 will provide adequate performance for most.
Its copy performance aligns with most of the alternative value options and ranks the drive at fifth place in those tests. In reading back data, the WD Blue ranks in fourth place with a clear advantage over the other value competitors. Its read performance is impressively almost as fast as the Adata XPG SX8200 Pro.
Trace Testing – PCMark 10 Storage Tests
PCMark 10 is a trace-based benchmark that uses a wide-ranging set of real-world traces from popular applications and common tasks to measure the performance of storage devices. The quick benchmark is more relatable to those who use their PCs lightly, while the full benchmark relates more to power users. If you are using the device as a secondary drive, the data test will be of most relevance.
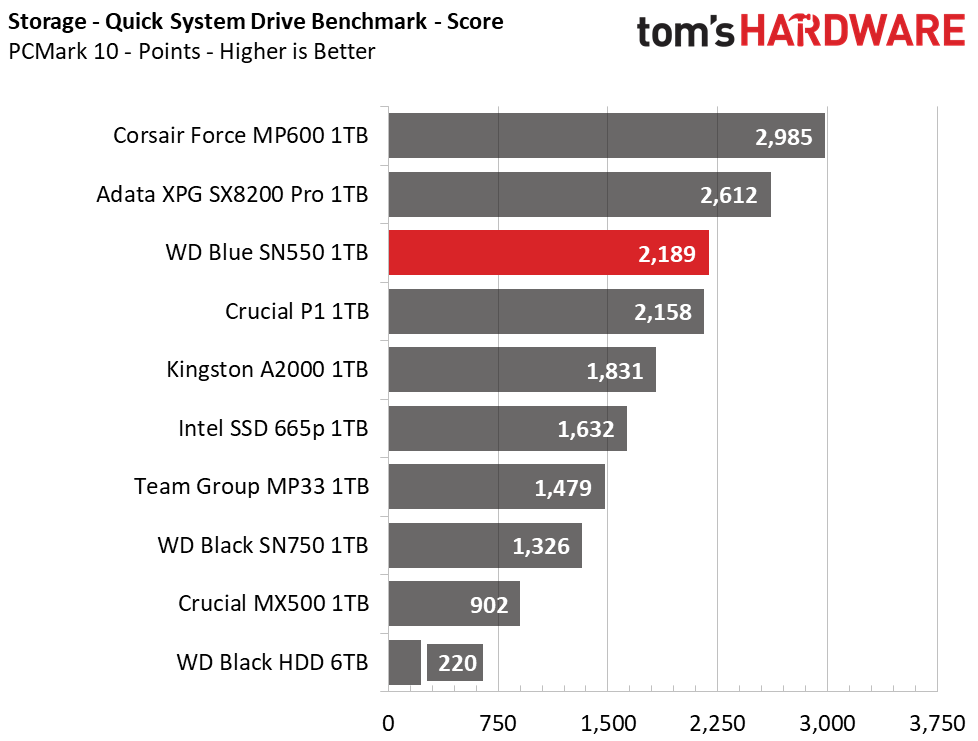
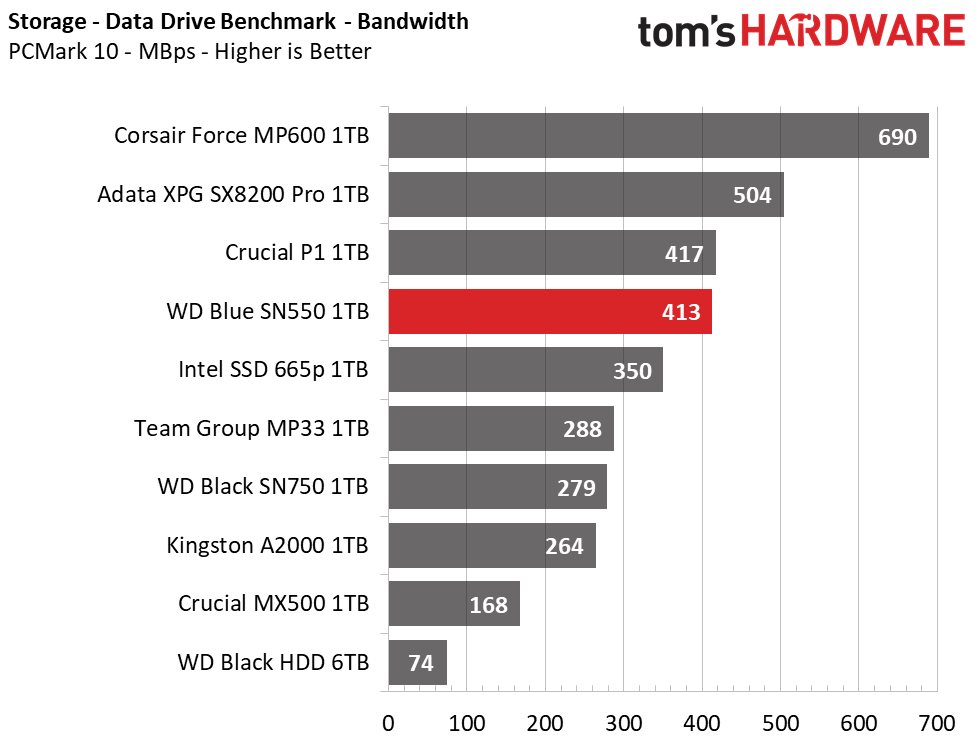
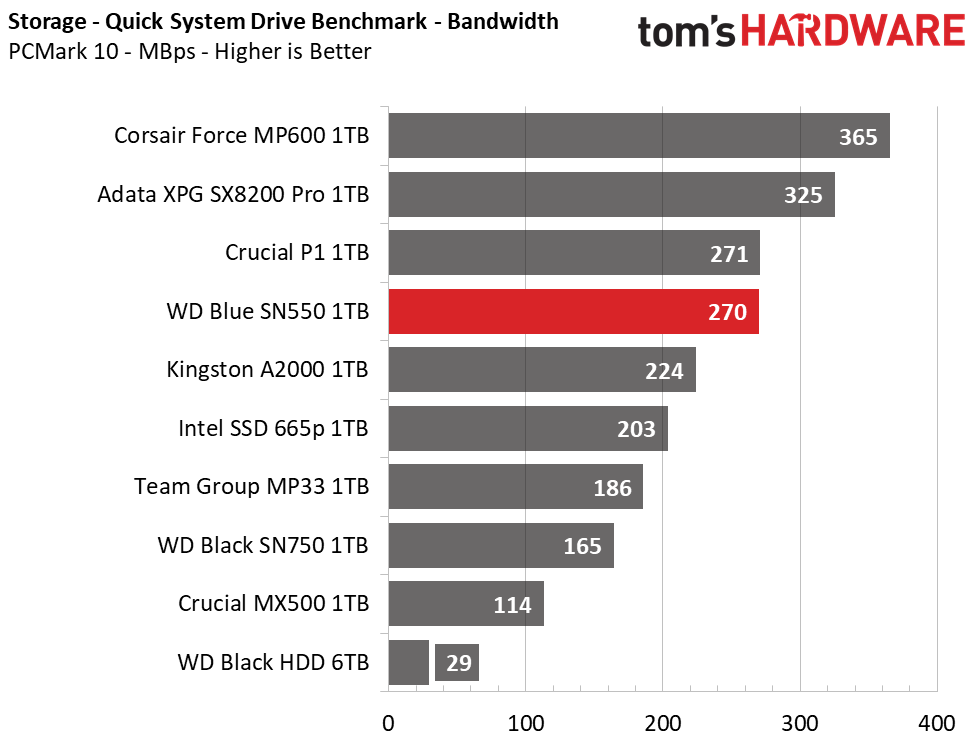
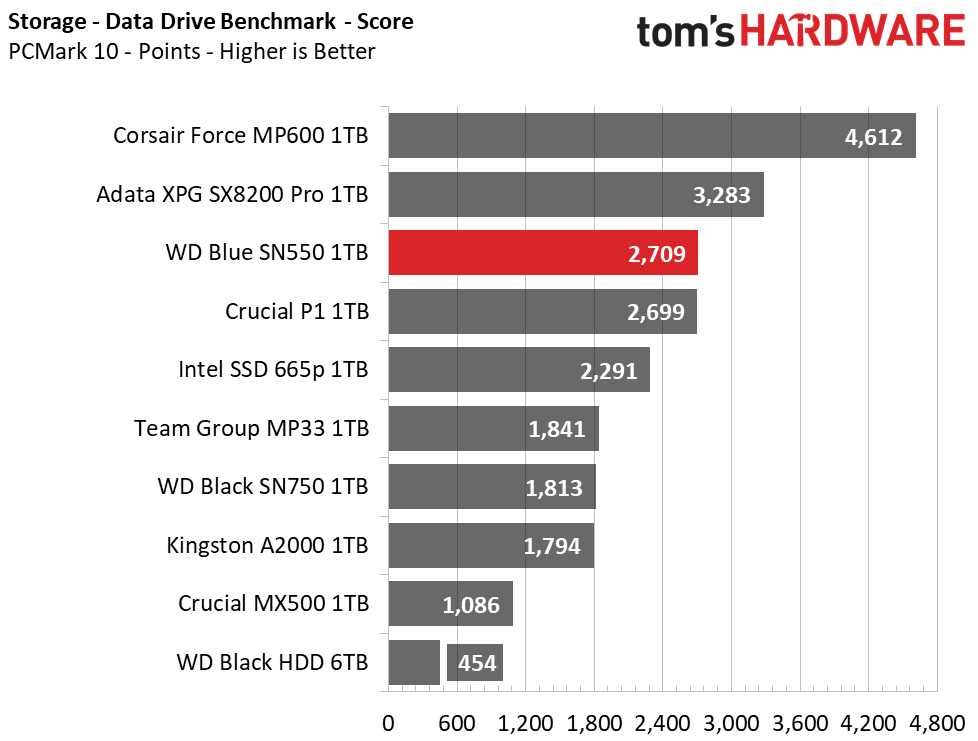
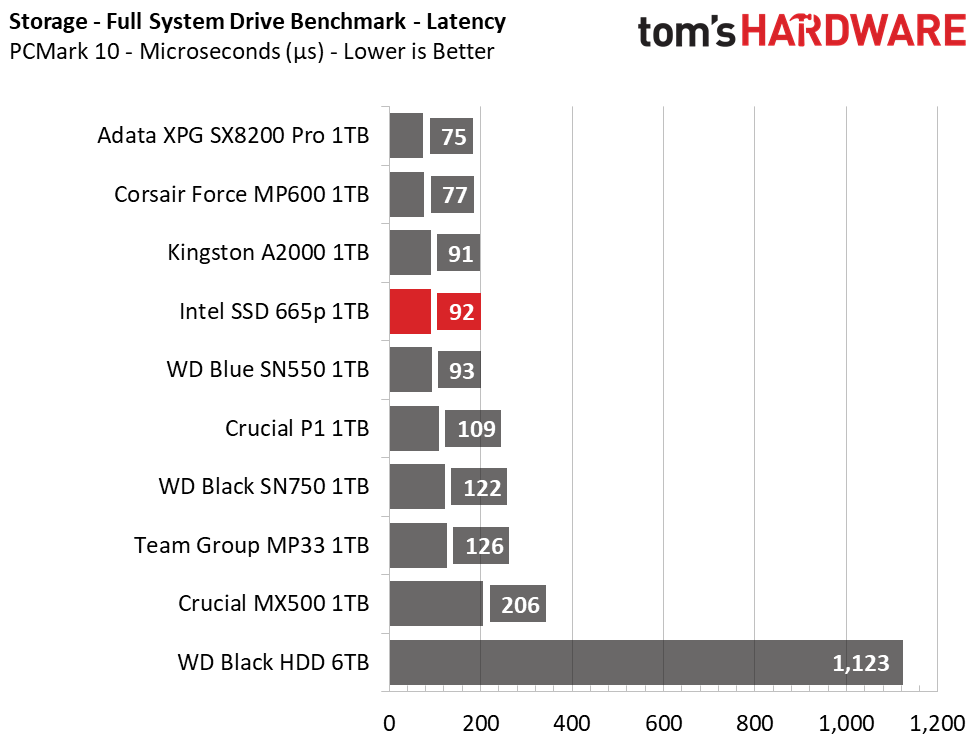
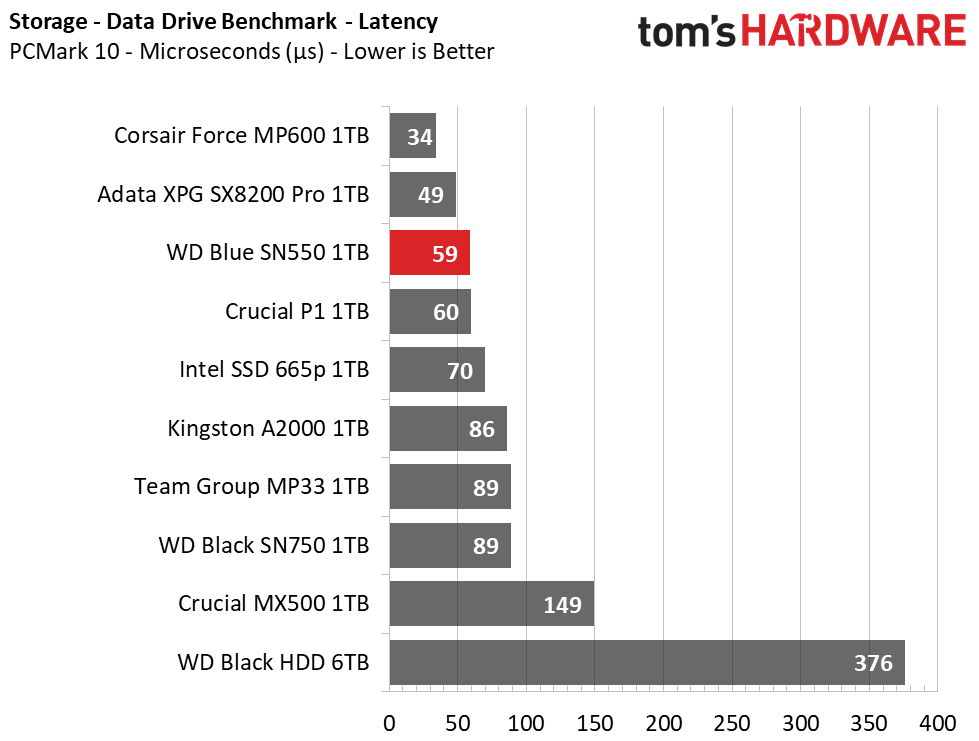
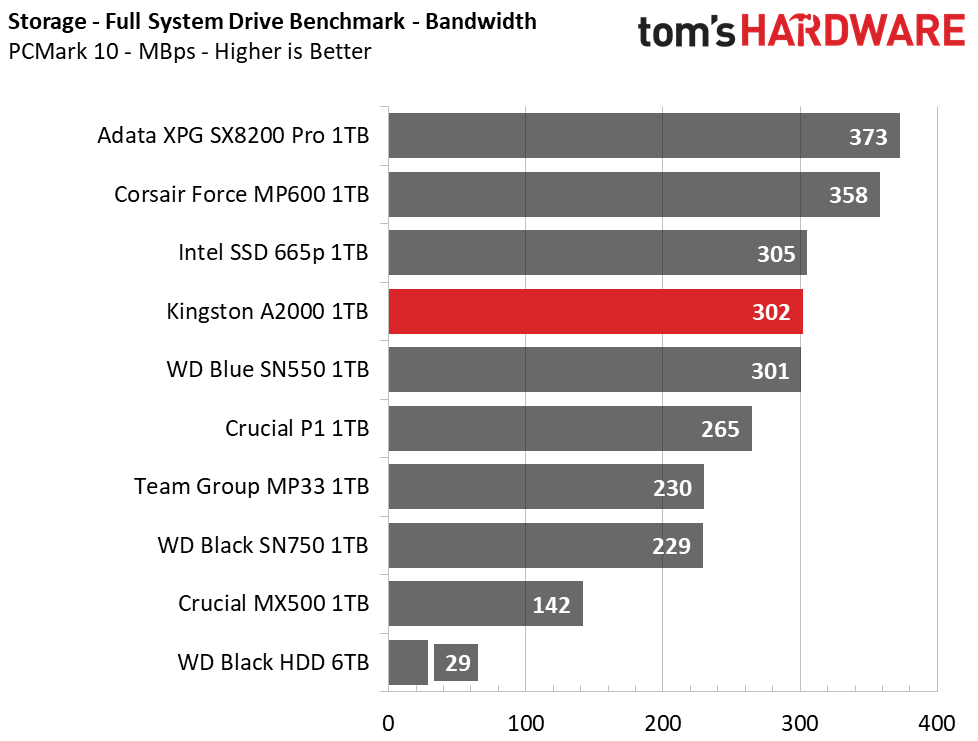
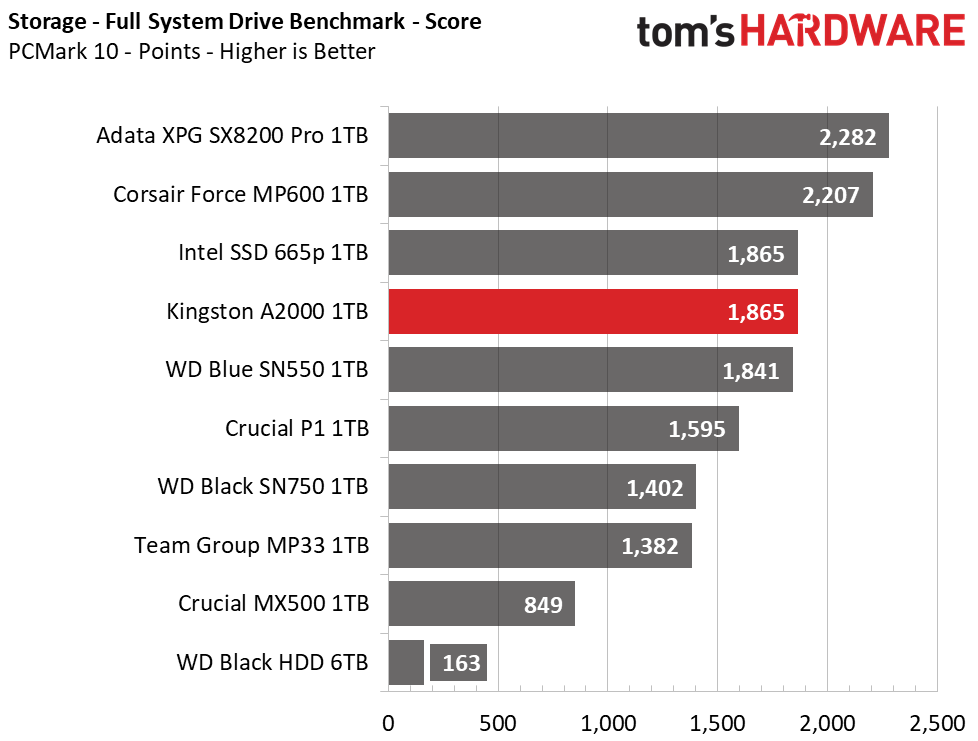
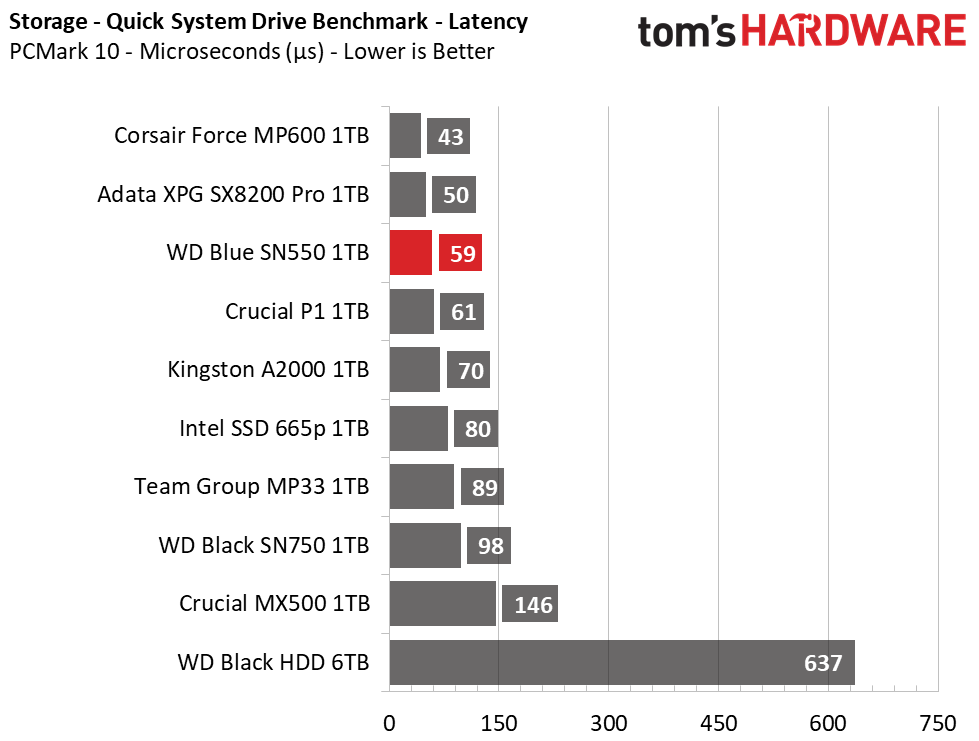
Scoring third place in both the data and quick benchmarks, the WD Blue SN550 excels, providing responsive operation. Crucial’s P1 delivered very similar performance with higher bandwidth, although with just a hair more latency.
Surprisingly, the WD Blue even outperforms the Black SN750 again in all of PCMark 10’s storage benchmarks. Under the full benchmark, the Intel SSD 665p and Kingston A2000 take second and third place, bumping down the WD Blue to fourth. But overall there isn’t all that much difference in performance between the three in PCMark10’s most demanding workload test.
Trace Testing – SPECworkstation 3
Like PCMark 8, SPECworkstation 3 is a trace-based benchmark, but it is designed to push the system harder by measuring workstation performance in professional applications.
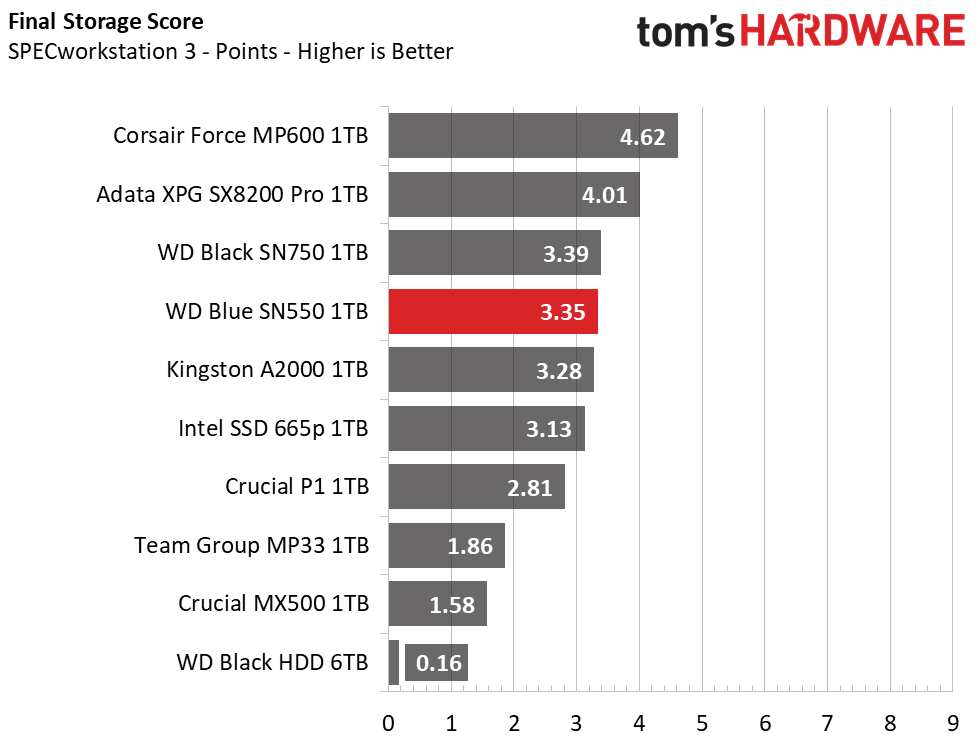
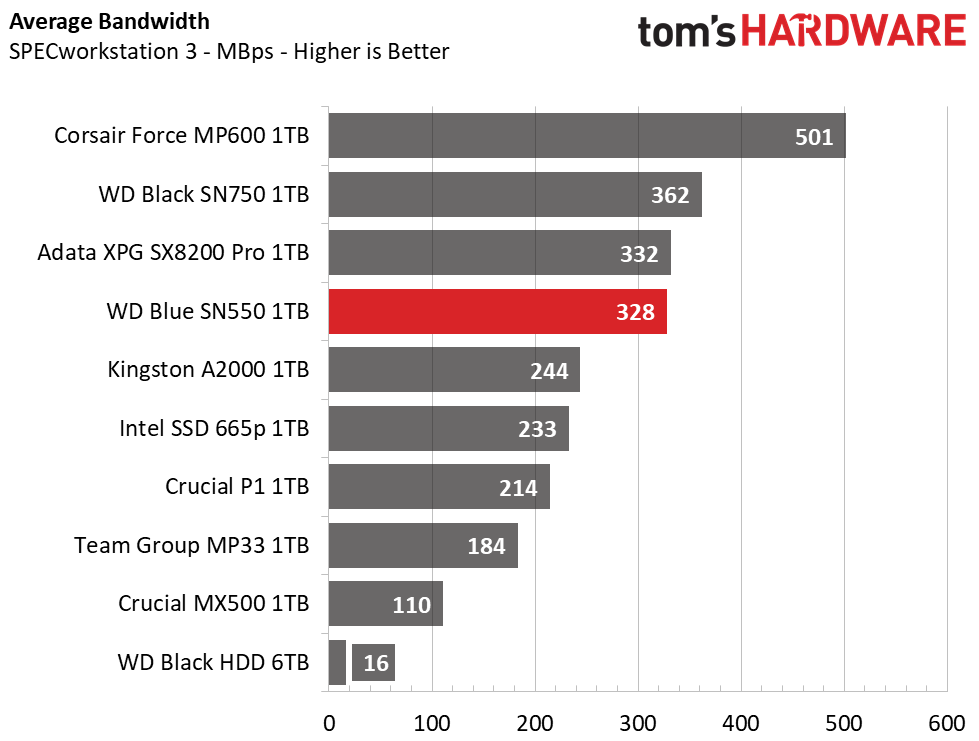
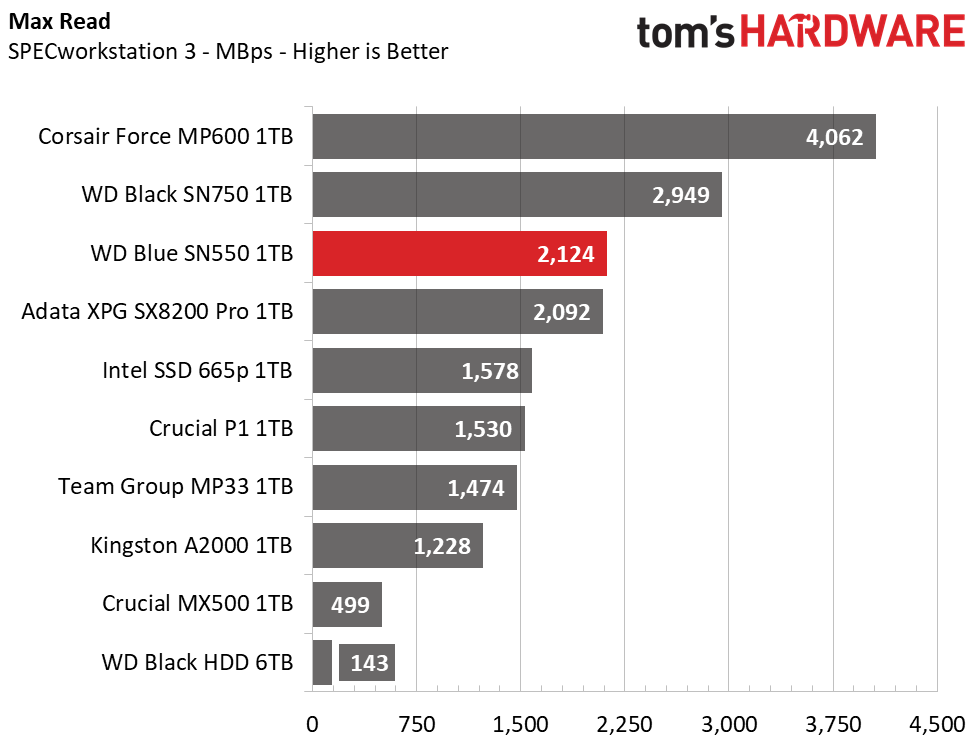
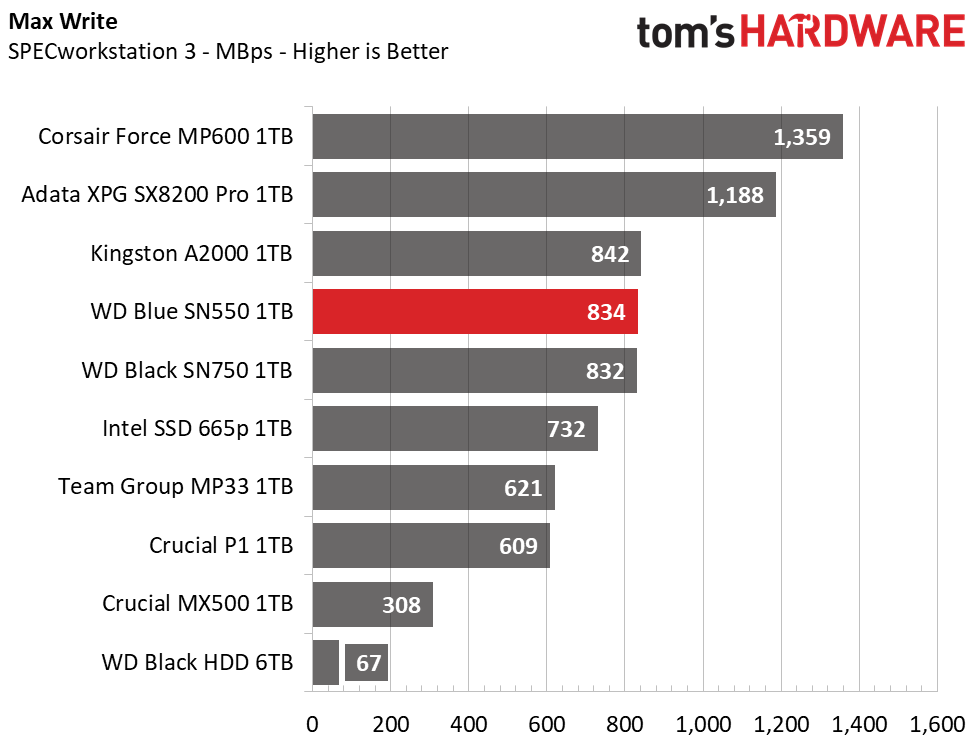
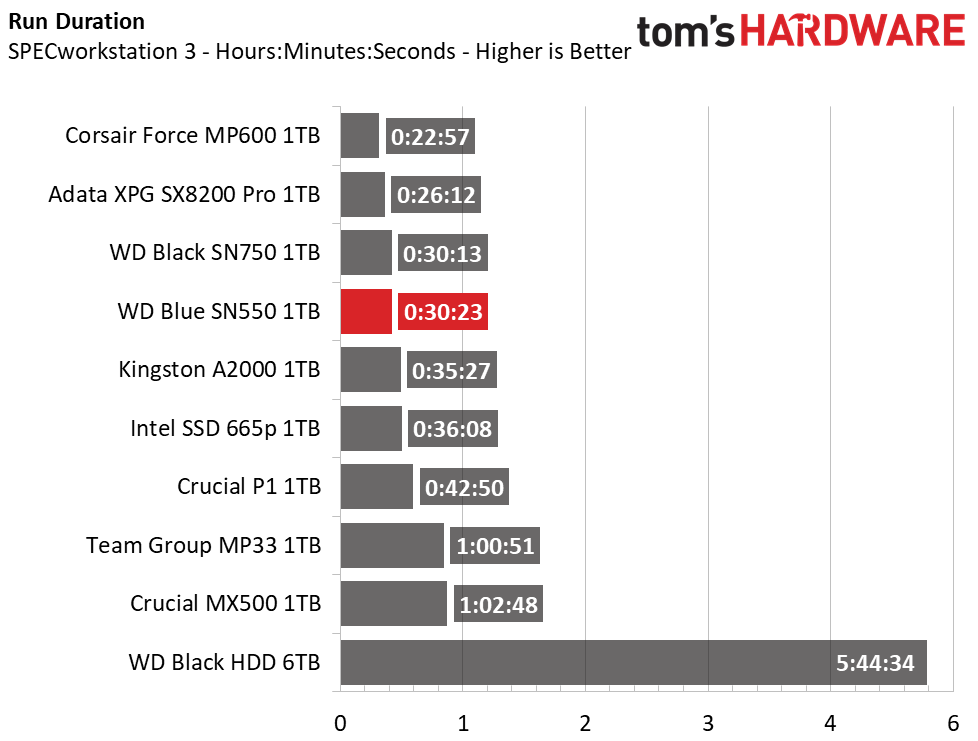
With less idle time to recover and a lot more reading and writing going on, SPECworkstation 3’s benchmark is a low-end SSD killer. But while WD’s Blue SN550 is a low-cost SSD, it provides nearly the same performance as WD’s Black SN750, despite its limited bandwidth. Overall, it ranks in fourth place and should provide plenty of performance for those looking to use the drive in their new workstation just as much as a new gaming build.
Synthetics - ATTO
ATTO is a simple and free application that SSD vendors commonly use to assign sequential performance specifications to their products. It also gives us insight into how the device handles different file sizes.
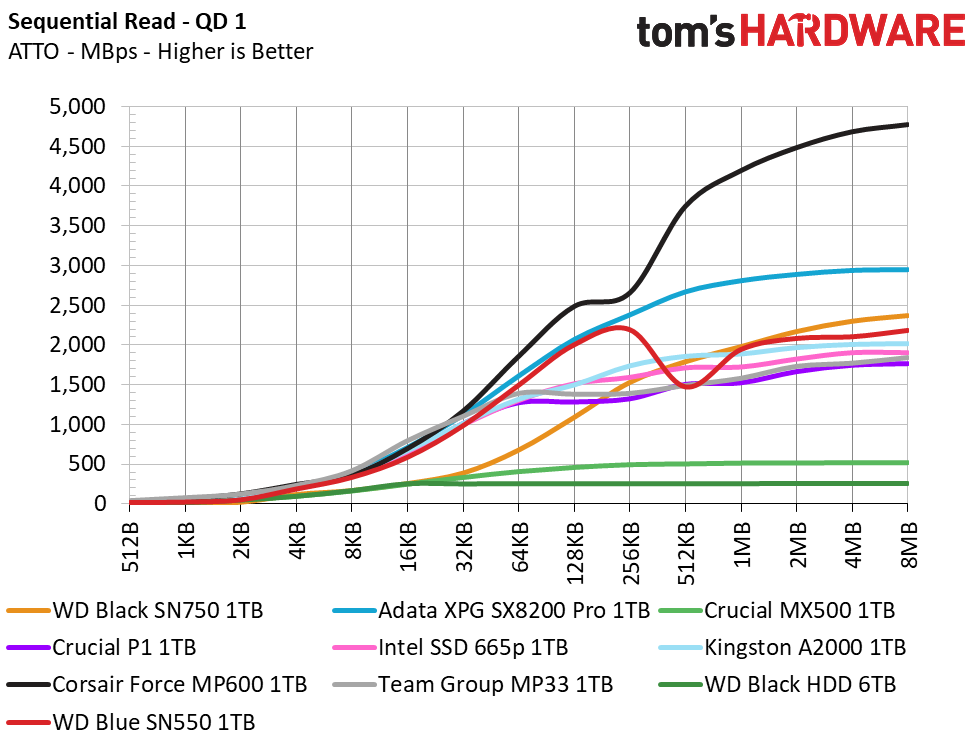
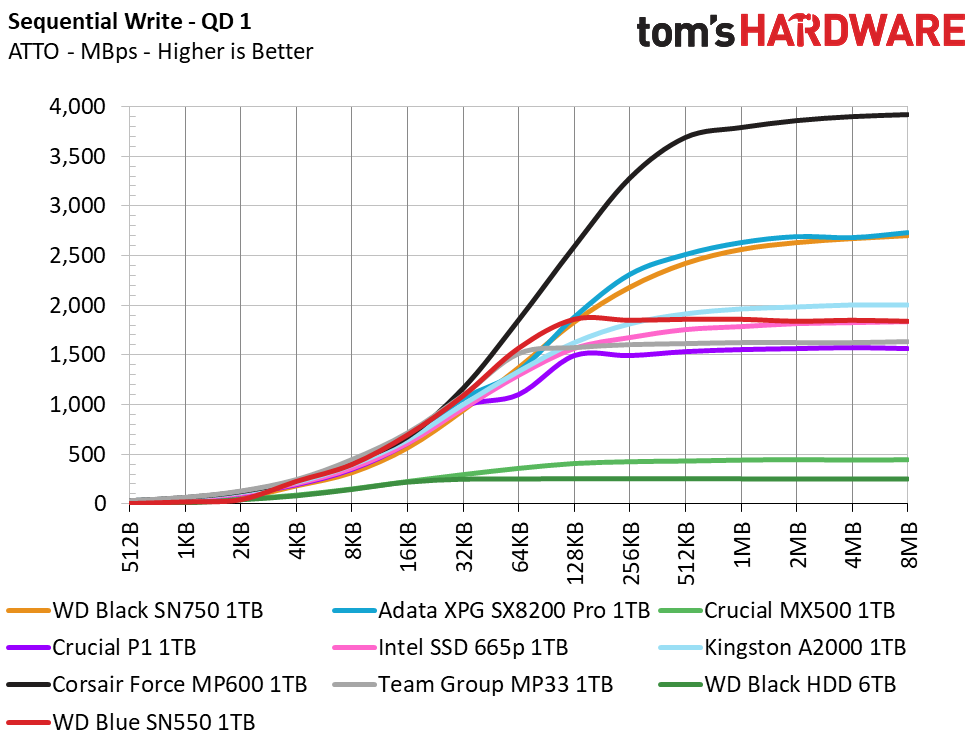
In ATTO, we tested WD’s Blue SN550 at a QD of 1, representing most day to day file access at various block sizes. The WD Blue’s sequential performance peaked at 2.2/1.9 GBps read/write, which is about nine times faster than what the WD Black HDD can do. And at smaller file sizes it shows a distinct advantage over the WD Black SN750, hence the faster application performance in PCMark10’s workloads.
Synthetic Testing - iometer
iometer is an advanced and highly configurable storage benchmarking tool that vendors often use to measure the performance of their devices.
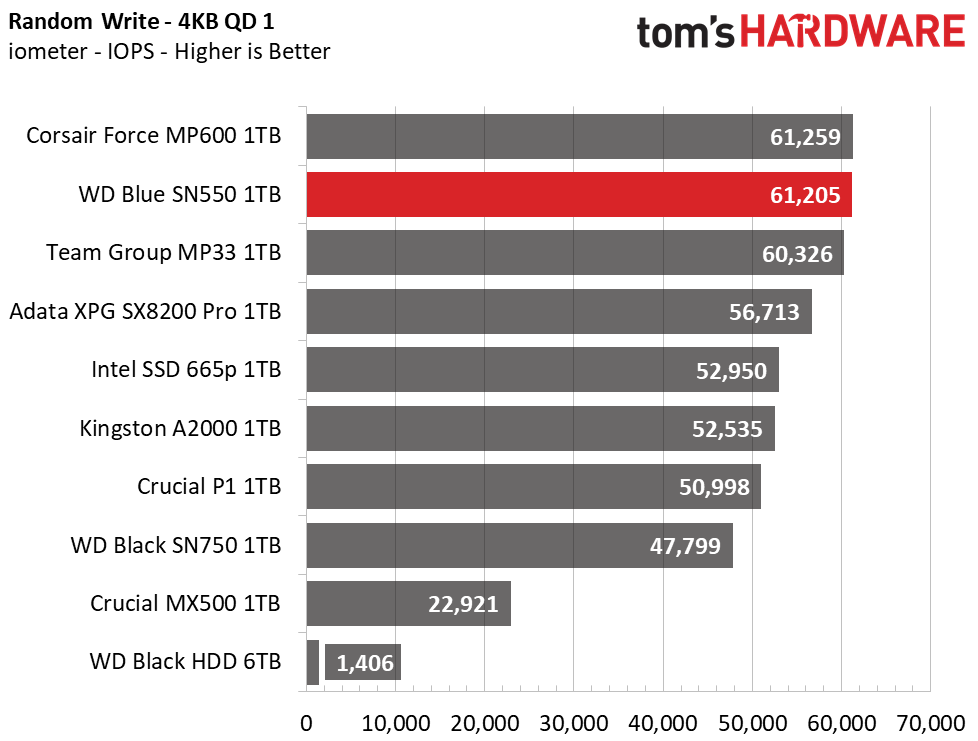
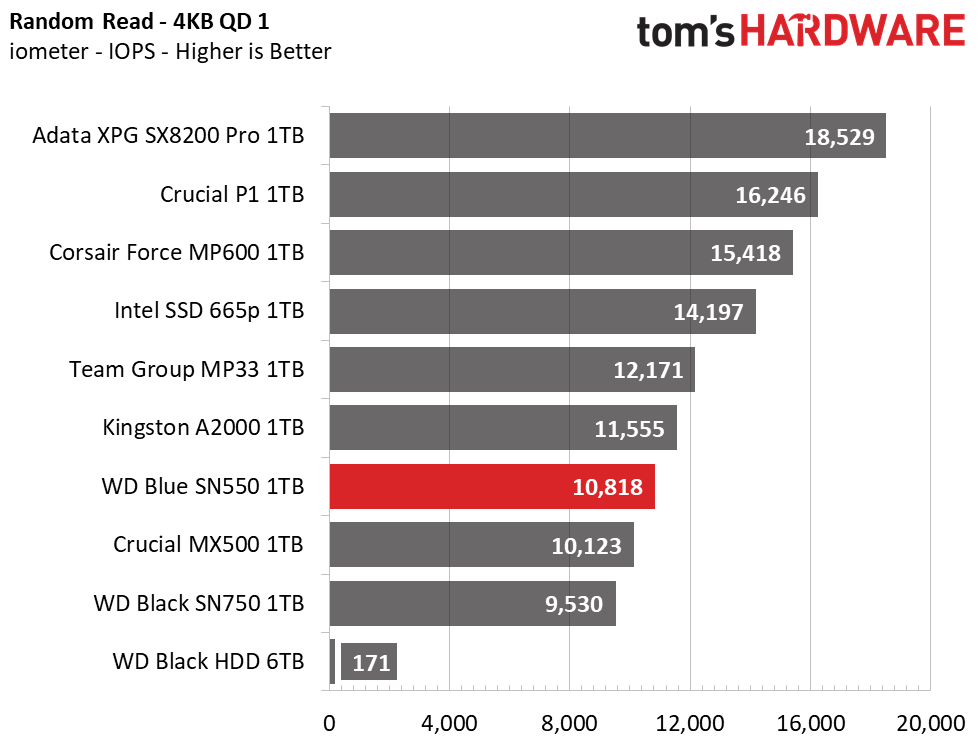
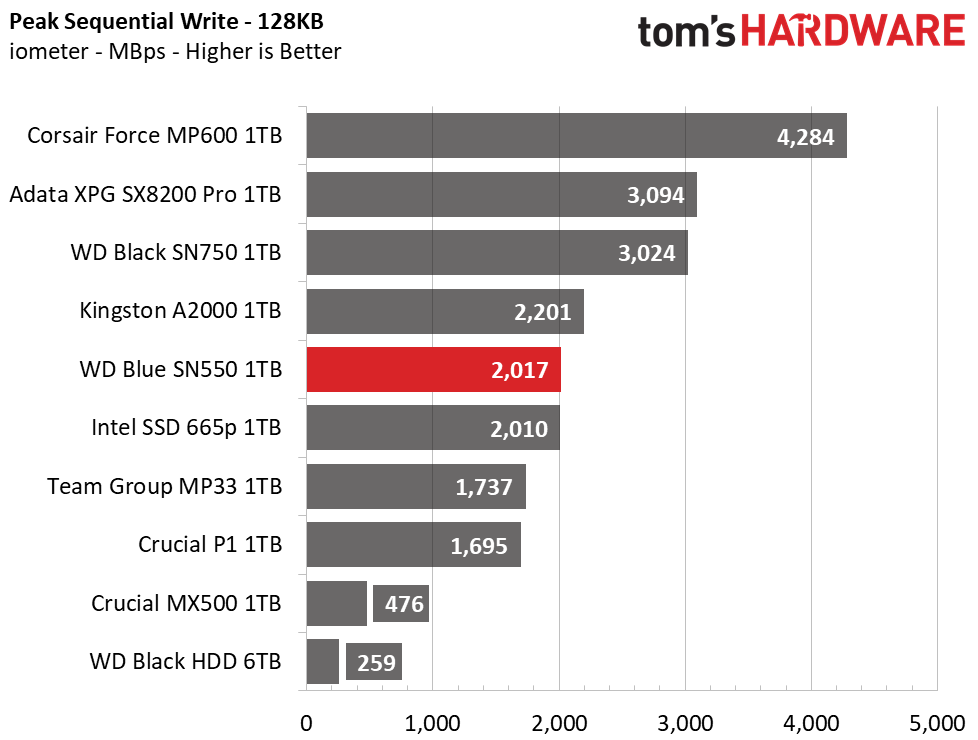
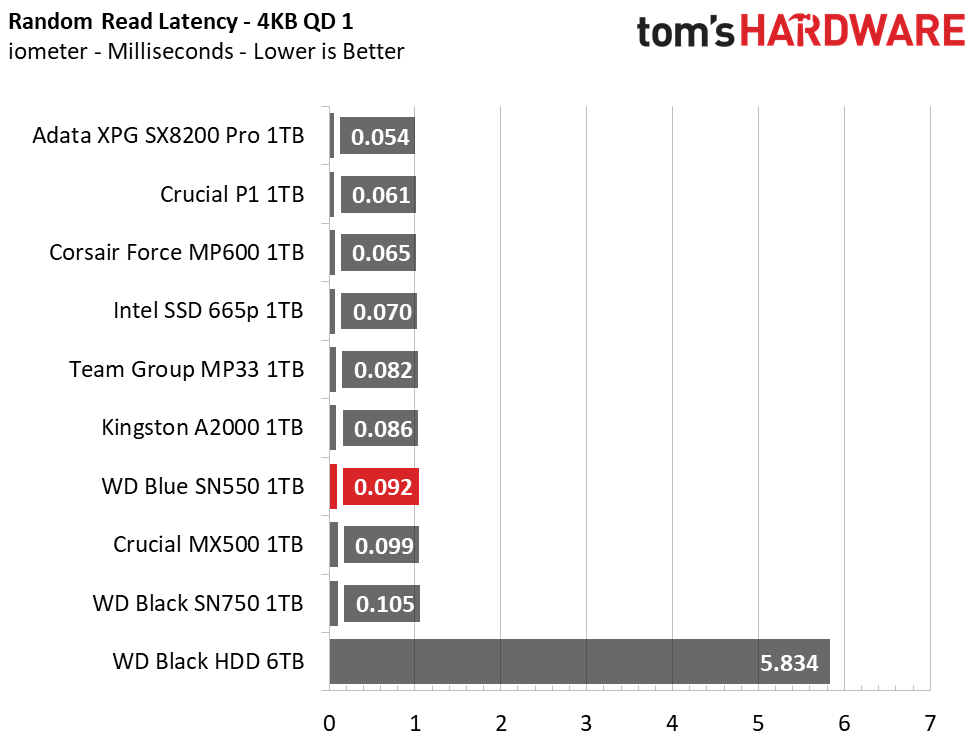
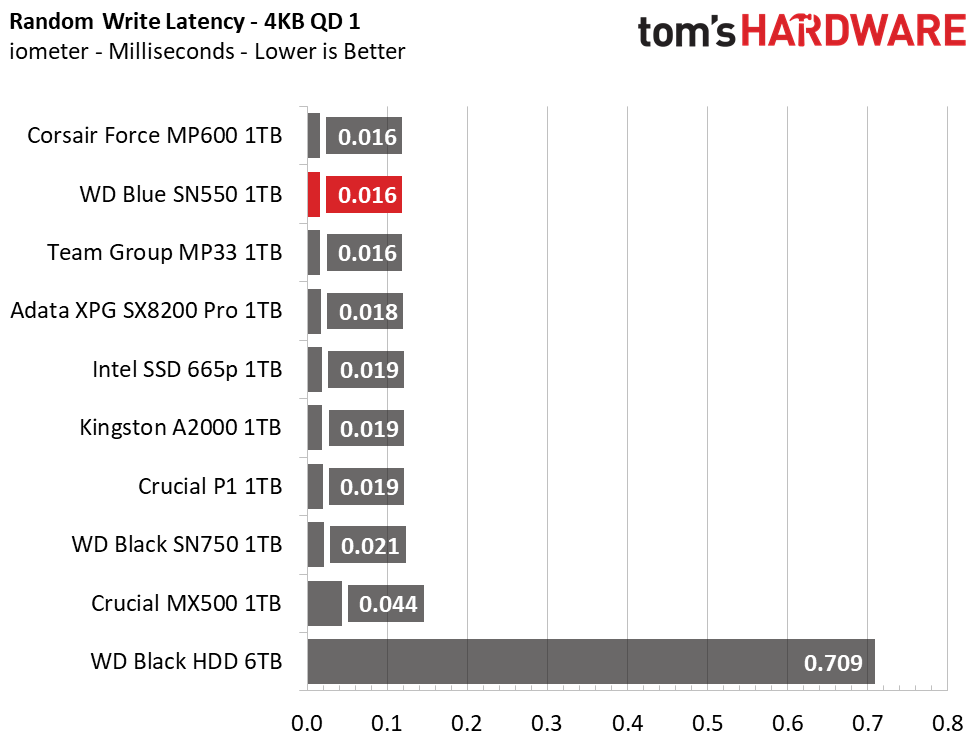
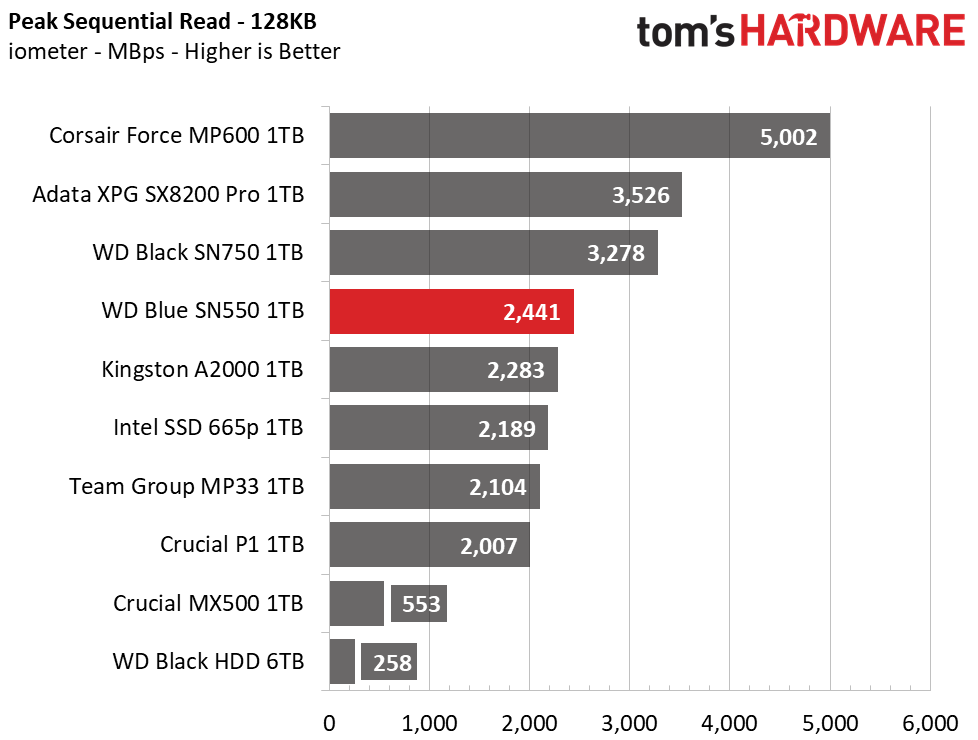
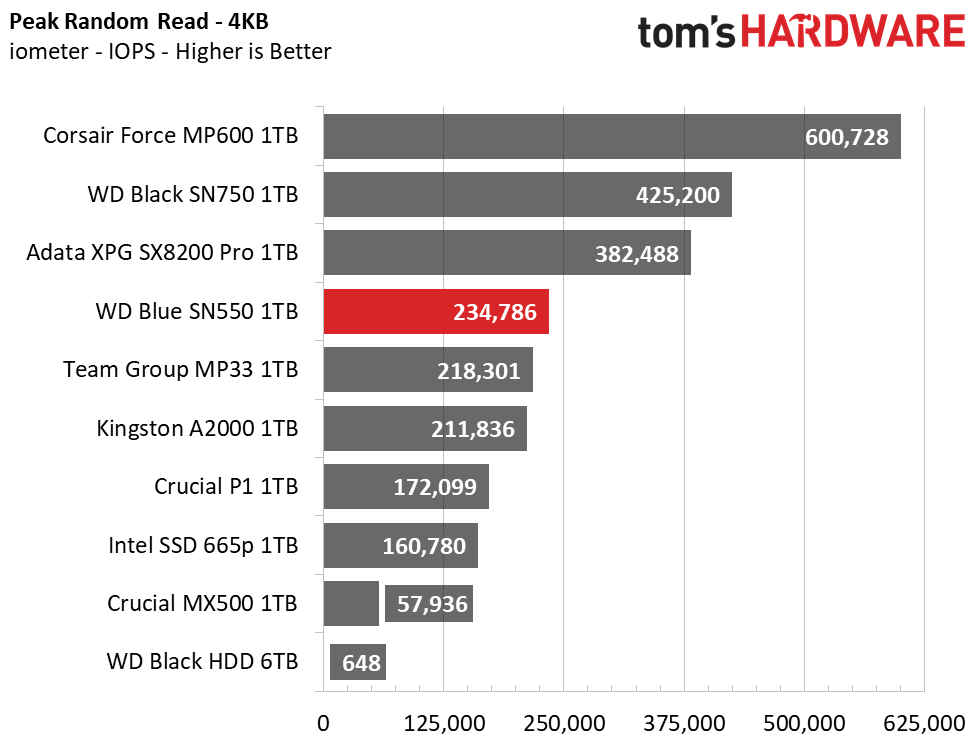
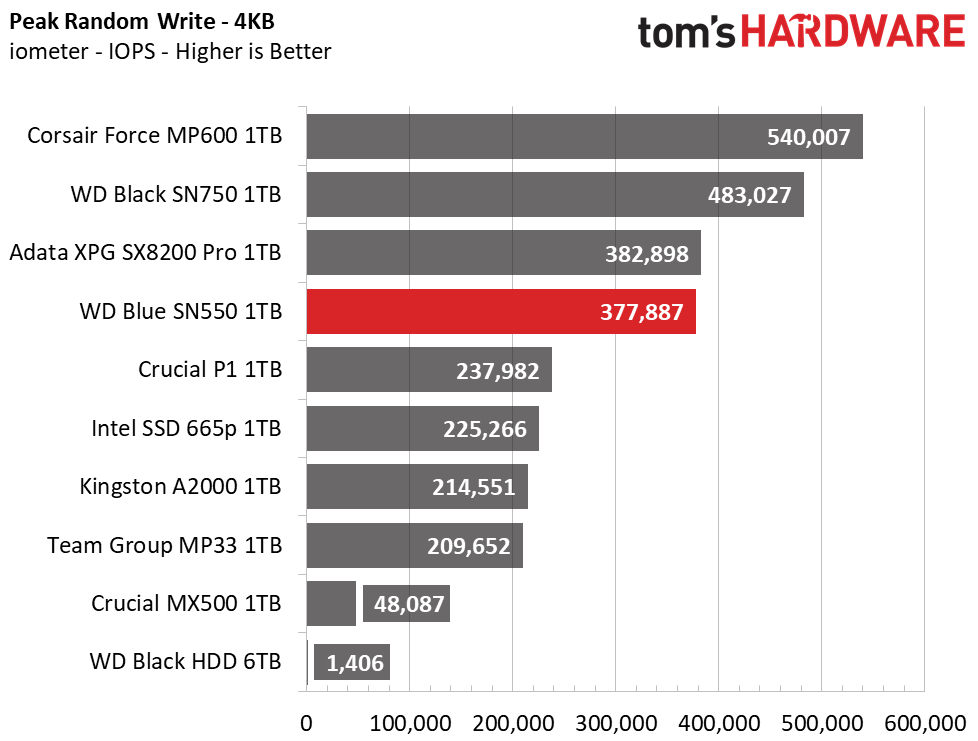
Peak sequential performance hits 2.4/2.0 GBps read/write, scoring the WD Blue SN550 fourth and fifth place, respectfully. WD’s Blue SN550 is more responsive to random requests than the WD Black SN750. Random 4K latency is also pretty low, especially on the writes.
Peak random performance isn’t as good, however. Since the controller is tuned for efficiency, its somewhat limited bandwidth allows the Blue to still hit upwards of 235,000/377,000 IOPS read/write, which is astronomically more capable than an HDD.
Sustained Write Performance, Cache Recovery, and Temperature
Official write specifications are only part of the performance picture. Most SSD makers implement a write cache, which is a fast area of (usually) pseudo-SLC programmed flash that absorbs incoming data. Sustained write speeds can suffer tremendously once the workload spills outside of the cache and into the "native" TLC or QLC flash. We use iometer to hammer the SSD with sequential writes for 15 minutes to measure both the size of the write cache and performance after the cache is saturated. We also monitor cache recovery via multiple idle rounds.
When possible, we also log the temperature of the drive via the S.M.A.R.T. data to see when (or if) thermal throttling kicks in and how it impacts performance. Bear in mind that results will vary based on the workload and ambient air temperature.
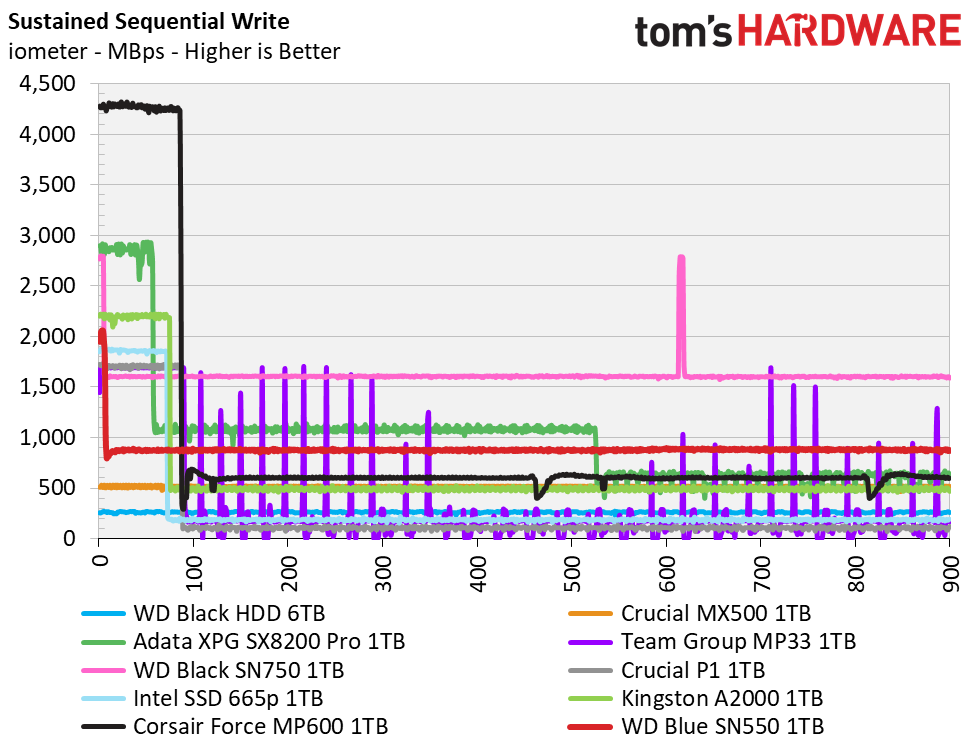
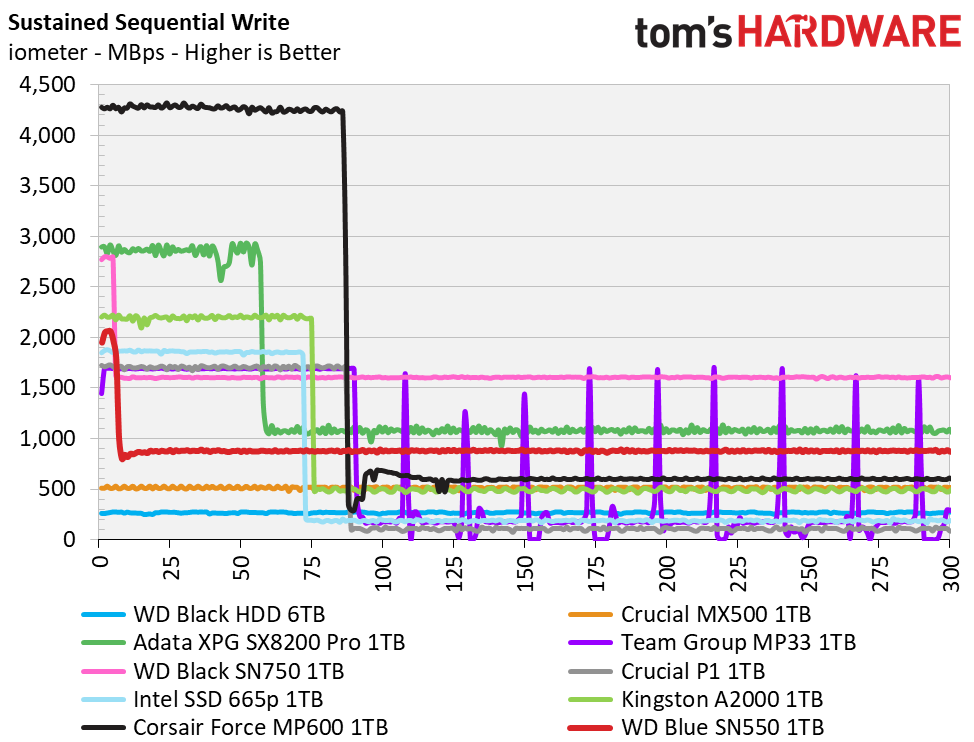
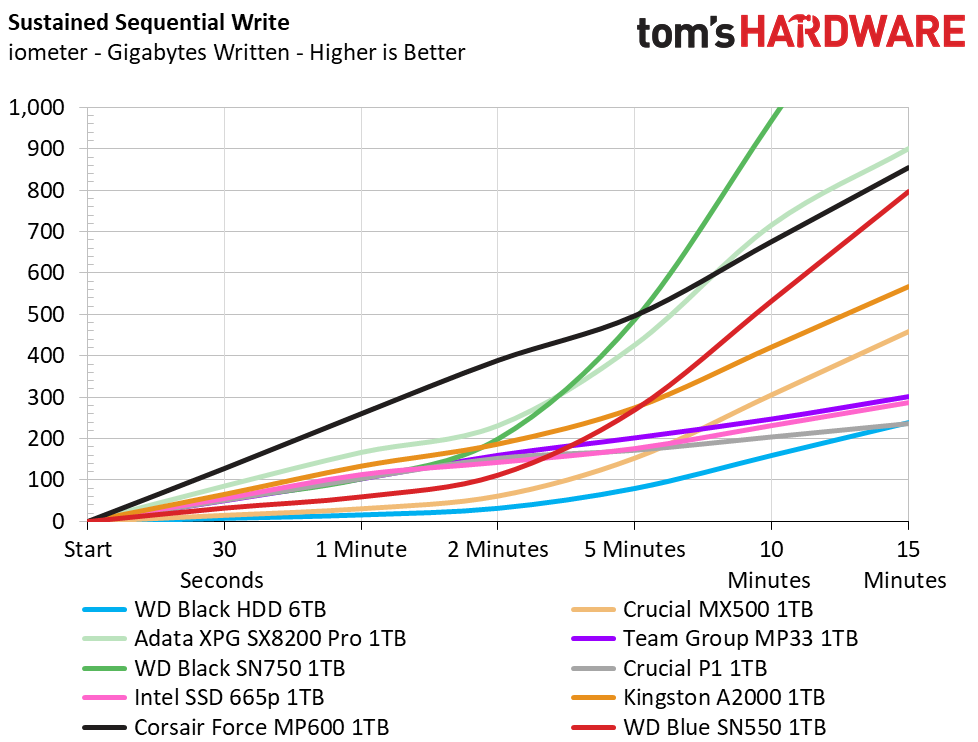
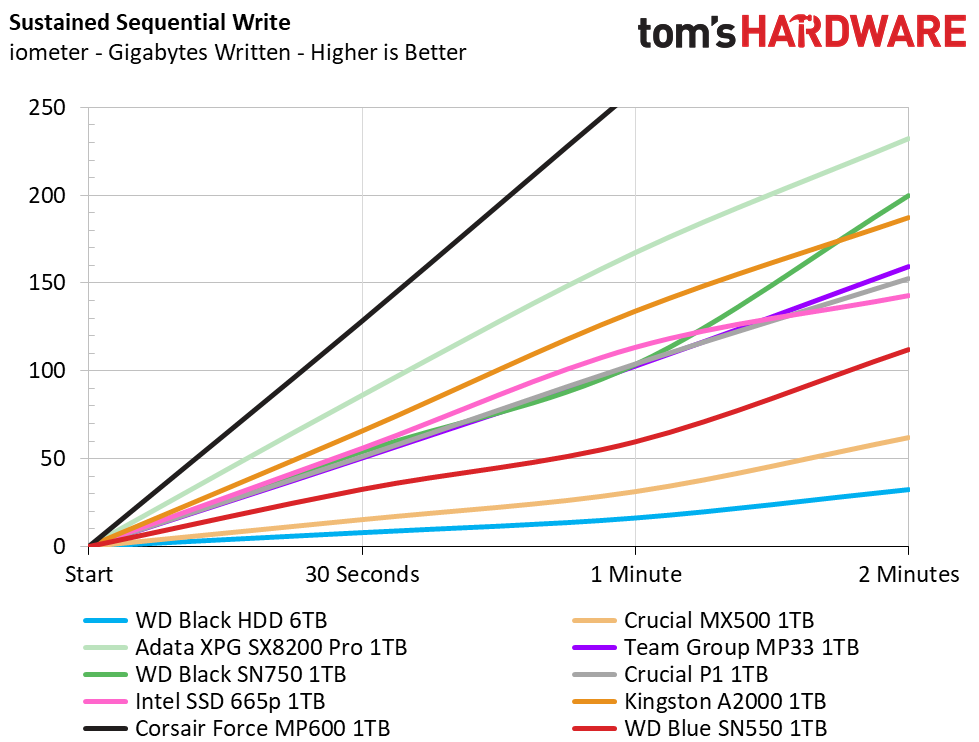
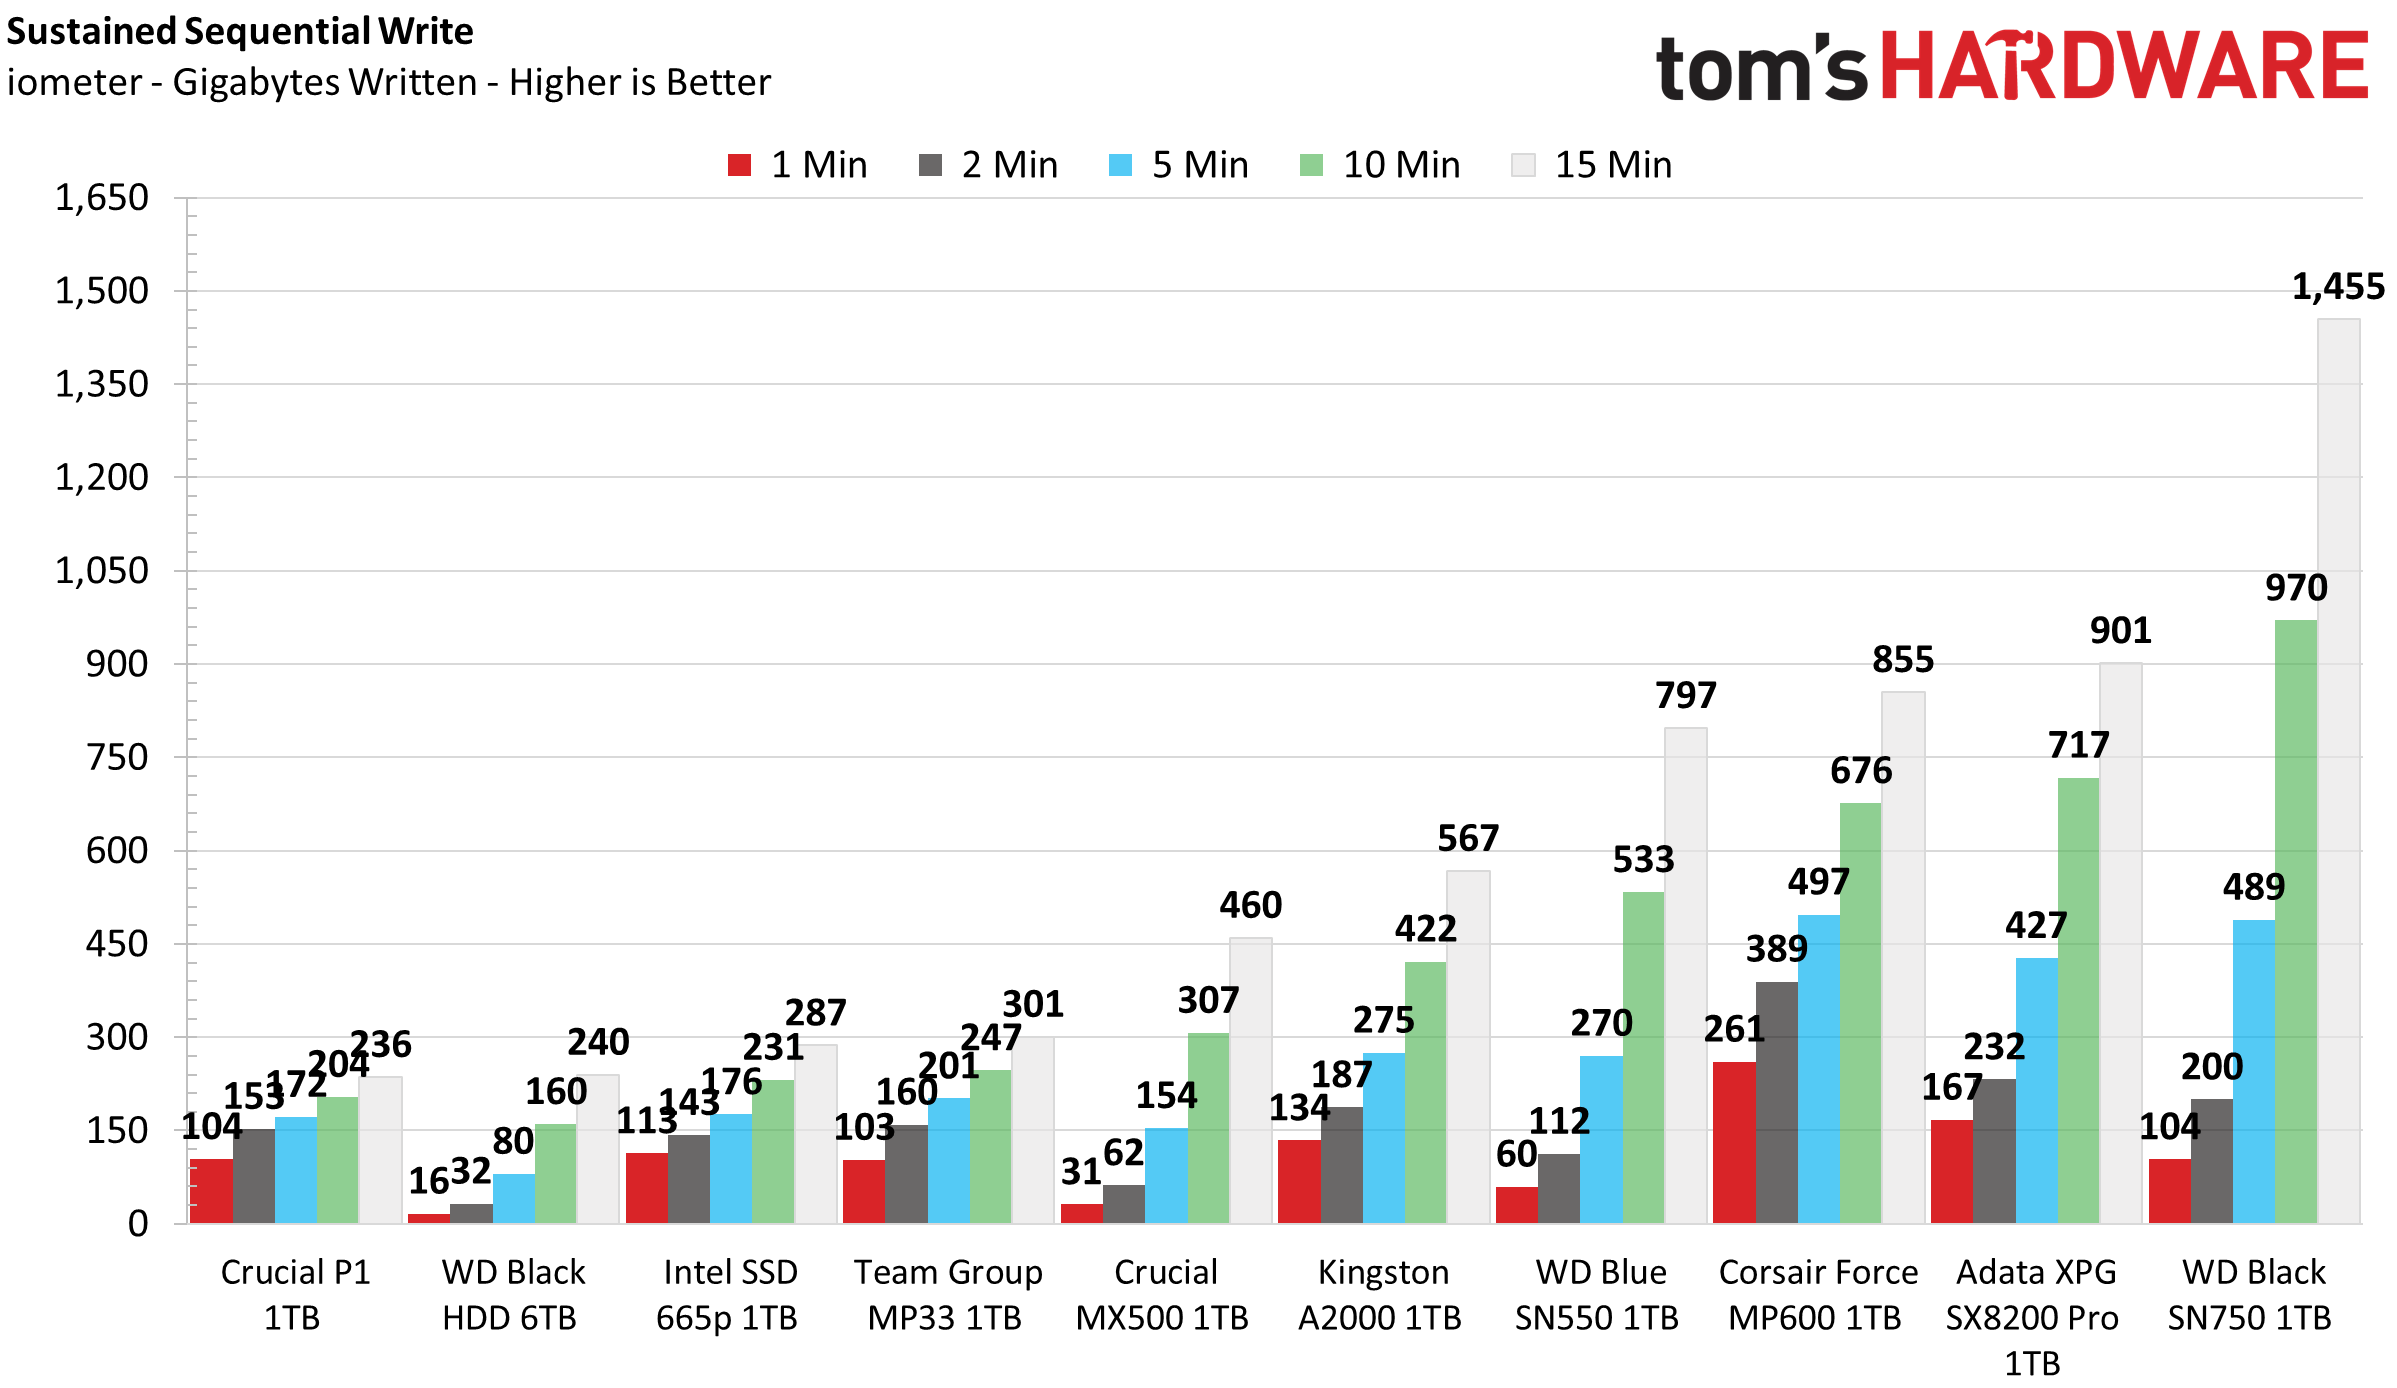
The WD Blue SN550’s write performance is extremely consistent compared to many SSDs, thanks to its static SLC cache, rather than the dynamic cache of most higher-priced drives these days. Even when the write cache is exhausted and without DRAM to aid FTL management, the WD manages to deliver faster performance than even higher-end SSDs. It wrote 12GB of data at a rate of 2 GBps and then degraded to an average write speed of 880 MBps for the remainder of the test. Its write cache recovers quickly too. Within 30 seconds of idle time, it is ready for more writes.
When it comes to heat, the WD Blue SN550 does a pretty good job at keeping cool with static air (no airflow) within our 25 degrees Celsius testing environment. WD specifies that the SSD will throttle performance if it surpasses the rated operating temperature of 70 degrees Celsius.
When moving a few hundred gigabytes of data around, to and from the drive, peak temps reported in at just over 70 degrees Celsius. However, manually measuring with our infrared thermometer, we saw both the NAND package and controller barely hit 61 degrees Celsius and the drive didn’t exhibit any thermal throttling at the time.
Power Consumption
We use the Quarch HD Programmable Power Module to gain a deeper understanding of power characteristics. Idle power consumption is a very important aspect to consider, especially if you're looking for a new drive for your laptop. Some SSDs can consume watts of power at idle while better-suited ones sip just milliwatts. Average workload power consumption and max consumption are two other aspects of power consumption, but performance-per-watt is more important. A drive might consume more power during any given workload, but accomplishing a task faster allows the drive to drop into an idle state faster, which ultimately saves power.
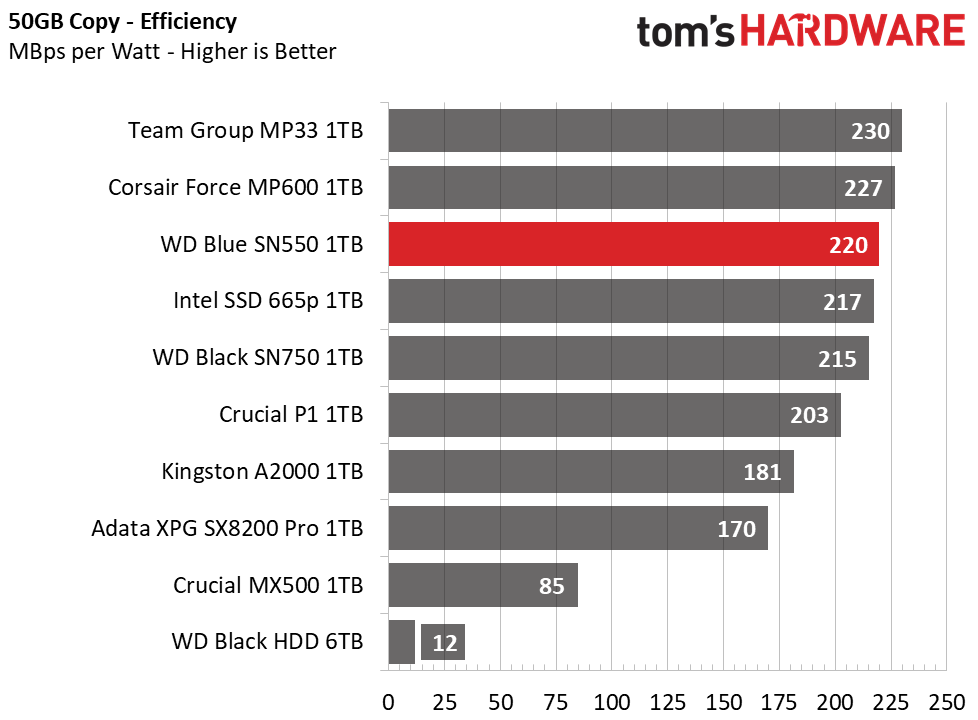
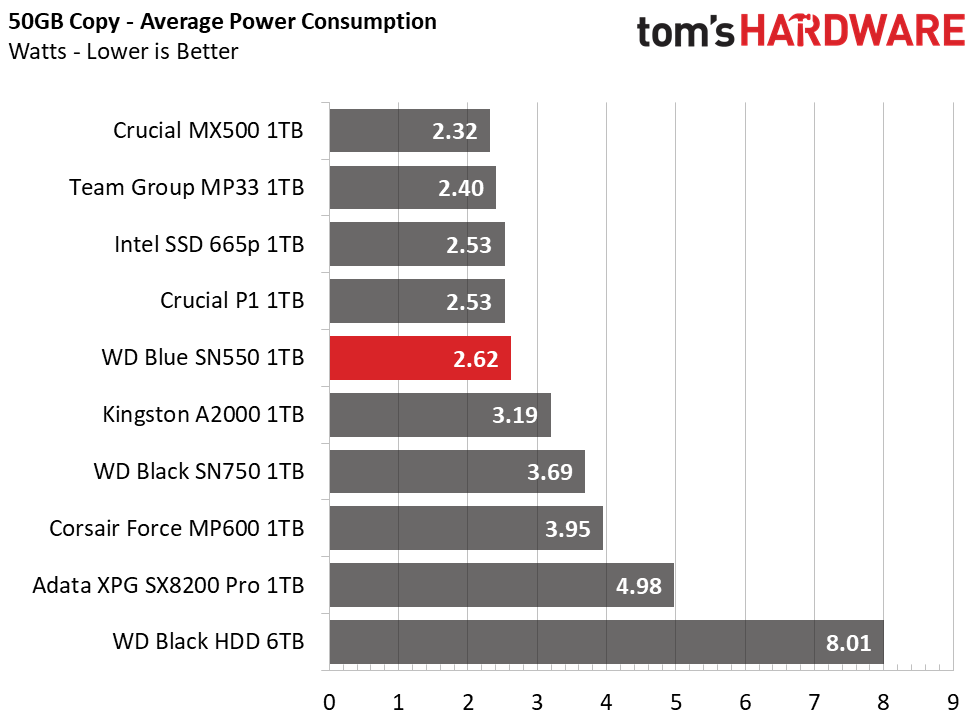
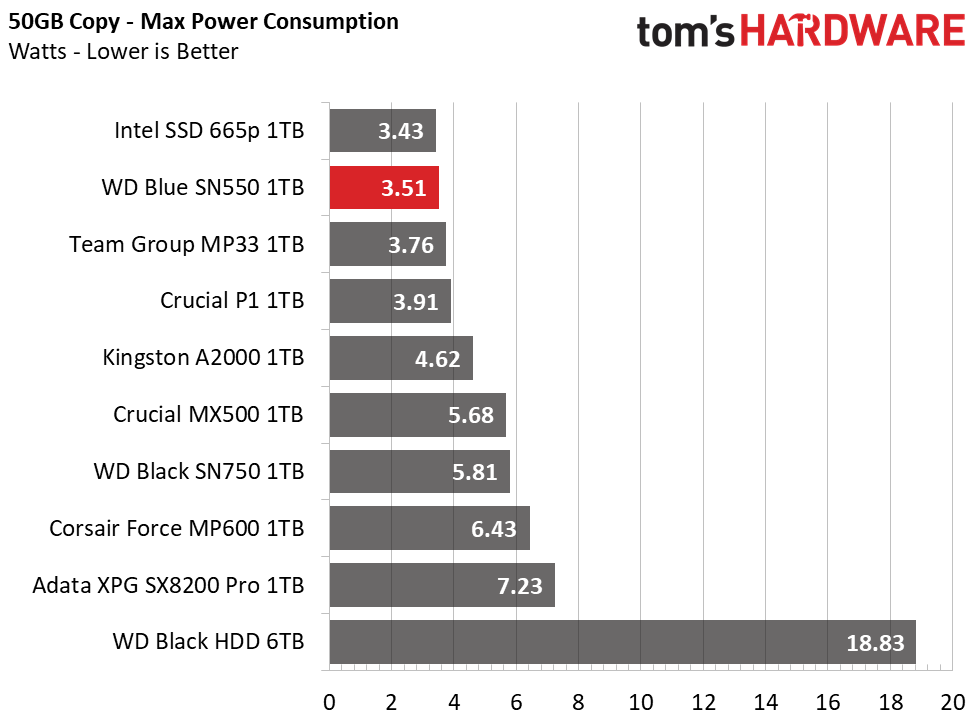
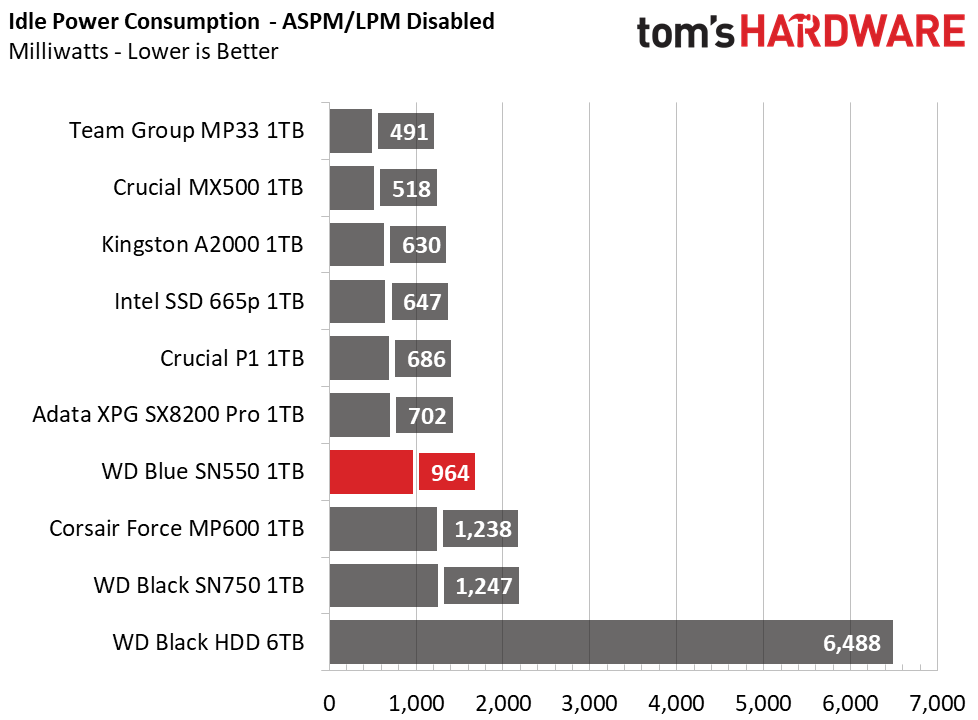
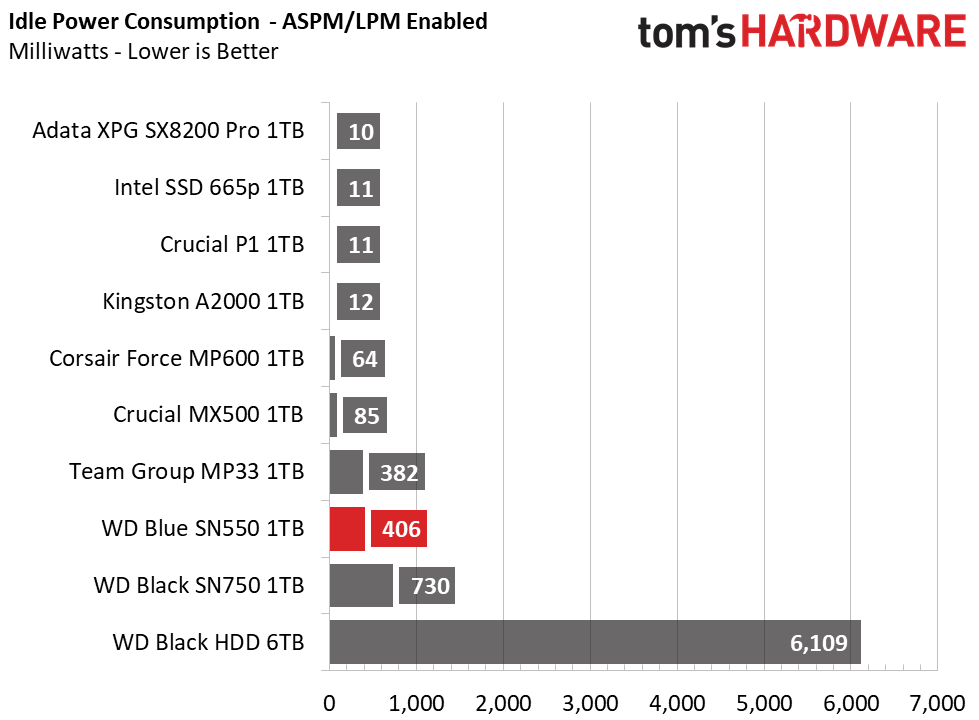
WD’s Blue SN550 scores high in our efficiency test. With a score of 220 MBps per watt used, it scores third place overall. Its average consumption is low and its maximum power consumption figures are well regulated too. The company rates the drive to hit an ultra-low power state where it consumes just 5mW, so it should be a good fit for mobile use.
However, idle power consumption on our desktop system leaves some room for improvement. Almost every other SSD we've tested recently switches into lower idle power states on our test platforms, while the WD consumes a bit more power than average.
MORE: Best SSDs
MORE: How We Test HDDs And SSDs
MORE: All SSD Content

Sean is a Contributing Editor at Tom’s Hardware US, covering storage hardware.
-
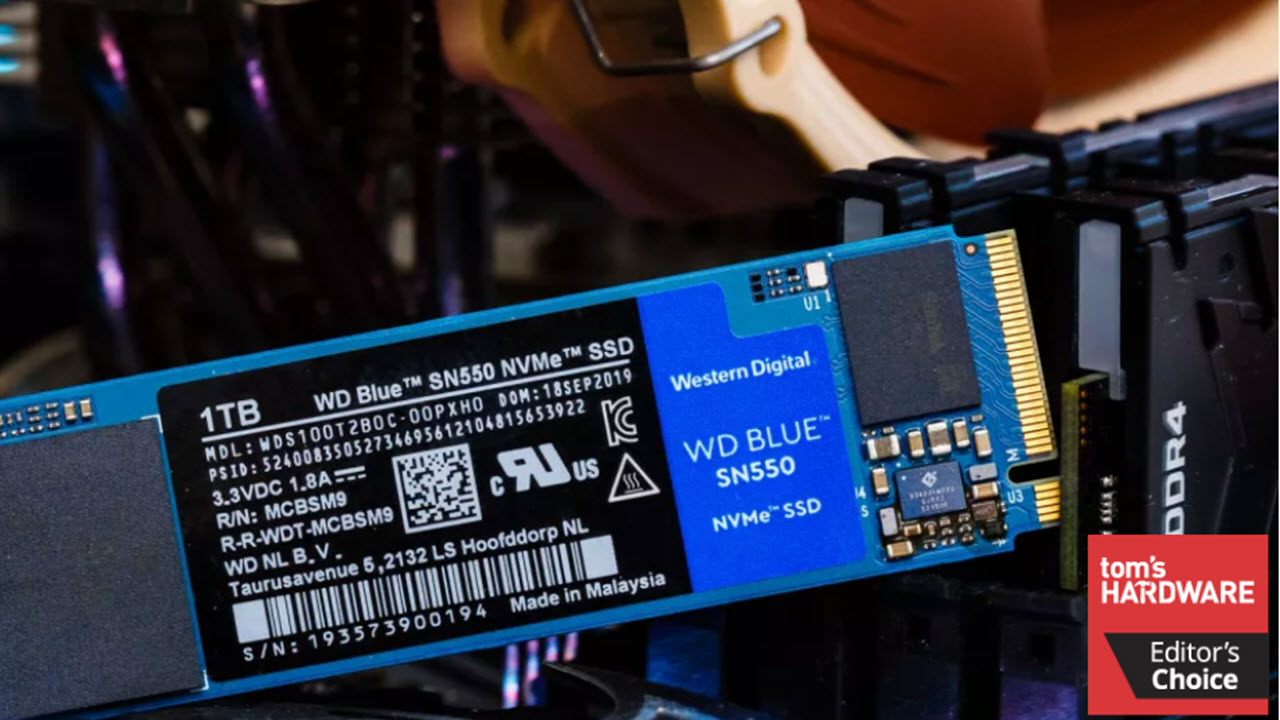
techgeek Looks like they need a little quality control over at WD. Look at all the flux left on the bottom right-hand corner (from the perspective of the picture) around all the SMD caps and diode near what I believe is the controller. Amazing that made it out of the factory like that.Reply -
Rdslw Reply
that's the point of "rock bottom cheapest ssd's anything that works is good ....techgeek said:Looks like they need a little quality control over at WD. Look at all the flux left on the bottom right-hand corner (from the perspective of the picture) around all the SMD caps and diode near what I believe is the controller. Amazing that made it out of the factory like that.
as most of cheap laptops are sold with sata ones, this is nice upgrade on the budget.
If it works that is, If such pieces end up on reviews I am afraid of what will arrive to normal consumers ... -
techgeek ReplyRdslw said:that's the point of "rock bottom cheapest ssd's anything that works is good ....
as most of cheap laptops are sold with sata ones, this is nice upgrade on the budget.
If it works that is, If such pieces end up on reviews I am afraid of what will arrive to normal consumers ...
Almost looked like there was solder rework done by a rookie. I would have gotten more than my wrist slapped if I'd left something like that in one of our downhole tools. Flux can cause electrical leakage at higher temperatures. -
bit_user Replywith a multi-gear ECC scheme
Huh? That's the first I've ever heard of such a thing. I think that warrants an explanation.
Also, what's going on with the "Sustained Write" graphs (slide 3+, in the second group from the bottom of page 2)? I don't understand why the write speed would apparently increase, over time. I expected the graphs to bend flatter, as the drives' SLC buffers filled up. Could this be an error in the measurement methodology? -
mchldpy Reply
===========================================techgeek said:Looks like they need a little quality control over at WD. Look at all the flux left on the bottom right-hand corner (from the perspective of the picture) around all the SMD caps and diode near what I believe is the controller. Amazing that made it out of the factory like that.
Can someone point out top a near-blind person which of the (7) pics it is.
Thanks -
seanwebster Replybit_user said:Huh? That's the first I've ever heard of such a thing. I think that warrants an explanation.
It's the same approach as since the WD Black NVMe (SN720 from 2018). Basically, WD's firmware optimizes the usage of multiple LDPC ECC algorithms. LDPC can take a long time to calculate when read errors are high later in the SSD's lifespan. When less ECC is needed (usually when newer/less worn), data will be retrieved using the first gear - an LDPC that aims for low power and high throughput. If the NAND is worn, then it may switch into second or third gear which increases the ECC and thus consume more power. These SSDs will utilize gear 1 most of their life.
I have it exponentially scale, somewhat. Double-check the time scale/x-axis. It's the same data. I chart it this way to view how much data can be written over time from another perspective. Kind of like pattern recognition for myself, too.bit_user said:Also, what's going on with the "Sustained Write" graphs (slide 3+, in the second group from the bottom of page 2)? I don't understand why the write speed would apparently increase, over time. I expected the graphs to bend flatter, as the drives' SLC buffers filled up. Could this be an error in the measurement methodology? -
bit_user Reply
I hadn't noticed. I feel like it'd give a more intuitive sense of what happens to transfer speeds over time, if it were linear in both X & Y. Just my opinion.seanwebster said:I have it exponentially scale, somewhat. Double-check the time scale/x-axis. It's the same data.
Thanks for the reply. A lot of authors on here don't seem to read the comments - not even the first few.
Also, nice review. I was worried it might not have the synthetic benchmarks, but I was glad when I finally got to them. Personally, I care mostly about synthetics. I like when random read IOPS are tested at queue depths 1, 2, and 4, FWIW. But QD1 is what matters most. -
Dreamslacker Replytechgeek said:Looks like they need a little quality control over at WD. Look at all the flux left on the bottom right-hand corner (from the perspective of the picture) around all the SMD caps and diode near what I believe is the controller. Amazing that made it out of the factory like that.
Actually, that is probably underfill for the controller which is a small CSP chip. Considering the position (close to the connector) and the size/ type of the chip, the underfill is probably laid to protect against stress (thermally induced and mechanically from insertion). -
seanwebster Reply
I'll look into it. I have it compressed this way because it creates a tail whip pattern to allow me to quickly differentiate good vs bad write performance over sustained writes.bit_user said:I hadn't noticed. I feel like it'd give a more intuitive sense of what happens to transfer speeds over time, if it were linear in both X & Y. Just my opinion.
Thanks for the reply. A lot of authors on here don't seem to read the comments - not even the first few.
Also, nice review. I was worried it might not have the synthetic benchmarks, but I was glad when I finally got to them. Personally, I care mostly about synthetics. I like when random read IOPS are tested at queue depths 1, 2, and 4, FWIW. But QD1 is what matters most.
I have QD 1-128 on 4K random and 128 seq results data for manufacturer comparison. Optimally, for synthetic testing, I'd do a filesize and QD sweep like I do with enterprise stuff, but for consumers, that would be a lot of data for little value. I used to plot QD1-4 and the average before, but I just don't think it is worth plotting beyond QD1 on random because one file size doesn't always relate to what real-world performance will be like. And, performance isn't hugely different between drives in QD2-4 that it matters to show. That, and I think because the application test results speak for themselves more than anything. At the end of the day, responsiveness to real-world like use is most important.
Let me know if you would like to see any other tests/data. I'm always looking for something new and worthwhile to add. :)
