Western Digital Red 10TB And 8TB NAS HDD Review
Why you can trust Tom's Hardware
Desktop Performance
Comparison Products
We divided our performance testing into two sections. On this page, we use a single drive in a desktop system to measure baseline performance. NAS-focused disk drives have become very popular in desktop systems as secondary drives. The increased vibration resistance increases the performance consistency in systems with several fans and other cooling components, like liquid pumps. Vibration will slow all hard disk drives, even those we're testing today, but the additional sensors and firmware optimizations help ensure the best performance.
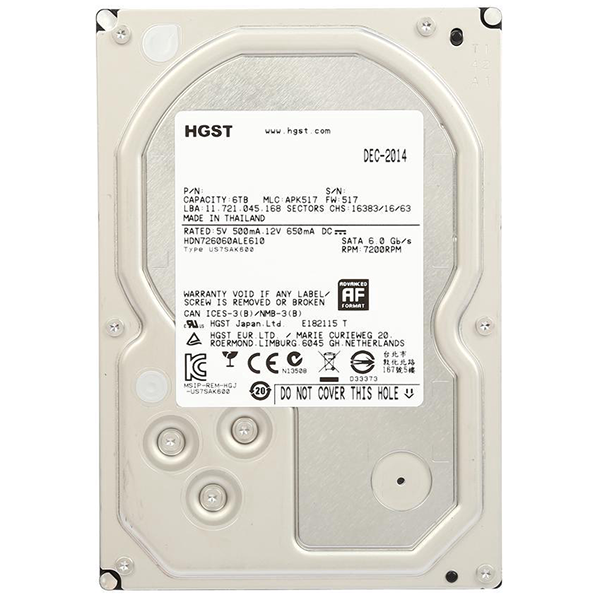
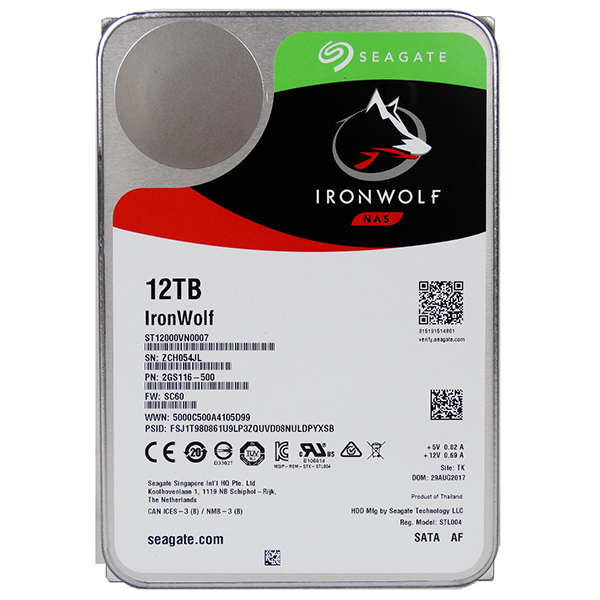
All the drives in our tests are built for NAS environments. We included the two latest Seagate IronWolf products from the Guardian Series and Toshiba's NAS-focused 8TB N300. We also included the Red Pro 6TB and HGST Deskstar NAS 6TB, which are two older 7,200-RPM drives from Western Digital.
Sequential Read Performance
To read about our storage tests in-depth, please check out How We Test HDDs And SSDs. We cover four-corner testing on page six of our How We Test guide.
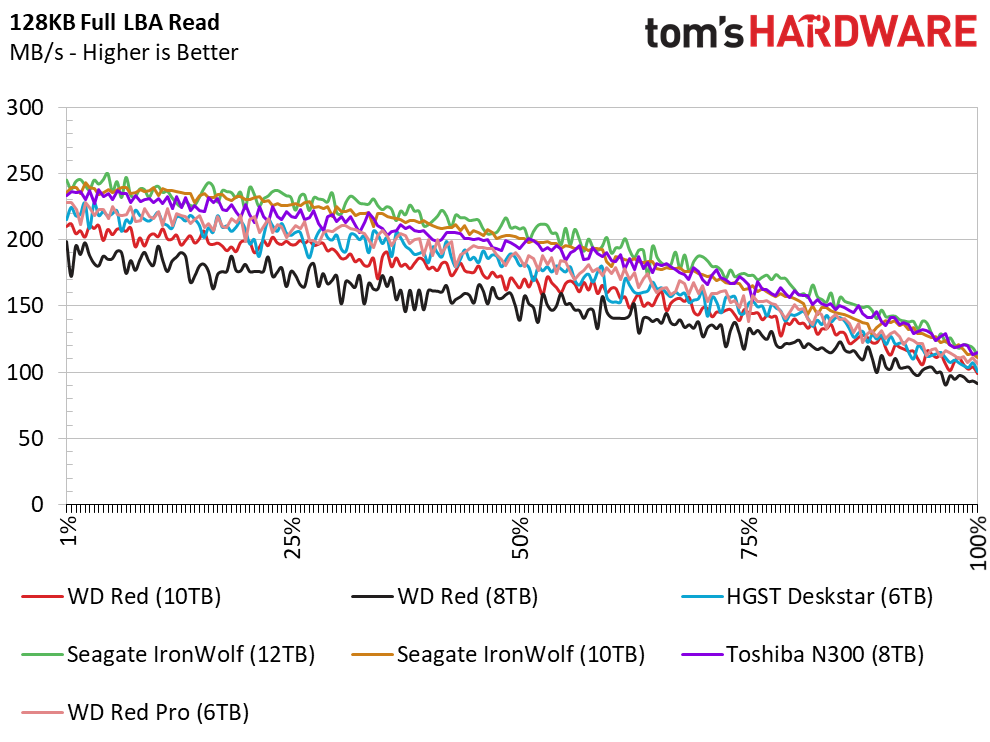
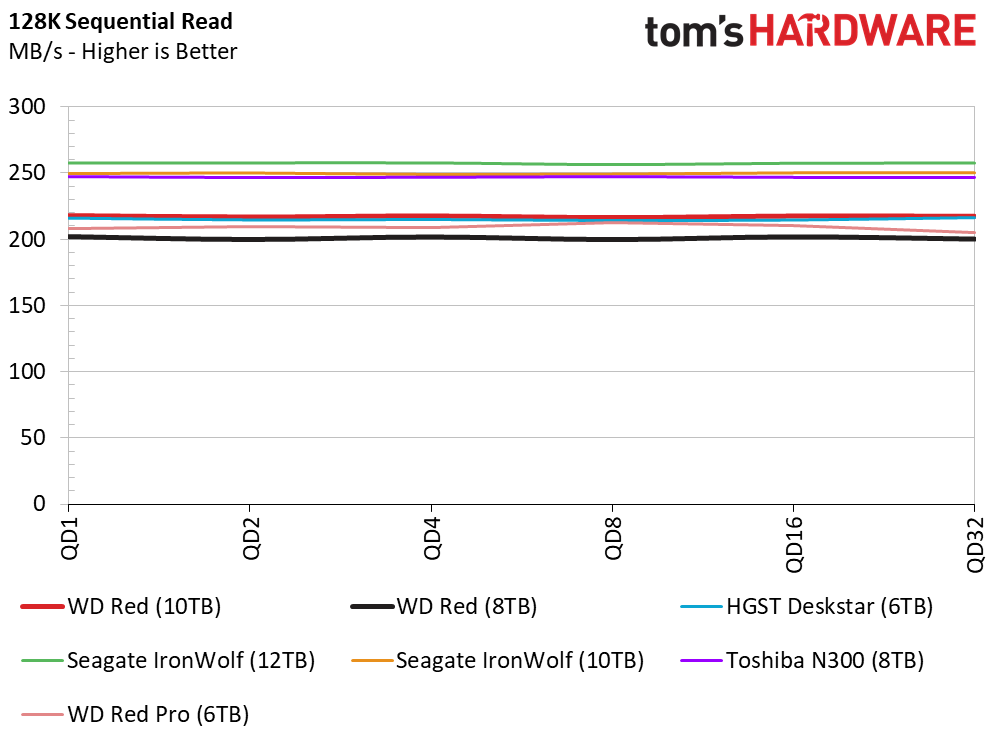
HDDs do not scale with increased sequential workloads because queue depth (QD) 1 to 32 performance is nearly identical. Increasing the queue depth can actually decrease performance slightly because it causes additional arm movement rather than just reading the tracks sequentially (if the data is defragmented and lined up optimally).
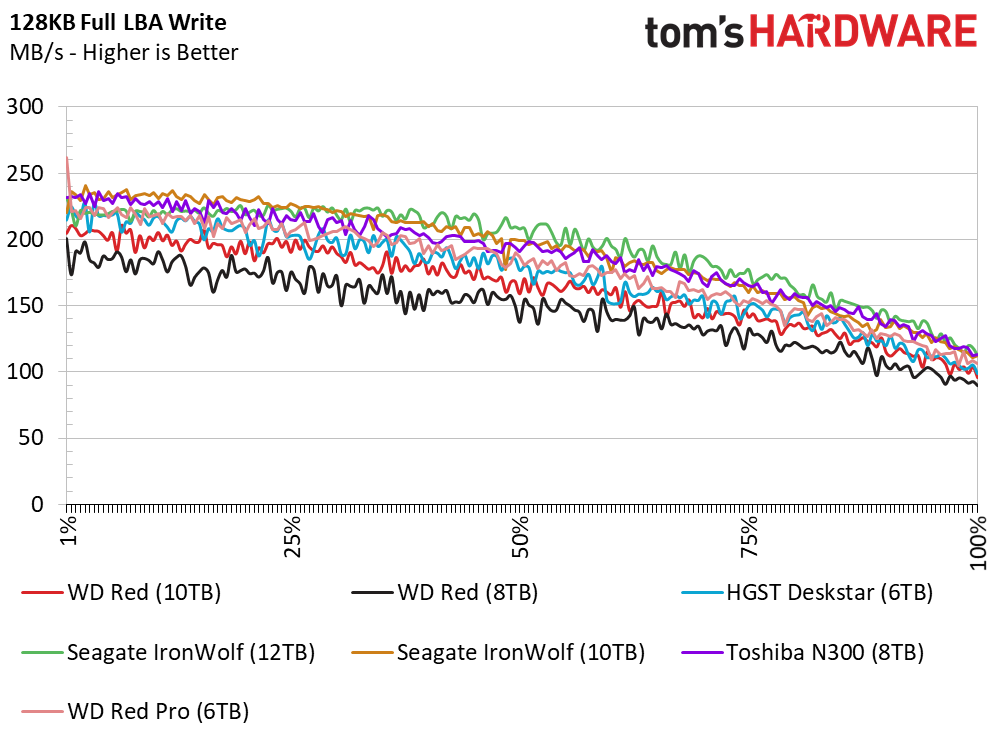
In this section, the first two charts have the most value. The first chart shows the sequential read performance across the entire platter. Drive makers have learned to use the fastest (outer) portion of the platter as a cache to aid the DRAM. Performance is much slower on the inner tracks of the spinning disks. The two Helium-filled Red HDDs are on the lower end of the performance chart, but this is a basic test. You can use this chart as a guide for sequential performance as you fill the drive. The 10TB Red's performance drops from 220 MB/s to ~180 MB/s once the drive is filled halfway with data. The 8TB Red drops from 200 MB/s to roughly 150 MB/s.
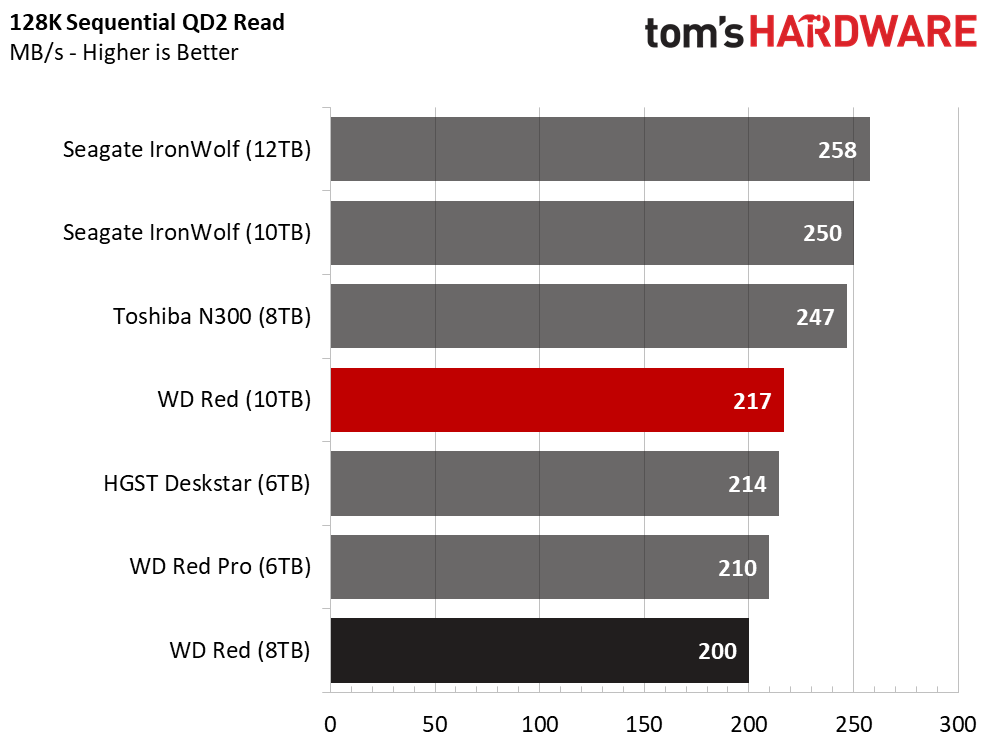
The second chart shows performance on the outer tracks with all of the drives under the same conditions. The third chart breaks the results down into QD2 performance. The 8TB Red is the slowest with 200 MB/s, and the Red 10TB slots in the middle with 217 MB/s.
Sequential Write Performance
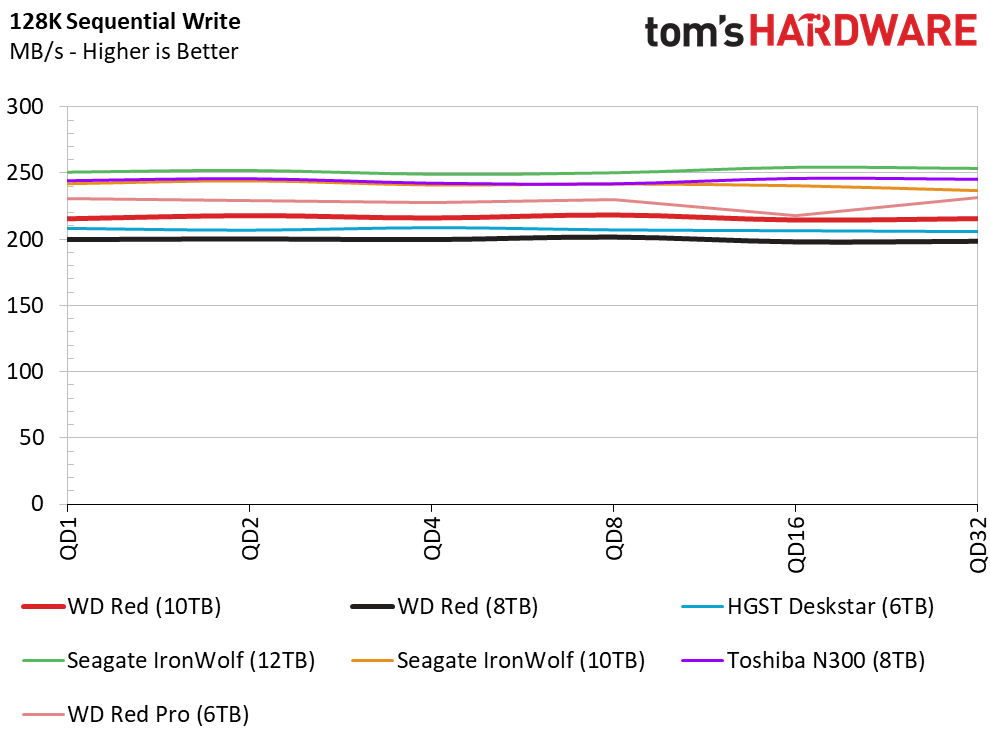
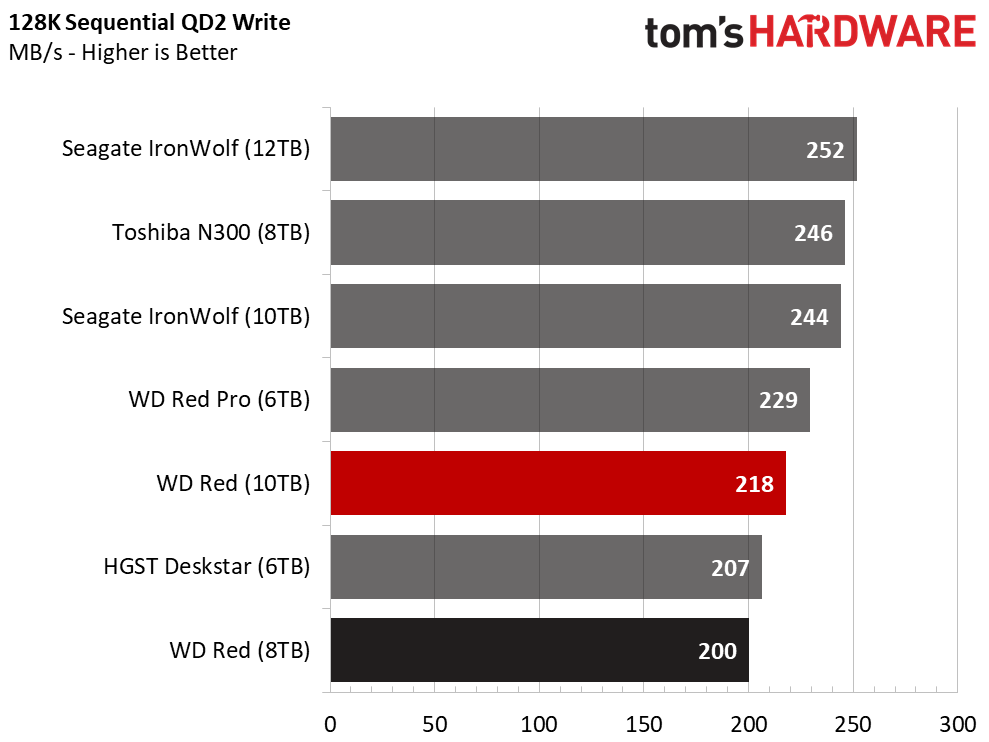
Sequential write throughput is nearly identical to read performance. The drives do not use the DRAM buffers to accelerate sequential write performance, so sequential reads and writes are almost always identical with consumer-focused products. This is the performance you can expect if you are simply transferring large multimedia files between the drives and not mixing reads and writes.
Get Tom's Hardware's best news and in-depth reviews, straight to your inbox.
Random Read Performance
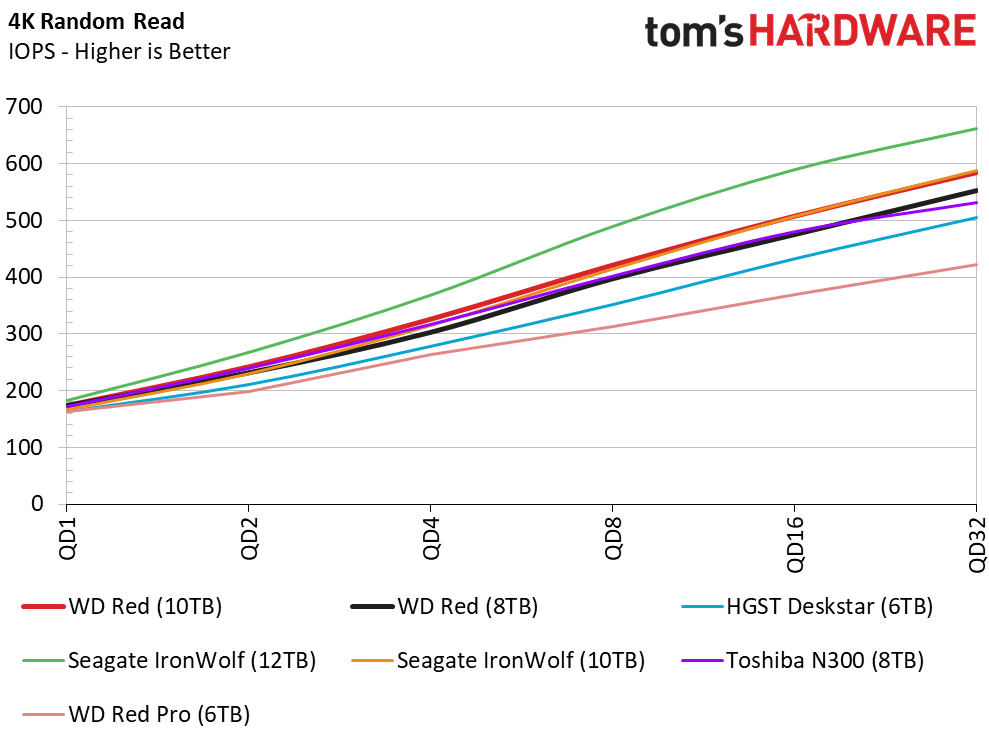
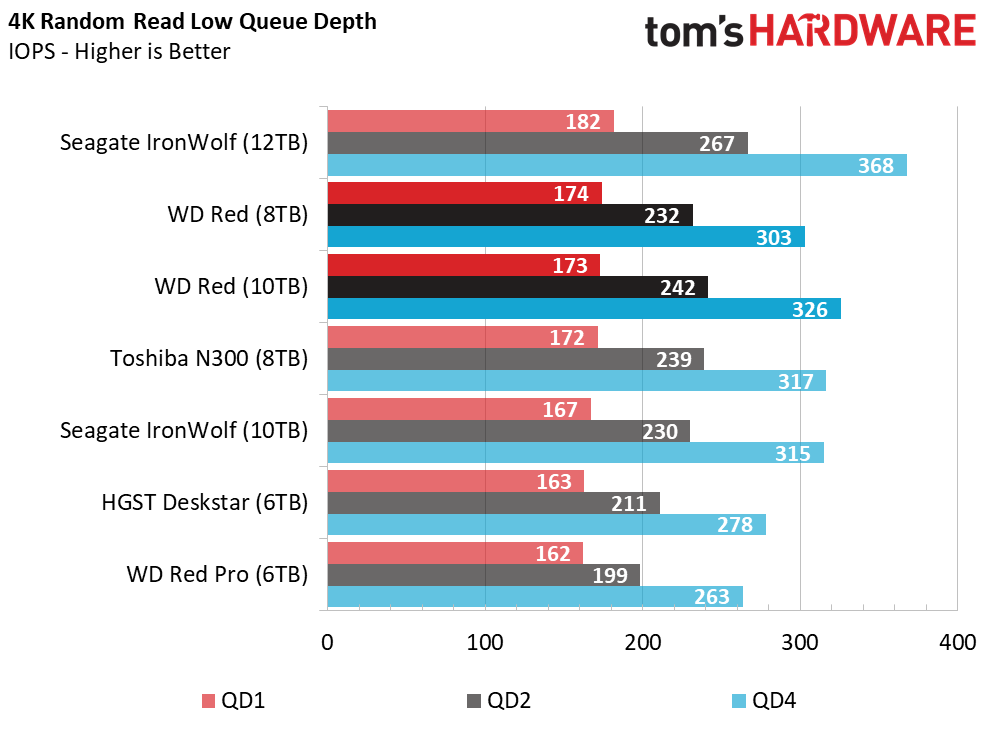
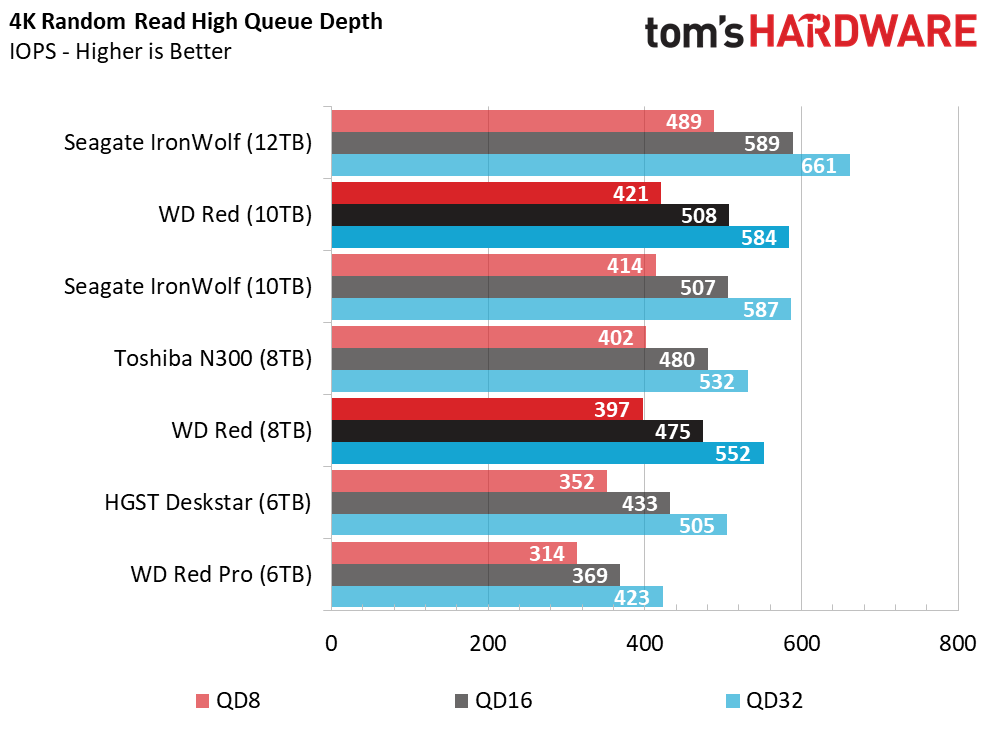
Random performance scales with additional queue depth. It's much easier to reach elevated queue depths with HDDs during real-world workloads because they are slower than SSDs. Still, disk manufacturers have found ways to increase random performance via increased buffer capacity and using the outer edges of the platters. The Helium-filled Red HDDs have strong random read performance. The new 12TB Seagate IronWolf drive is slightly faster, though.
Random Write Performance
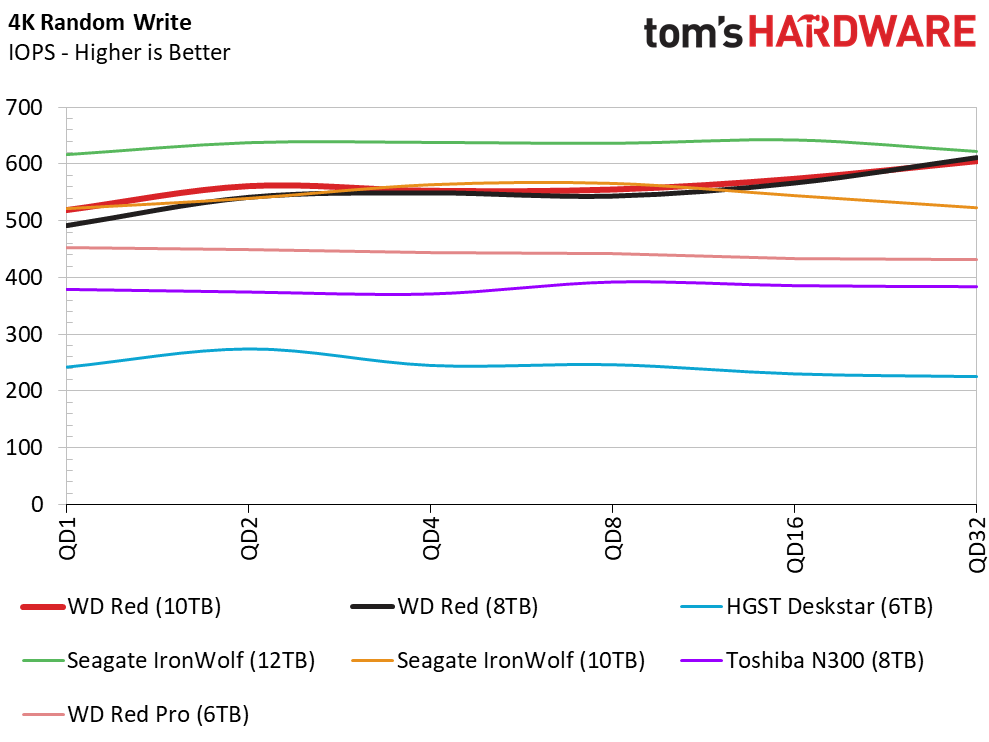
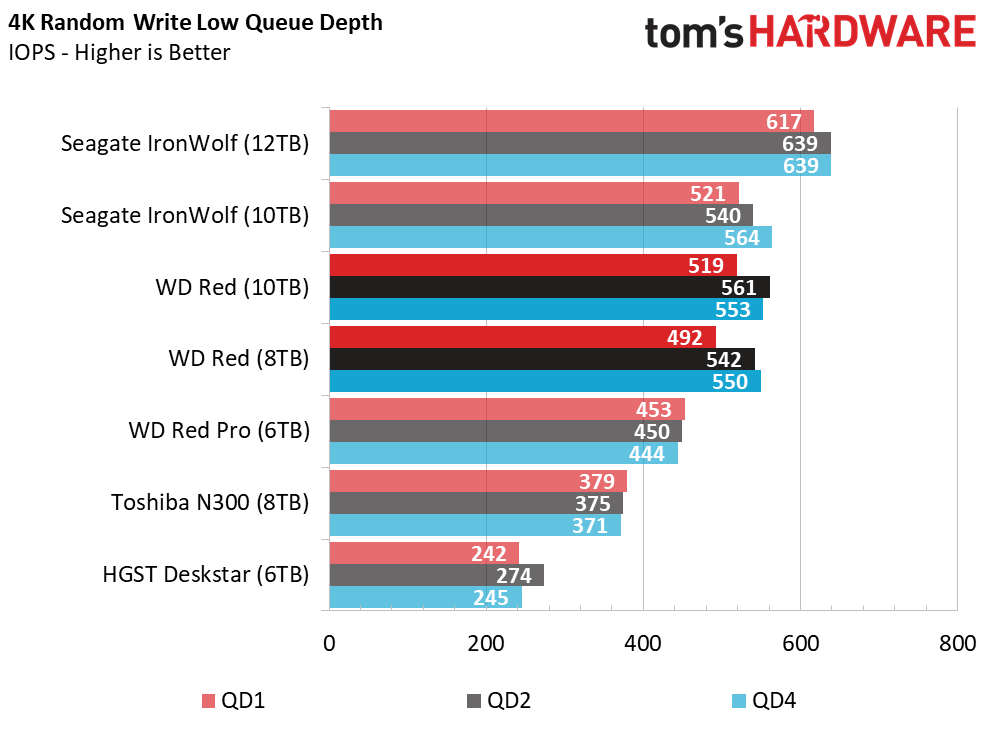
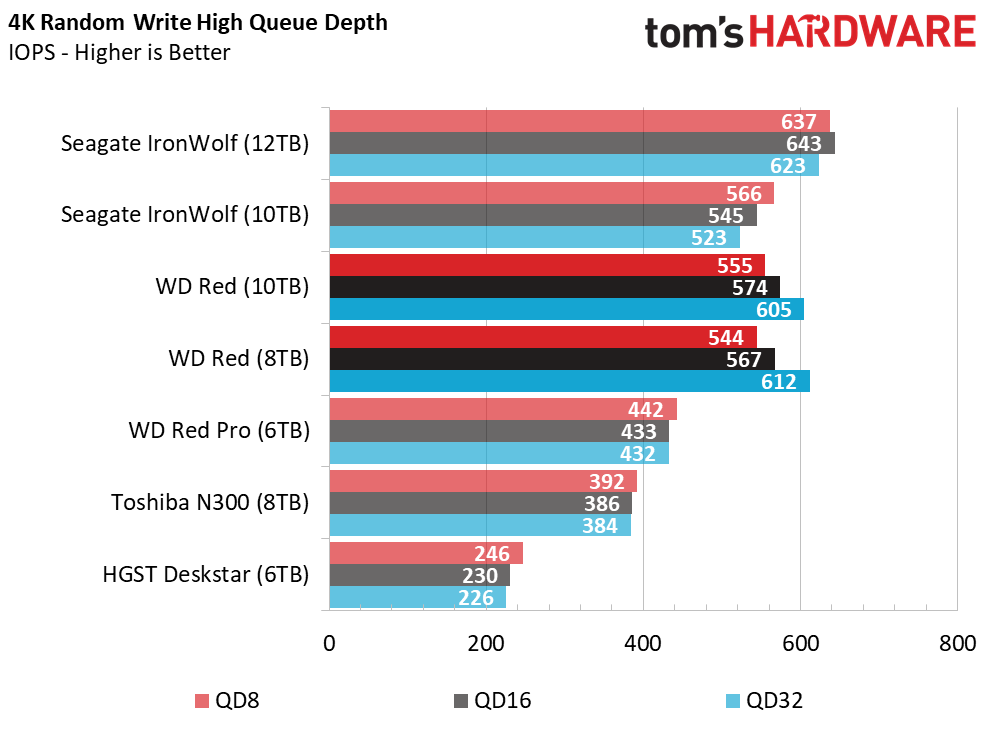
The 10TB Red has a 256MB DRAM buffer and the 8TB only has a 128MB buffer, so we expected a bigger performance delta between the two dives during the random write workload.
80% Mixed Sequential Workload
We describe our mixed workload testing in detail here and describe our steady state tests here.
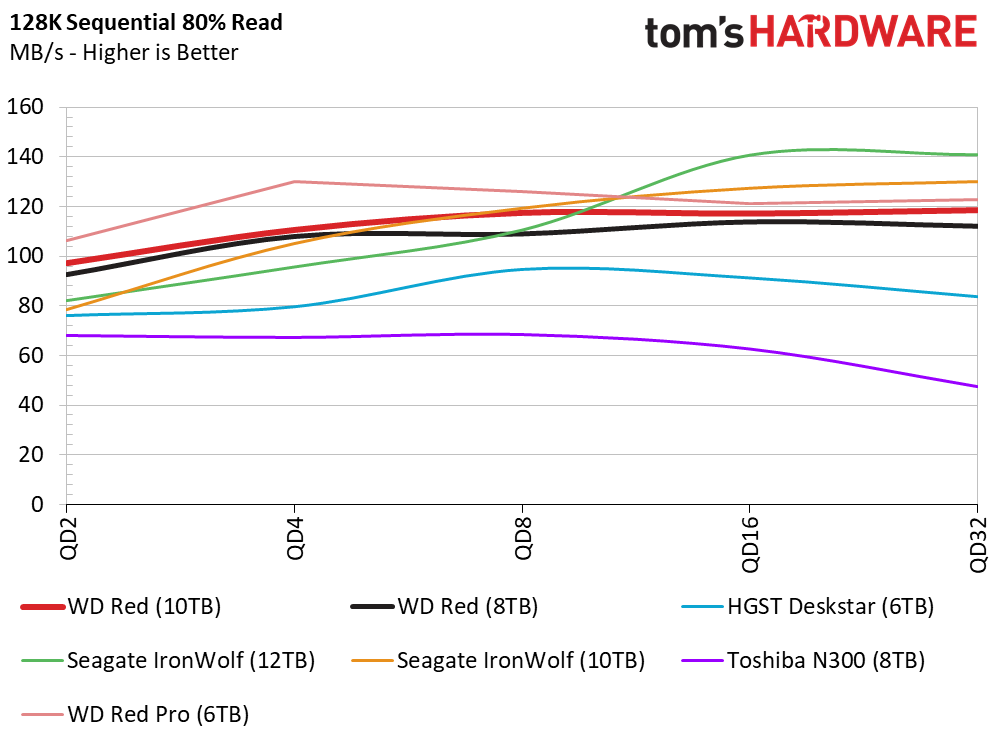
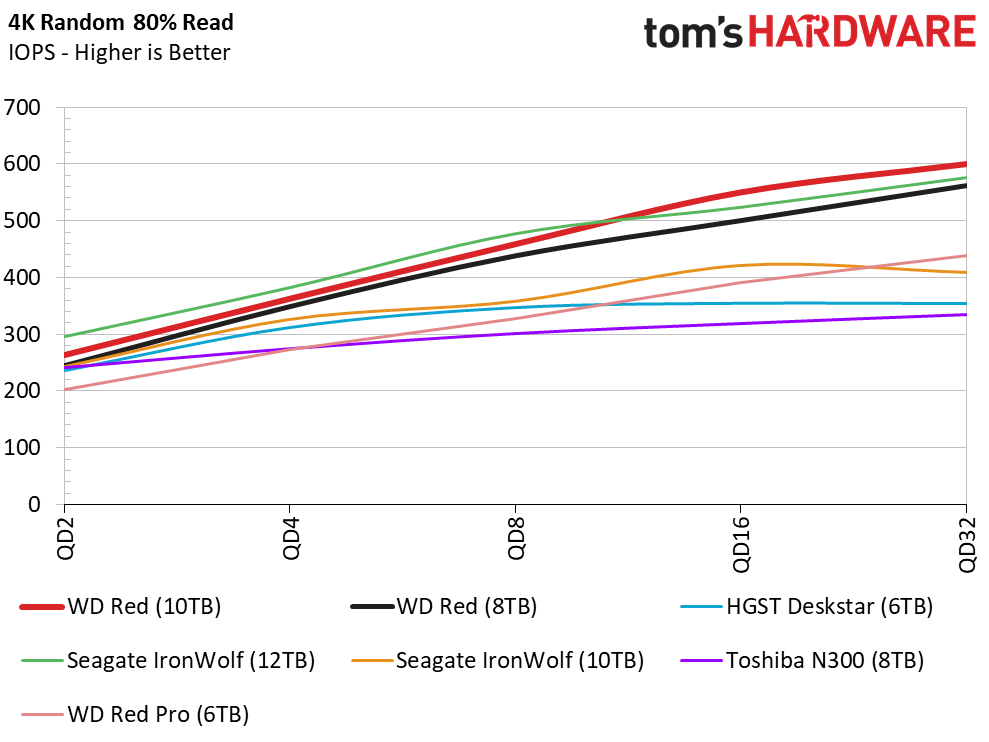
The Seagate IronWolf 12TB put on an impressive show in the four-corner tests. The Reds with Helium perform better at lower queue depths with a synthetic application (80% read) workload. The newer Reds also outperform the older 6TB Red Pro. The older 6TB HGST Deskstar NAS and new 8TB Toshiba N300 trail by a substantial margin.
80% Mixed Random Workload
The mixed random workload is the most likely to benefit from the additional DRAM cache in the Red 10TB, and we see it move well past the 8TB model during the test. Again, we're using a workload mixture commonly seen in desktop environments.
Sustained Mixed Sequential Workload
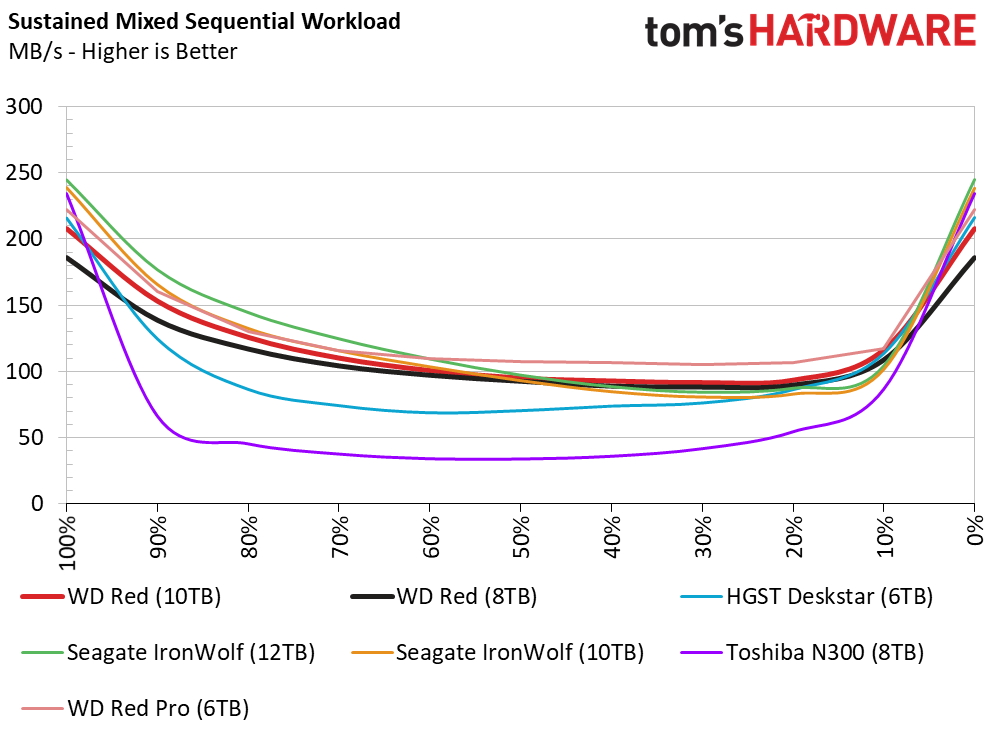
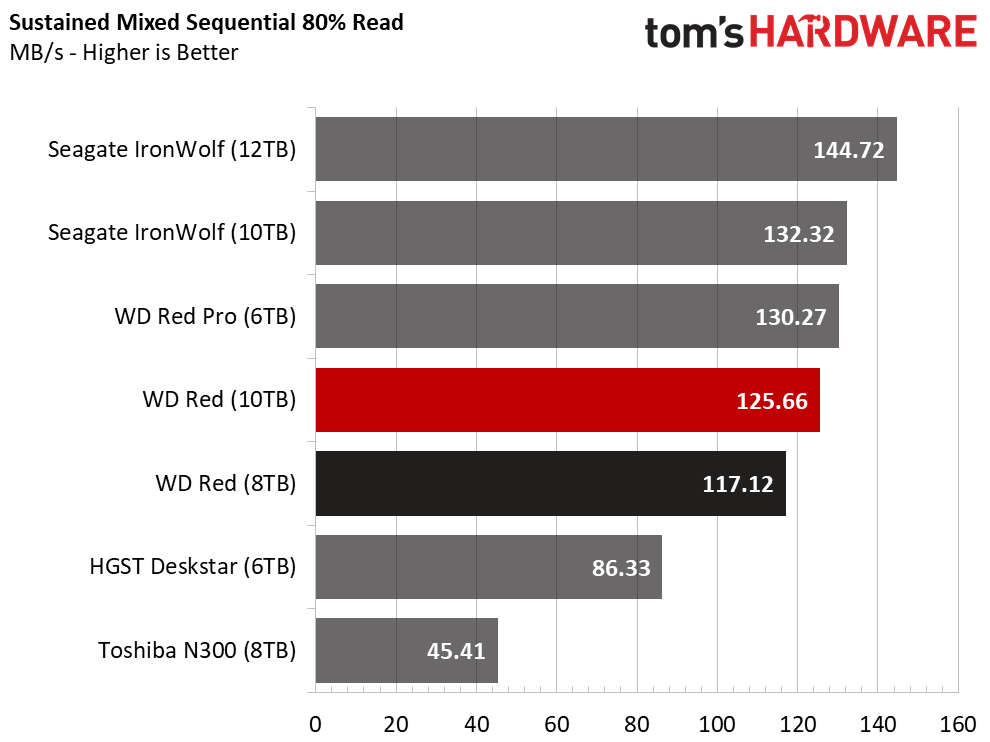
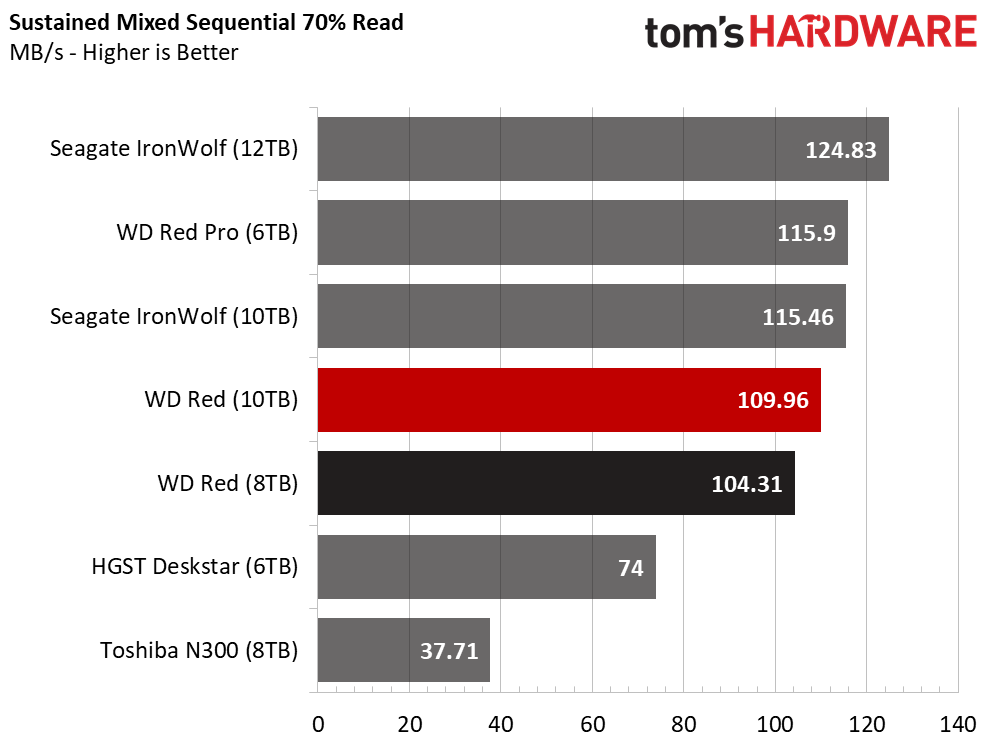
The chart shows us performance with 100% reads on the left, and 100% writes (or 0% reads) on the right. A 50% mix would be roughly equivalent to reading one file from the drive while writing another. For instance, in a perfect world, reading two media files while writing another would give you a 66% read workload.
Random Steady-State
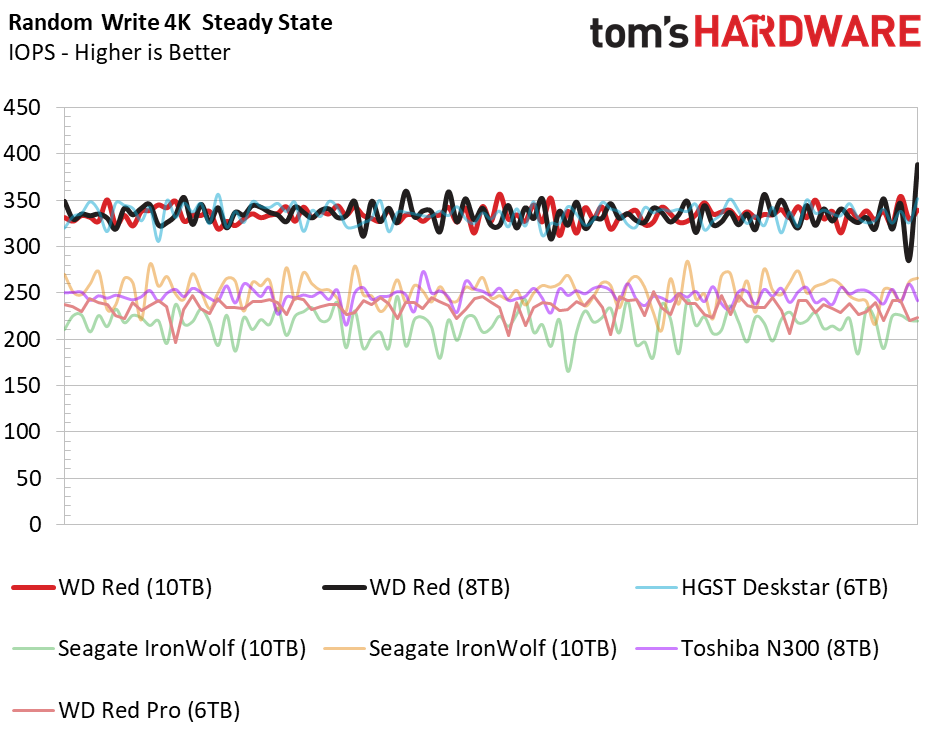
Writing 4KB random data to the full LBA range does not benefit from a performance increase due to the extra buffer capacity. That really doesn't matter because the new Helium-filled Reds join their kin at the top of this chart. They are well above the competition.
Here is the wacky thing: Modern disk drives deliver higher random steady-state performance than entry-level planar TLC NAND SSDs.
PCMark 8 Real-World Software Performance
For details on our real-world software performance testing, please click here.
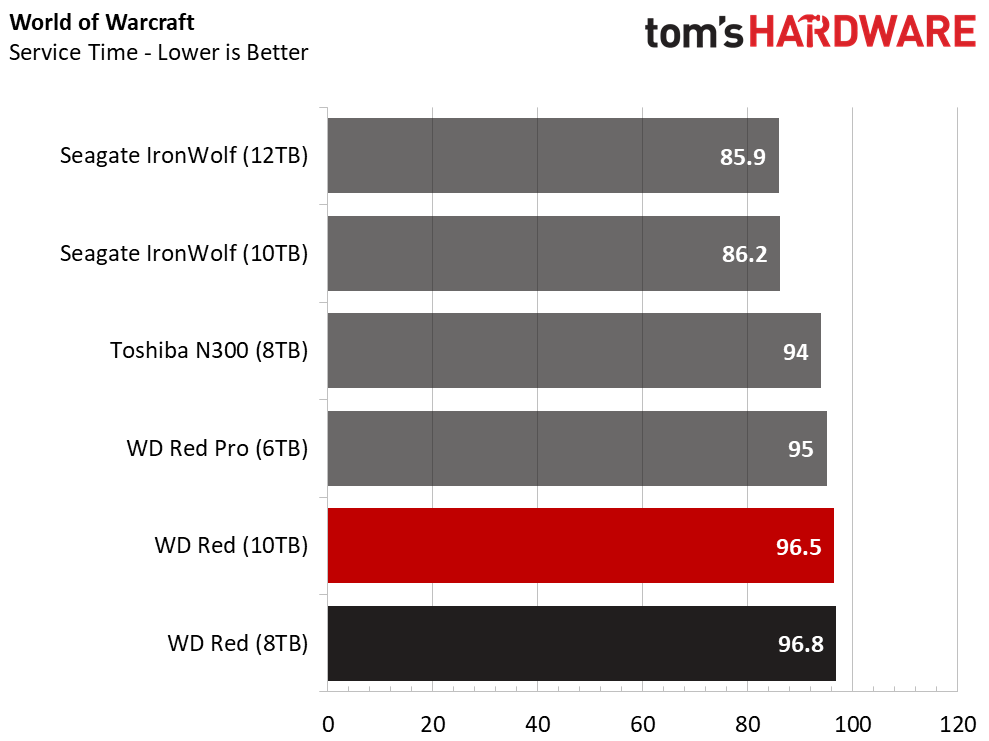
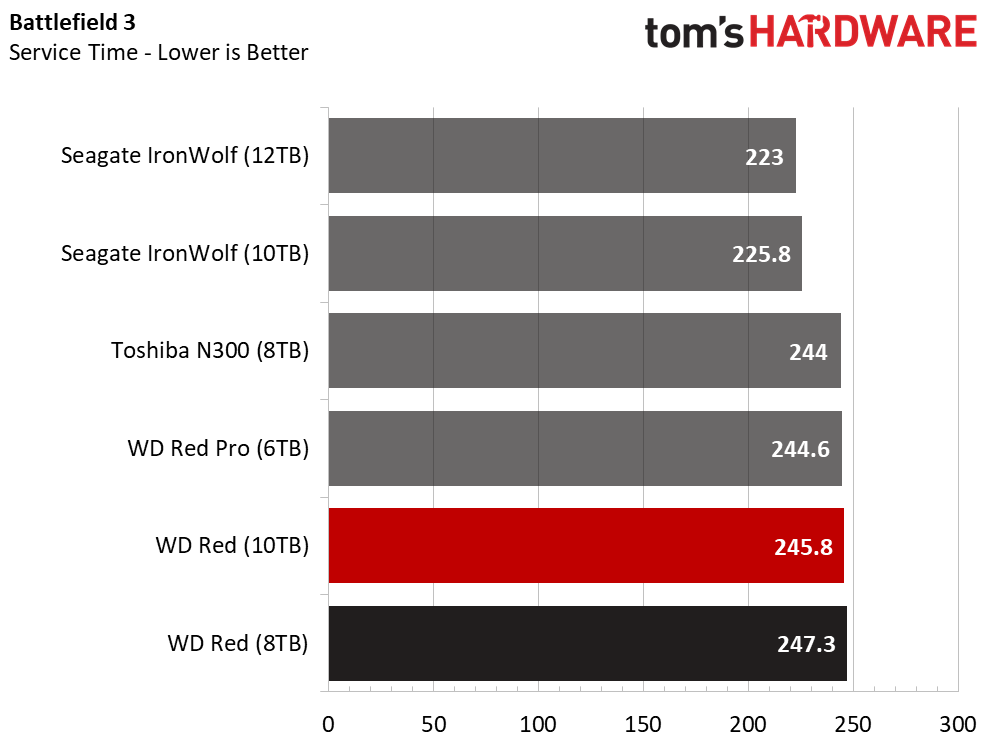
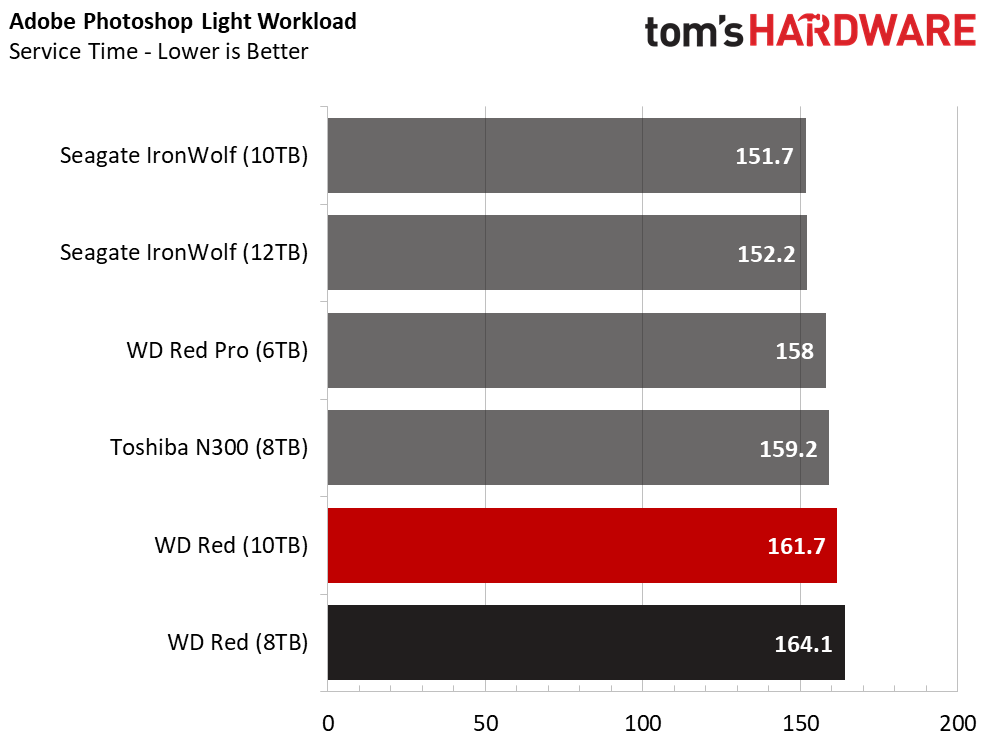
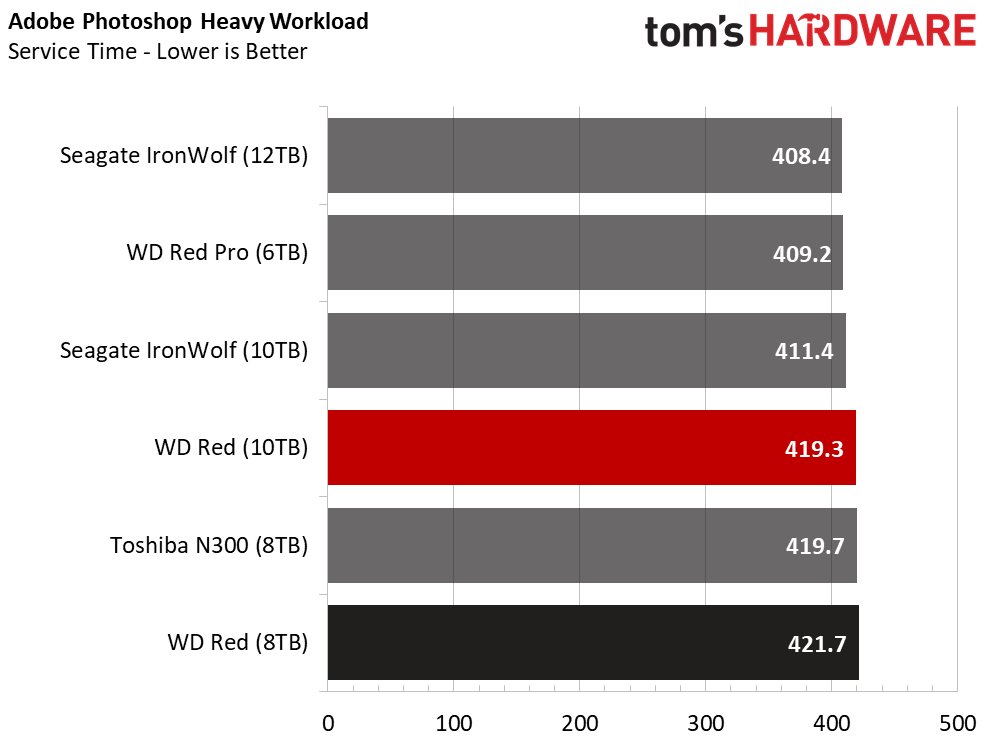
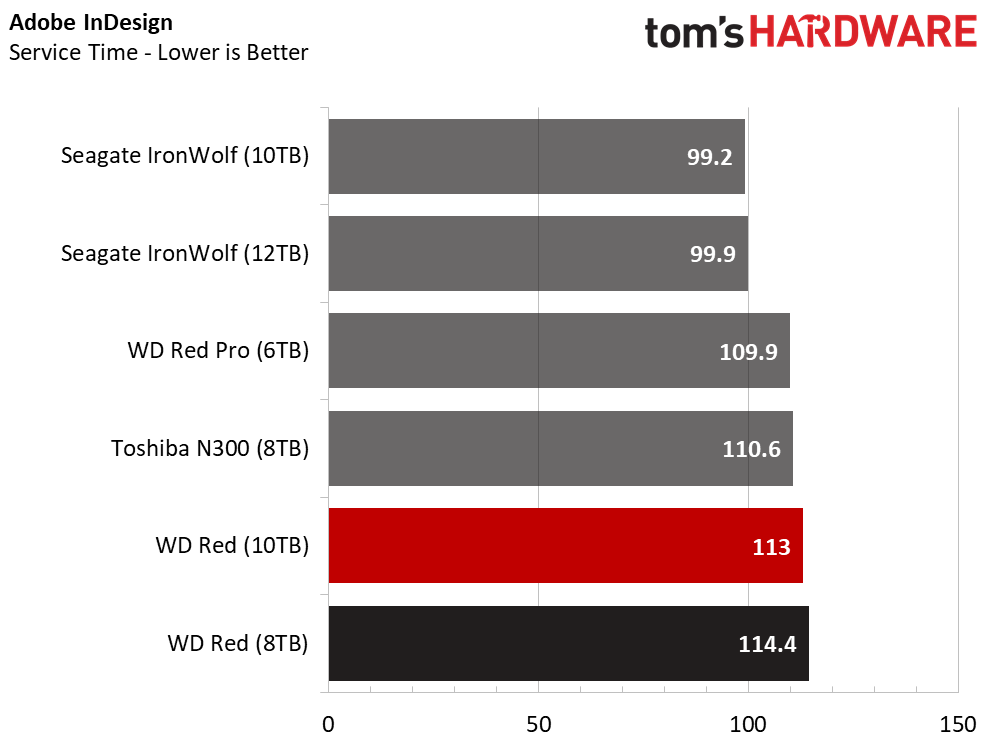
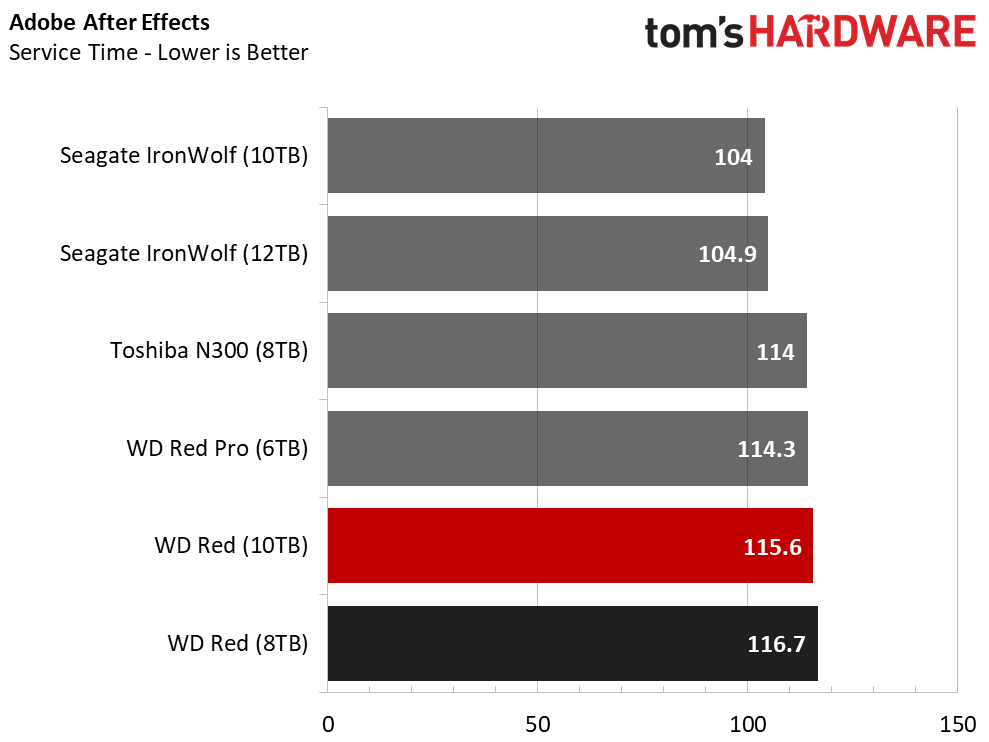
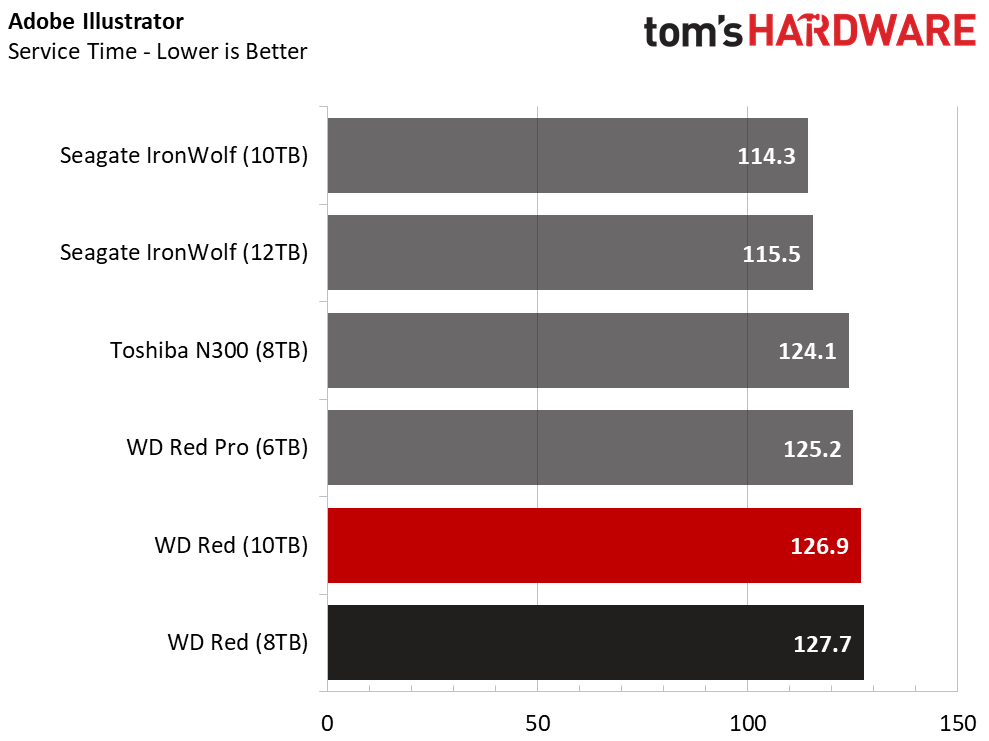
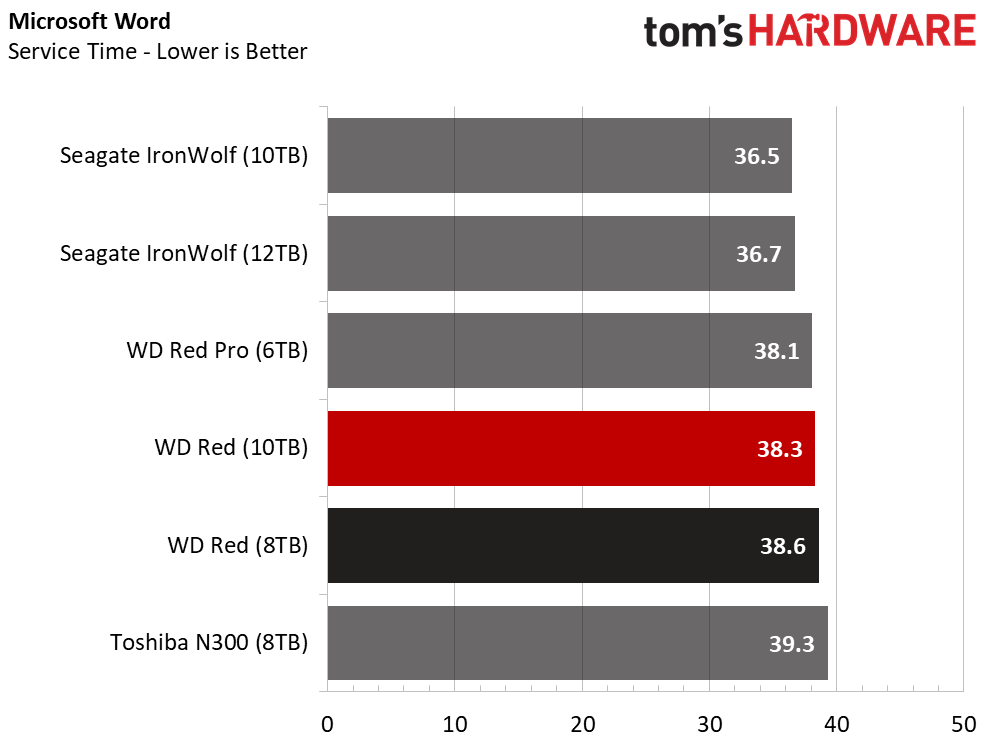
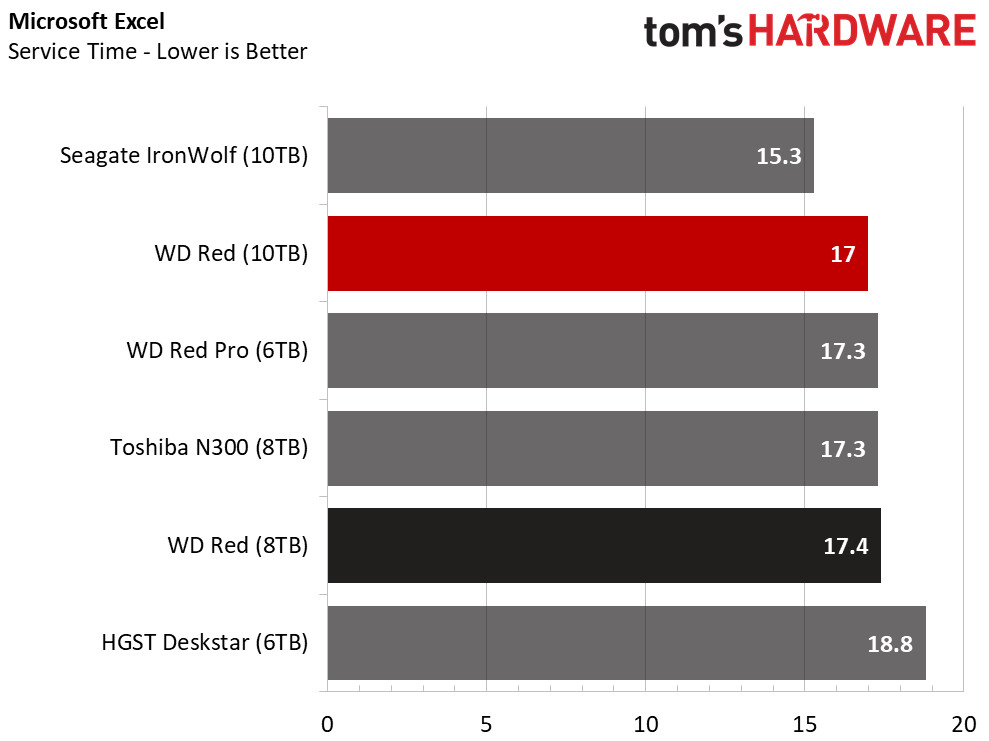
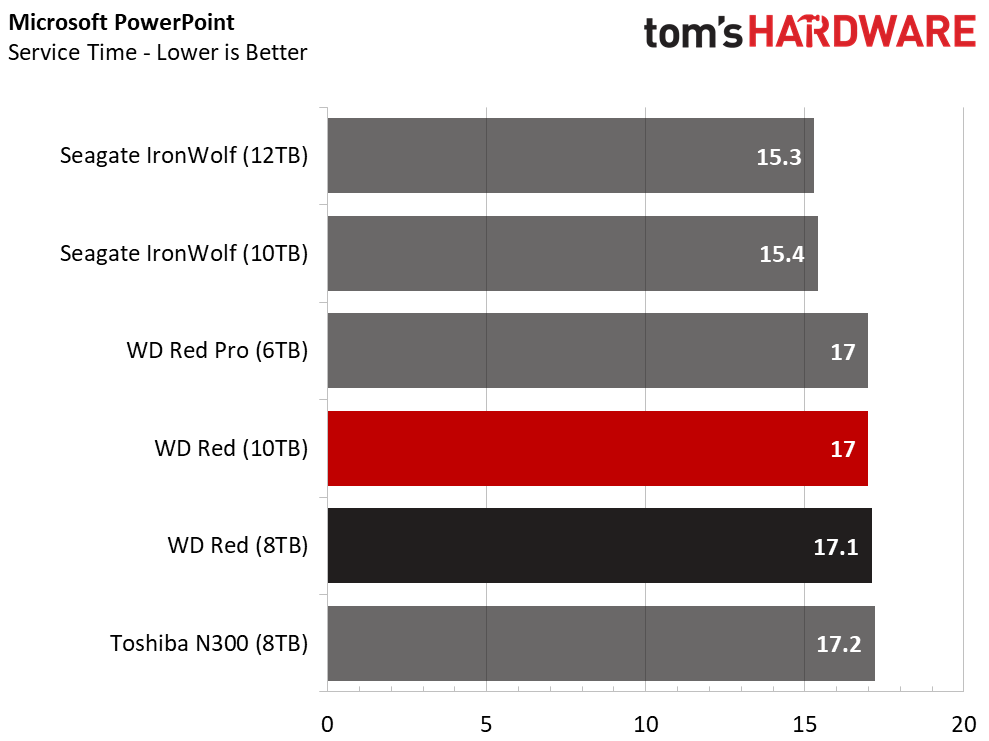
But don't get any ideas about disks making a comeback for your system drive, not without Optane Memory in front of it. None of the products in the charts were designed to run as your main system drive, so these tests are outside of the recommended use case.
Application Storage Bandwidth
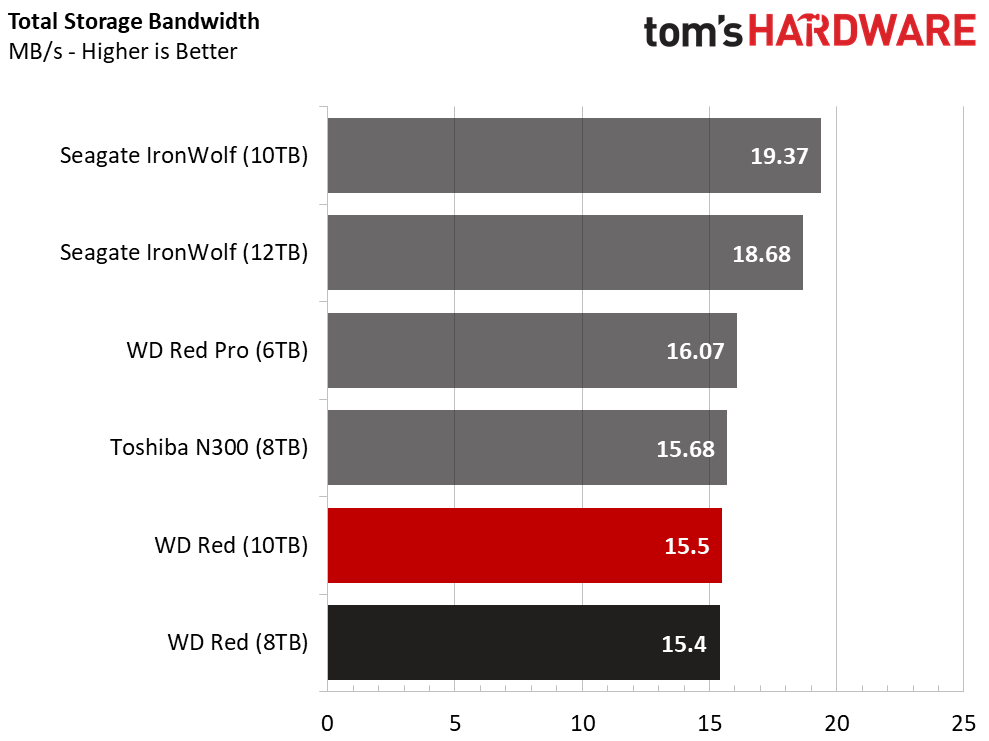
We still like to run the test to gauge system performance and to compare to other products. The two new Red products fall to the bottom of our chart behind the rest of the drives.
MORE: Best SSDs
MORE: How We Test HDDs And SSDs
MORE: All SSD Content

Chris Ramseyer was a senior contributing editor for Tom's Hardware. He tested and reviewed consumer storage.
-
Giroro It's a shame these aren't 7200 RPM. Are there 7200 RPM drives out there with the helium goodness?Reply -
AndyWiryaPeaceful These drives are meant to be used in a quiet RAID environment. If you want 7200RPM RAID Drives for editing / rendering, you should use WD RE series instead.Reply -
kellysi I had a Western Digital a few years back and had problems with sectors, basically, it wasn't usable, that put me off for good, I do realize that might have been just my bad luck.Reply -
mitch074 I've just built a Synology NAS for myself using a couple 8Tb Red - happy as a clam! I have 2 extra bays free in the NAS, and Synology allows transparent migration from a RAID-1 array to a RAID-5 one, so I can drop 16 Tb of extra storage tomorrow and get them as pure storage with better performance. Happy!Reply -
MichaelElfial ANDYWIRYAPEACEFUL, the 7200 rpm will probably be a minus for the Reds. These are the only series that give you HDD with a significantly lower power consumption - just check the specs and check the NAS disks from Seagate for instance or any other model you choose. Yes the specs are mostly correct, I have 6 DIY boxes that one can call NAS or NAS-like (in some cases ;) ) and both the power consumption and temperatures are notably lower than boxes filled with other disks. The performance is good, especially for storage and not great, but acceptable for application usage as the review said - it applies to the old models even more. The balance of the features is Ok in my opinion and speeding the platters up will only give you something like a not so good equivalent to the new Gold series. The Golds are very quiet, but their temperatures are not as low as with the Reds, they are also faster and much better in random access scenarios - much better than what you would expect from just speeding up the rotation. So, every scenario has its specific demands and after using these for a few years I find them quite well designed for the most NAS usage scenarios. as for the bad sectors KELLYSI mentioned - I had some problems too, but in each case (thankfully) everything was corrected after full format (takes a lot of time with these capacities) - from 10+ Reds this happened to only one and it was from the first 3TB models (6TB were not available yet).Reply -
mras Would love to have seen HGST He12 or He10 included.Reply
They sell for less here, and is remarkable quiet (about same, or lower, as my current WD green 5400rpm, that they replaced, vs the 7200rpm).
They use quite low power as well.
And yes, i would else agree with 5400rpm is better for consumers for archive usage.
