Gaming Shoot-Out: 18 CPUs And APUs Under $200, Benchmarked
Now that Piledriver-based CPUs and APUs are widely available (and the FX-8350 is selling for less than $200), it's a great time to compare value-oriented chips in our favorite titles. We're also breaking out a test that conveys the latency between frames.
Introducing A New Test: Frame Time Variance
As you may have noticed in a handful of our more recent graphics stories, we're working toward a new type of test standard that measures the impact of changes in frame rate latency. Historically, average frame rate, represented by frames per second (FPS), was our primary go-to for comparing the performance of graphics cards relative to each other. However, Scott Wasson of The Tech Report has put in a tremendous effort demonstrating where average frame rate comes up short in characterizing your experience gaming on a specific graphics subsystem.
By now, whether through Scott's work or our own, you're probably familiar with the phenomenon known as micro-stuttering, which is often associated with multi-card CrossFire or SLI configurations. This occurs when the amount of time that passes between frames appearing on-screen is inconsistent, resulting in what appears to be choppy gameplay, even in spite of high average frame rates. For example, two different PCs, both generating an average of 24 frames per second, may convey different experiences, one stuttery and one smooth, if the amount of time between each frame is less regular on one and more regular on the other.
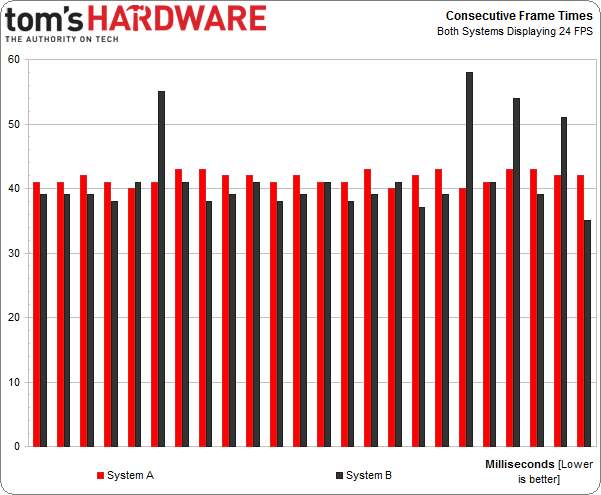
In the chart below, System A sees a consistent amount of time between those 24 frames, while System B does not. Therefore, you may notice a stuttering effect on System B, even though both machines still average 24 FPS.
As you can see, System B has four frames that take significantly longer to render. System A is more consistent. The issue is easy to identify when we go beyond the average frame per second rate, and look at the frame times inside that second. But because most of our time-based benchmarks run for a while (at least a minute) in order to generate plenty of data, that would give us 3,600 data points at 60 FPS, at least. That's simply too much to squeeze onto an easily-digestible chart. Zooming in to a portion of the graph helps. However, how do you pick the most relevant slice to dissect? There's no easy answer.
In addition, raw frame times aren't the end-all in performance analysis because high frame rates have low corresponding frame times and low frame rates have high frame times. What we're trying to find is the variance, the amount of time that anomalous frames stray from the ideal norm.
Our preference is to take this data and put it into a simple, meaningful format that's easy to understand and analyze. To do this, we won't scrutinize the individual frame times, but we'll look closely at the difference (or variance) between the time it takes to display a frame compared to the ideal time it should take to display the frame based on the average of the frames surrounding it.
For example, in the chart above the average frame time for System B is just under 40 milliseconds. But four frames from System B suffer from abnormally long lag times from about 10 to 20 milliseconds, compared to the 40 millisecond average.
Get Tom's Hardware's best news and in-depth reviews, straight to your inbox.
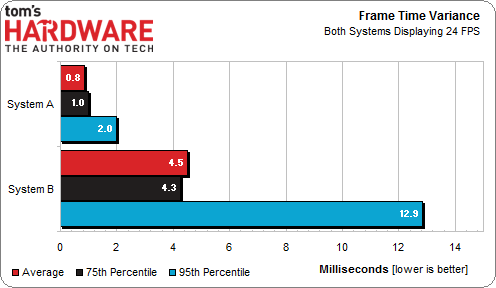
To describe this phenomenon, the frame time variance chart we're introducing today includes the average time variance across the entire benchmark, the 75th percentile time variance, and the 95th percentile time variance. Percentiles show us how bad things get, on average, over a larger sample. As a case in point, the 75th percentile result shows us the longest (worst) frame time variance that we see in the shortest (best) 75 percent of the samples, and so on with the 95th percentile.
Below, you'll find an example of how our frame time variance chart would describe the difference between System A and System B in the consecutive frame time chart presented above.
As you can see, this chart does not reflect raw frame rates. That's not its job. And that's fine with us because we're still going to continue capturing average frame rate for the foreseeable future. It may not tell the entire performance story, but it remains an important metric. We're simply adding the new data to help fill in the blanks.
Our hope is that, by comparing the results across different CPUs, we'll be able to identify issues where some models experience significantly higher latencies than we previously quantified. As you'll see in the results, each game has a different average frame time variance, too.
Current page: Introducing A New Test: Frame Time Variance
Prev Page Under $200: Do You Buy A Dual- Or Quad-Core CPU? Next Page Test System And BenchmarksDon Woligroski was a former senior hardware editor for Tom's Hardware. He has covered a wide range of PC hardware topics, including CPUs, GPUs, system building, and emerging technologies.
-
esrever Wow. Frame latencies are completely different than the results on the tech report. Weird.Reply -
ingtar33 so... the amd chips test as good as the intel chips (sometimes better) in your latency test, yet your conclusion is yet again based on average FPS?Reply
what is the point of running the latency tests if you're not going to use it in your conclusion? -
shikamaru31789 I was hanging around on the site hoping this would finally get posted today. Looks like I got lucky. I'm definitely happy that newer titles are using more threads, which finally puts AMD back in the running in the budget range at least. Even APU's look like a better buy now, I can't wait to see some Richland and Kaveri APU tests. If one of them has a built in 7750 you could have a nice budget system, especially if you paired it with a discrete GPU for Crossfire.Reply -
hero1 ingtar33so... the amd chips test as good as the intel chips (sometimes better) in your latency test, yet your conclusion is yet again based on average FPS?what is the point of running the latency tests if you're not going to use it in your conclusion?Reply
Nice observation. I was wondering the same thing. It's time you provide conclusion based upon what you intended to test and not otherwise. You could state the FPS part after the fact. -
Anik8 I like this review.Its been a while now and at last we get to see some nicely rounded up benchmarks from Tom's.I wish the GPU or Game-specific benchmarks will be conducted in a similar fashion instead of stressing too much on bandwidth,AA or using settings that favor a particular company only.Reply -
cleeve ingtar33so... the amd chips test as good as the intel chips (sometimes better) in your latency test, yet your conclusion is yet again based on average FPS?what is the point of running the latency tests if you're not going to use it in your conclusion?Reply
We absolutely did take latency into account in our conclusion.
I think the problem is that you totally misunderstand the point of measuring latency, and the impact of the results. Please read page 2, and the commentary next to the charts.
To summarize, latency is only relevant if it's significant enough to notice. If it's not significant (and really, it wasn't in any of the tests we took except maybe in some dual-core examples), then, obviously, the frame rate is the relevant measurement.
*IF* the latency *WAS* horrible, say, with a high-FPS CPU, then in that case latency would be taken into account in the recommendations. But the latencies were very small, and so they don't really factor in much. Any CPUs that could handle at least four threads did great, the latencies are so imperceptible that they don't matter.
-
cleeve esreverWow. Frame latencies are completely different than the results on the tech report. Weird.Reply
Not really. We just report them a little differently in an attempt to distill the result. Read page 2. -
cleeve Anik8.I wish the GPU or Game-specific benchmarks will be conducted in a similar fashion instead of stressing too much on bandwidth,AA or using settings that favor a particular company only.Reply
I'm not sure what you're referring to. When we test games, we use a number of different settings and resolutions.
-
znakist Well it is good to see AMD return to the game. I am an intel fan but with the recent update on the FX line up i have more options. Good work AMDReply

