AMD A10-7800 APU Review: Kaveri Hits the Efficiency Sweet Spot
AMD recently introduced another model in its A-series APU family called the A10-7800. While we already know a lot about the Kaveri architecture, this particular chip's power profile makes it more interesting than the performance-oriented incarnations.
Power Draw: Efficiency
Next, we’ll use the A10-7700K and -7850K's unlocked multiplier to approximate the performance level or power draw of the A10-7800, one at a time.
Overclocking AMD's A10-7700K To Approximate An A10-7800's Speed
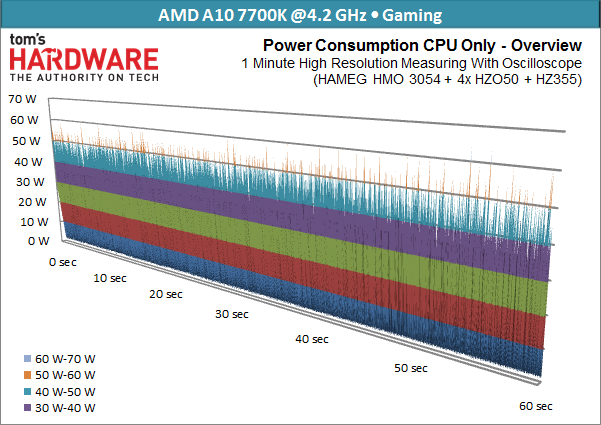
We put the lower-end APU into overdrive by overclocking its host and graphics processing blocks, simultaneously increasing the TDP ceiling to achieve similar performance in our three benchmarked games. But while we can get power consumption to rise, the -7700K just can't match the -7800's frame rates. One explanation is that we had to boost the x86 cores to 4.2 GHz to compensate for the pruned GPU, but we couldn't overclock the graphics engine enough to make up for the missing shaders.
| Header Cell - Column 0 | Minimum | Maximum | Average A10-7700K Overclock | Average A10-7800 |
|---|---|---|---|---|
| CPU +12 V | 16.8 W | 64.8 W | 39.6 W | 32.0 W |
| Motherboard +12V | 0.0 W | 19.2 W | 8.2 W | 7.1 W |
| Motherboard +3.3 V | 0.3 W | 0.4 W | 0.4 W | 0.1 W |
| Motherboard +5 V | 0.5 W | 2.3 W | 1.4 W | 1.1 W |
| System Total | 23.1 W | 76.3 W | 49.6 W | 40.3 W |
Apart from the fact that we couldn’t match the A10-7800’s performance level, power draw increased by a whopping 9 W (or 24%).
Underclocking The A10-7850K To Approximate The A10-7800
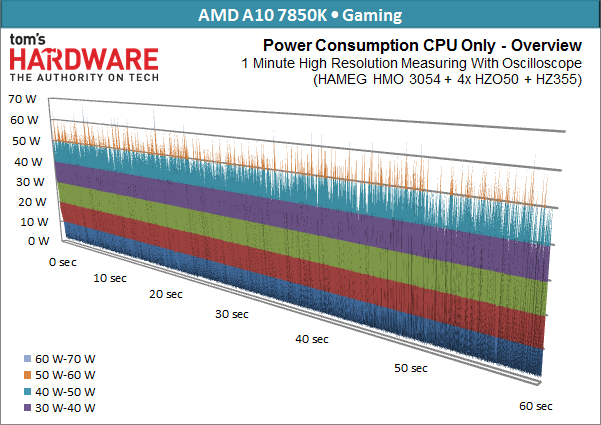
Now we're reducing the A10-7850K's clock rate to match the -7800, and in a second test adjusting the TDP target to match the -7800’s power consumption.
It turns out that the A10-7850K is 2-5% faster during gaming. Similarly, its CPU performance is up to 5% higher. However, power draw is up to 29% higher! This is proof that the A10-7850K was tuned more for performance than efficiency. AMD wanted to put its best foot forward in the benchmarks, and as as a result the -7850K operates beyond Kaveri's sweet spot at the expense of efficiency.
| Header Cell - Column 0 | Minimum | Maximum | Average A10-7850K | Average A10-7800 |
|---|---|---|---|---|
| CPU +12 V | 7.2 W | 69.6 W | 41.3 W | 32.0 W |
| Motherboard +12 V | 0.0 W | 19.2 W | 8.1 W | 7.1 W |
| Motherboard +3.3 V | 0.3 W | 0.5 W | 0.4 W | 0.1 W |
| Motherboard +5 V | 0.5 W | 2.3 W | 1.5 W | 1.1 W |
| System Total | 18.1 W | 81.3 W | 51.3 W | 40.3 W |
Comparison After Underclocking
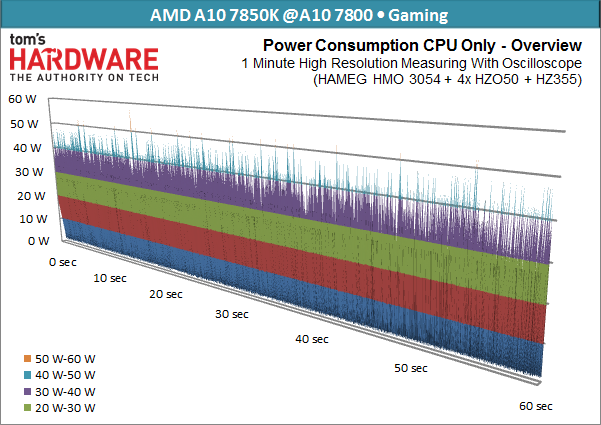
When we underclock the A10-7850K to the -7800’s power level, we experience 1.5%-lower gaming performance. This is a small difference though, which could be the result of any number of variables.
What we really show is that the A10-7800 is basically a factory-underclocked A10-7850K and not a brand new APU. Besides lower stock clock rates, it lacks the -7850K’s unlocked multiplier.
Get Tom's Hardware's best news and in-depth reviews, straight to your inbox.
| Header Cell - Column 0 | Minimum | Maximum | Average A10-7850K @ A10-7800 | Average A10 7800 |
|---|---|---|---|---|
| CPU 12V. | 12.6 W | 58.0 W | 32.2 W | 32.0 W |
| Motherboard +12 V | 0.0 W | 21.6 W | 7.4 W | 7.1 W |
| Motherboard +3.3 V | 0.0 W | 0.2 W | 0.1 W | 0.1 W |
| Motherboard +5 V | 0.1 W | 1.9 W | 1.1 W | 1.1 W |
| System Total | 13.0 W | 76.1 W | 40.7 W | 40.3 W |
AMD positions its A10-7800 perfectly, hitting the right balance between power and performance for Kaveri. The chip's default frequencies constitute the best compromise between performance and power consumption. The -7850K's disadvantage against the -7800 comes from the x86 cores, which are more efficient at the -7800's lower clock rate, while not limiting the APU's graphics component.
Current page: Power Draw: Efficiency
Prev Page Power Draw: Overview Next Page Power Draw: Comparing the Logs
Igor Wallossek wrote a wide variety of hardware articles for Tom's Hardware, with a strong focus on technical analysis and in-depth reviews. His contributions have spanned a broad spectrum of PC components, including GPUs, CPUs, workstations, and PC builds. His insightful articles provide readers with detailed knowledge to make informed decisions in the ever-evolving tech landscape
-
blackmagnum Just to wonder if Microsoft or Sony were to put this chip in their next gaming consoles and give those gamers a fighting chance.Reply -
tiger15 You are stressing power efficiency.Reply
What about comparing those numbers with other offerings? (Intel?) -
Memnarchon Reply13989815 said:Just to wonder if Microsoft or Sony were to put this chip in their next gaming consoles and give those gamers a fighting chance.
Maybe the new consoles lack CPU power (even if they are 8 core, the 1,6Ghz/1,75Ghz cripples them), their GPU part is far more powerful than existing APUs.
PS4's GPU has cores like 7870 and XBOX1 has cores like 7790, in other words more powerful than the 512 core R7 which exists in today's best APU A10-7850K. -
Cryio Wait. You can now CrossFire A10 7850 with GPUs other than the 240 and 250X?Reply
I have a friend with a 7850K and a 260X and he's dying to know if he can CrossFire.
"I see no point in buying a processor that emphasizes on-die graphics and then adding a Radeon R7 265X. Yes, AMD officially recommends it and yes, we tried it out." Can I take this as a yes ? -
gadgety The A8-7600 seems to be the effiency sweet spot in the Kaveri line up, specially at 45W. Trying to compare with of the A10-7800 with the A8-7600, although as far as I can tell just about ALL your tests seem to be done at different settings (e.g. BioShock Infinity is run at Medium Quality Presets rather than the lowest settings as in the test of the A10-7800) so the comparison isn't straightforward. A8-7600 is within 91-94% of the A10-7850K. One item which is comparable is video encoding in Handbrake, where the A8-7600 is at 92.8% of the 7850k, whereas the A10-7800 is at 95.7% of the 7850k. Price wise you'd pay a 63% premium for the A10-7800 over the A8-7600 to get an extremely minute performance advantage, around 3% or so.Reply -
Drejeck Reply
Not accurate.13989815 said:Just to wonder if Microsoft or Sony were to put this chip in their next gaming consoles and give those gamers a fighting chance.
Maybe the new consoles lack CPU power (even if they are 8 core, the 1,6Ghz/1,75Ghz cripples them), their GPU part is far more powerful than existing APUs.
PS4's GPU has cores like 7870 and XBOX1 has cores like 7790, in other words more powerful than the 512 core R7 which exists in today's best APU A10-7850K.
PS4 GPU is a crippled and downclocked 7850 (disabled cores enhance redundancy and less dead chips)
XB1 GPU is a crippled and downclocked R7 260X (as above) and like the 7790 should have AMD True Audio onboard, but they could have changed that. This actually means that CPU intensive and low resolution games are going to suck because the 8 cores are just Jaguar netbook processors.
The reality is that PS4 is almost cpu limited already and the XB1 is more balanced. Now that we've finished speaking of "sufficient" platforms let's talk about the fact that a CPU from AMD and the word efficient are in the same phrase. -
Memnarchon Reply
I think you need to do a little more research since: Reverse engineered PS4 APU reveals the console’s real CPU and GPU specs. "Die size on the chip is 328 mm sq, and the GPU actually contains 20 compute units — not the 18 that are specified. This is likely a yield-boosting measure, but it also means AMD implemented a full HD 7870 in silicon."13990605 said:Not accurate.
PS4 GPU is a crippled and downclocked 7850 (disabled cores enhance redundancy and less dead chips)
13990605 said:XB1 GPU is a crippled and downclocked R7 260X (as above) and like the 7790 should have AMD True Audio onboard, but they could have changed that. This actually means that CPU intensive and low resolution games are going to suck because the 8 cores are just Jaguar netbook processors.
The reality is that PS4 is almost cpu limited already and the XB1 is more balanced. Now that we've finished speaking of "sufficient" platforms let's talk about the fact that a CPU from AMD and the word efficient are in the same phrase.
The PS4 will be CPU limited? Since they write the code/API according to a hardware that it will remain the same for like 7-8 years, such thing as CPU limited especially for a console that runs the majority of games at 1080p, does not exist...
ps: I agree with the downclocked part since they need to save as much power as they can... -
blubbey Reply
Not accurate.13989815 said:Just to wonder if Microsoft or Sony were to put this chip in their next gaming consoles and give those gamers a fighting chance.
Maybe the new consoles lack CPU power (even if they are 8 core, the 1,6Ghz/1,75Ghz cripples them), their GPU part is far more powerful than existing APUs.
PS4's GPU has cores like 7870 and XBOX1 has cores like 7790, in other words more powerful than the 512 core R7 which exists in today's best APU A10-7850K.
PS4 GPU is a crippled and downclocked 7850 (disabled cores enhance redundancy and less dead chips)
XB1 GPU is a crippled and downclocked R7 260X (as above) and like the 7790 should have AMD True Audio onboard, but they could have changed that. This actually means that CPU intensive and low resolution games are going to suck because the 8 cores are just Jaguar netbook processors.
The reality is that PS4 is almost cpu limited already and the XB1 is more balanced. Now that we've finished speaking of "sufficient" platforms let's talk about the fact that a CPU from AMD and the word efficient are in the same phrase.
PS4 is 1152:72:32 at 800MHz, 7850 is 1024:64:32@ 900MHz or so (860MHz release?) It is not a "crippled 7850", the 7850 is a crippled pitcairn (20 CUs is the full fat 7870, PS4 has 18, 7850 16 CUs). "CPU limited" is very PC orientated thinking, things like offloading compute to the GPU will help. No, I'm not saying their CPUs are "good" but they will find ways of offloading that work onto the GPU. -
silverblue ReplyThe A8-7600 seems to be the effiency sweet spot in the Kaveri line up, specially at 45W. Trying to compare with of the A10-7800 with the A8-7600, although as far as I can tell just about ALL your tests seem to be done at different settings (e.g. BioShock Infinity is run at Medium Quality Presets rather than the lowest settings as in the test of the A10-7800) so the comparison isn't straightforward. A8-7600 is within 91-94% of the A10-7850K. One item which is comparable is video encoding in Handbrake, where the A8-7600 is at 92.8% of the 7850k, whereas the A10-7800 is at 95.7% of the 7850k. Price wise you'd pay a 63% premium for the A10-7800 over the A8-7600 to get an extremely minute performance advantage, around 3% or so.
Yes, but the A8-7600 has a 384-shader GPU. I suppose it depends on whether you want to use the GPU or not.


