AMD Radeon RX 460 Review
Power Consumption Results
Measurement Methodology & Graphical Illustration
Taking into account the lessons learned from our follow-up measurements of AMD's Radeon RX 480 and your feedback, we made some fundamental changes to the way we measure power consumption.
Our measurement intervals are now twice as long. There's also a hardware-based low-pass filter and software-based variable filter in place (the latter is a feature of the software used to analyze data; it's designed to evaluate the plausibility of very short load peaks and valleys). The resulting curves are a lot smoother than the old ones; we hope you derive more value from them as a result.
You'll find more information about our power consumption test methodology in The Math Behind GPU Power Consumption And PSUs.
You'll find a larger number of bar graphs, and higher-resolution versions of our power consumption charts that you can expand by clicking on them. We restructured our topic sections, added more comparison bar graphs, and, finally, added different scenarios to our measurements. In addition to power consumption, we also examine current to determine whether the graphics card stays within all of its relevant specifications. Our test equipment doesn't change, though:
| Power Consumption Measurement | |
|---|---|
| Test Method | Contact-free DC Measurement at PCIe Slot (Using a Riser Card) Contact-free DC Measurement at External Auxiliary Power Supply Cable Direct Voltage Measurement at Power Supply |
| Test Equipment | 2 x Rohde & Schwarz HMO 3054, 500 MHz Digital Multi-Channel Oscilloscope with Storage Function 4 x Rohde & Schwarz HZO50 Current Probe (1mA to 30A, 100 kHz, DC) 4 x Rohde & Schwarz HZ355 (10:1 Probes, 500 MHz) 1 x Rohde & Schwarz HMC 8012 Digital Multimeter with Storage Function |
Power Consumption at Different Loads
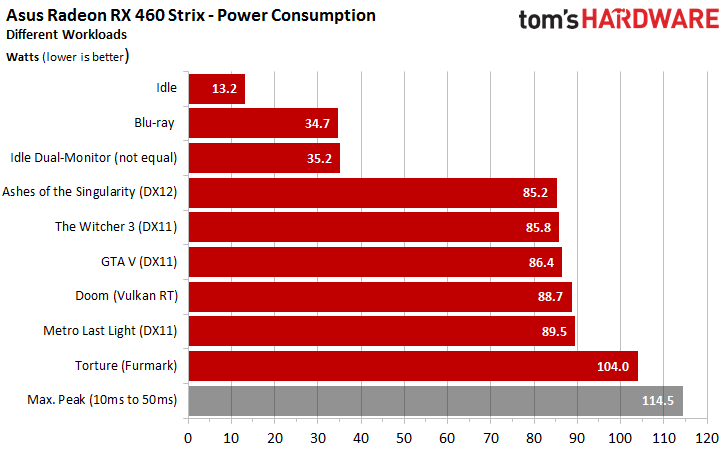
Similar to our Radeon RX 470 coverage, we're adding several games to our measurement suite, though the familiar Metro: Last Light benchmark also turns out to be the Radeon RX 460's biggest challenge. It’s followed closely by Doom, which generates numbers that are almost as high. However, there’s a difference of less than 3W between Ashes of the Singularity and Metro: Last Light. This means that Asus’ graphics card is consistently running close to or at its limit.
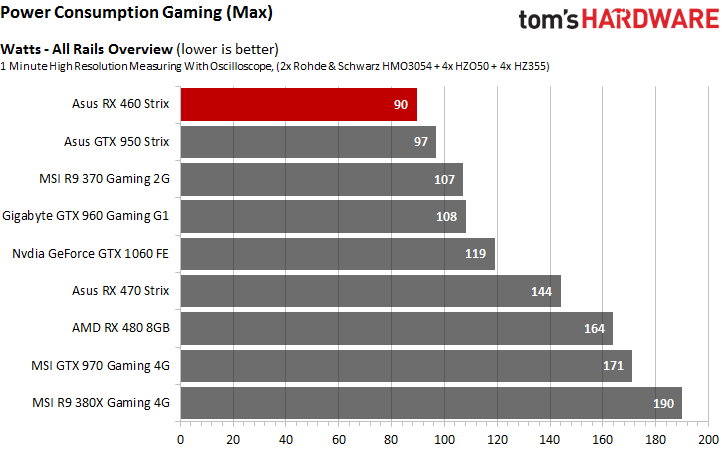
The Strix RX 460's almost 90W result is a lot higher than what we expected based on AMD’s pre-launch PR. Then again, this is Asus' interpretation of the RX 460, which benefits from factory overclocking in our performance charts, but pays the price when we measure power. We're pretty sure there will be other RX 460s that do away with the power connector altogether. Ultimately, you're the one who has to decide if performance headroom or an efficient card without a power connector is more important.
The gray bar represents power consumption based on those load peaks that made it through our filters to the smoother curve. That bar doesn't have any practical significance since the peaks we measured are too brief for them to matter (even if the shortest-duration ones were already filtered out by this point).
Get Tom's Hardware's best news and in-depth reviews, straight to your inbox.
Power Connector Load Distribution
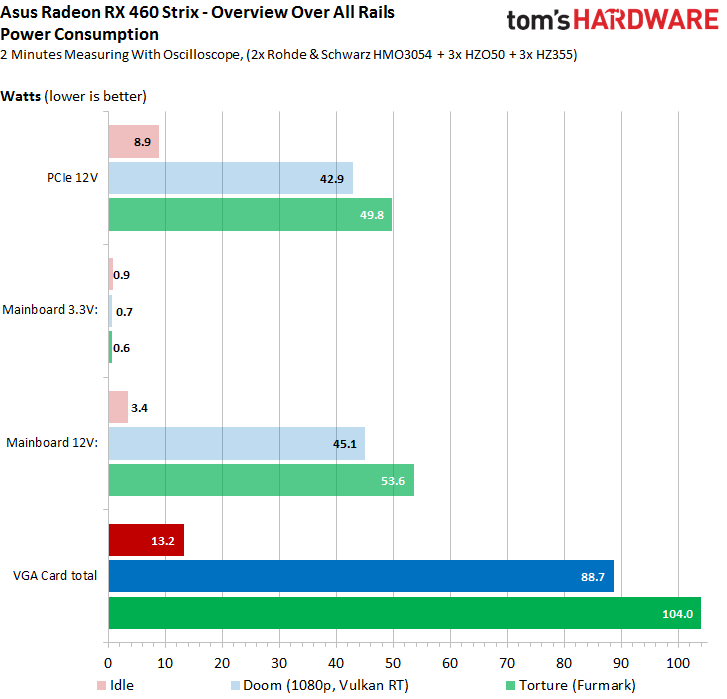
So, how’s the load distributed across the power rails during a realistic gaming load and a stress test? We aren't including the motherboard's 3.3V rail in this discussion, because it's barely used (up to 1W, but usually less than that).
Load on the two 12V rails (the motherboard slot connector and six-pin power connector) is balanced beautifully. There’s lots of room left on them both. Even additional overclocking efforts will never push Asus' Strix RX 460 beyond the limits set in its specifications.
Here are the corresponding graphs for gaming and our stress test. Click on them for a larger version.


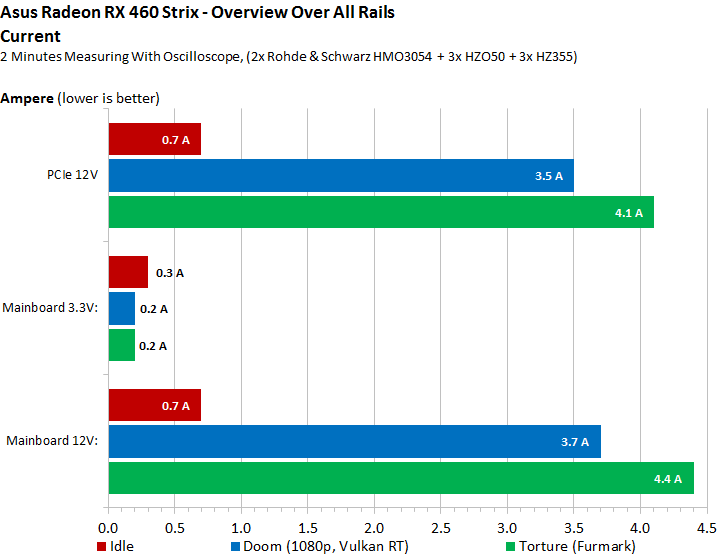
The PCI-SIG’s specifications only apply to current, meaning power consumption results on their own don't tell the whole story. Our readings put the motherboard slot just over 4A. Given a ceiling of 5.5A, this is most certainly on the safe side with lots of room to spare.
Of course, there are larger graphs for the current measurements as well.


Power Consumption Comparison with Other Graphics Cards
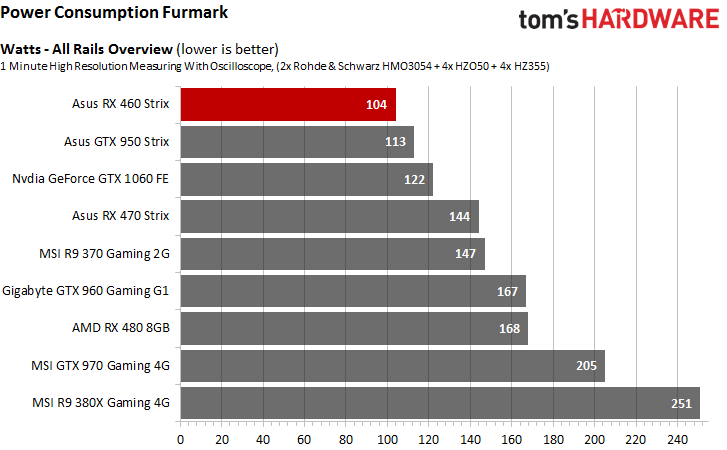
Finally, we’d like to know how the Strix RX 460 stacks up against other graphics cards. We're using the peak power consumption numbers for this comparison because they're what the previous results consisted of.
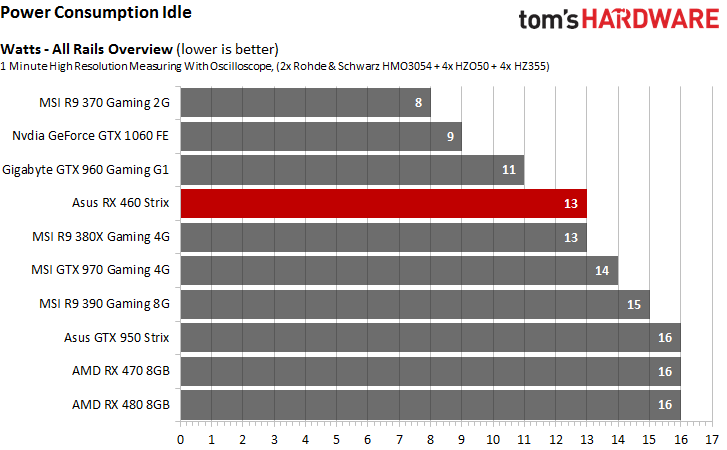
Gaming power consumption is much lower compared to older graphics cards. The same can't be said for Blu-ray playback and multi-monitor setups, though. Asus' Strix RX 460 lags way behind its competition in those disciplines.
AMD tells us that there's a fix for the high power consumption readings at idle and under partial loads. Unfortunately, it didn’t make it into the latest driver, which we used for these tests.
MORE: Best Graphics Cards
MORE: Desktop GPU Performance Hierarchy Table
MORE: All Graphics Content
Current page: Power Consumption Results
Prev Page Project CARS, StarCraft 2, Witcher 3 & Warcraft Next Page Frequency, Temperature & Noise Results-
gdmaclew Just curious as to why you are showing a link to Newegg for the AMD FX-8370 at $169.99? The actual price for that CPU at Newegg has been $189.99 for the past week.Reply
Edit: Should have thanked the authors for their excellent review first. Well done.
-
AndrewJacksonZA Thanks for the review Chris and Igor, I've been waiting for this one! Nicely structured, logical, easy to follow. :-)Reply
I agree with your conclusion: I've been looking for a replacement for my 6670 1GB DDR3 that I picked up in 2012 for $65 and this looks good. I was, however, expecting to see a MSRP of between $85 and $100.
Thanks again,
Andrew -
CaptainTom CURB STOMP!Reply
Very relieved this performed better than those leaked benchmarks. So it is indeed a 70w 7870 for $110.
The are already sold out btw lol -
turkey3_scratch The only one available is a Sapphire RX 460 and it is $170 on Amazon (it's also on Newegg but is sold out). So the RX 460 is being priced what the RX 470 was supposed to be. And the RX 470 is being priced what the RX 480 was supposed to be.Reply
Am I the only one having trouble figuring out where this sits performance-wise? It seems to be all over the place from game to game. CaptainTom, not sold out yet, 12 in stock https://www.amazon.com/Sapphire-Radeon-NITRO-Graphics-11257-02-20G/dp/B01J1M4HDS/ref=sr_1_2?ie=UTF8&qid=1470662745&sr=8-2&keywords=rx+460
Also, these Asus coolers suck. I'm definitely not going to be recommending any Asus card this generation. -
rush21hit This is it. For an entry-level and low powered $100 card at this caliber nVidia can't touch this. This is the winning chip.Reply
If there will ever be cutdown 1060 with 3B as planned, knowing nVidia, it won't even come near this price. -
AndrewJacksonZA Reply
I think that there's one very big thing that the RX 460 has in it's favour over it's older brethren: the new APIs.18404296 said:Am I the only one having trouble figuring out where this site performance-wise? -
turkey3_scratch Reply18404342 said:This is it. For an entry-level and low powered $100 card at this caliber nVidia can't touch this. This is the winning chip.
If there will ever be cutdown 1060 with 3B as planned, knowing nVidia, it won't even come near this price.
The 1060 is whoppingly better. Why would it ever come to this price? Pinch me also if you honestly see an RX 460 for $110. -
AndrewJacksonZA Reply
I think rush21hit was talking about the rumoured 3GB 1060 which was supposed to be "severely cut down," to put it mildly, not the real, actual 1060 which is in a whole different class. One can almost buy 3x 460s for 1x 1060.18404369 said:18404342 said:This is it. For an entry-level and low powered $100 card at this caliber nVidia can't touch this. This is the winning chip.
If there will ever be cutdown 1060 with 3B as planned, knowing nVidia, it won't even come near this price.
The 1060 is whoppingly better. Why would it ever come to this price? Pinch me also if you honestly see an RX 460 for $110.
Having said that... Let's just wait for the 1050 and 1040 to drop before we declare an absolute winner in this price segment, shall we? But right now, you are correct rush21hit, Nvidia has nothing to compete in this price range. I look forward to seeing the changed Best Graphics Cards for the Money article. ;-)
